201 W Avenue W · San Angelo, TX
Flood risk 4/10 · Minor
- FEMA flood zone
- X (shaded)
- Chance of flooding over 30 yrs
- 0.23%
- Est. flood insurance / yr
- $507 – $1,088
Fire risk 6/10 · Moderate
- Est. fire insurance / yr
- $1,222 – $2,270
Heat risk 7/10 · Major
- Hot days now (above 104°F)
- 7 days/yr
- Hot days in 30 yrs
- 22 days/yr
Wind risk 4/10 · Minor
- Chance of severe wind over 30 yrs
- 17.0%
Air-quality risk 1/10 · Minimal
- Unhealthy air days now
- 0 days/yr
- Unhealthy air days in 30 yrs
- 0 days/yr
Risk factors via First Street. Map © Google.
Why this score? — see what drove the B+ grade
The composite is a weighted blend of 9 inputs, each scored 0–100. Each bar is that input's sub-score; the figure is the points it added to the 100-point composite (weight × sub-score).
- Cash flow +29.5/30.0
- ARV discount +15.0/15.0
- DSCR +10.0/10.0
- 1% rule +8.1/10.0
- Rent growth +4.6/5.0
- Livability +3.7/5.0
- Schools +2.6/10.0
- Condition / age +2.5/5.0
- Appreciation +0.0/10.0
$110,000
🖨 Deal sheet 📄 Offer letter ✓ Due diligence
Listing remarks
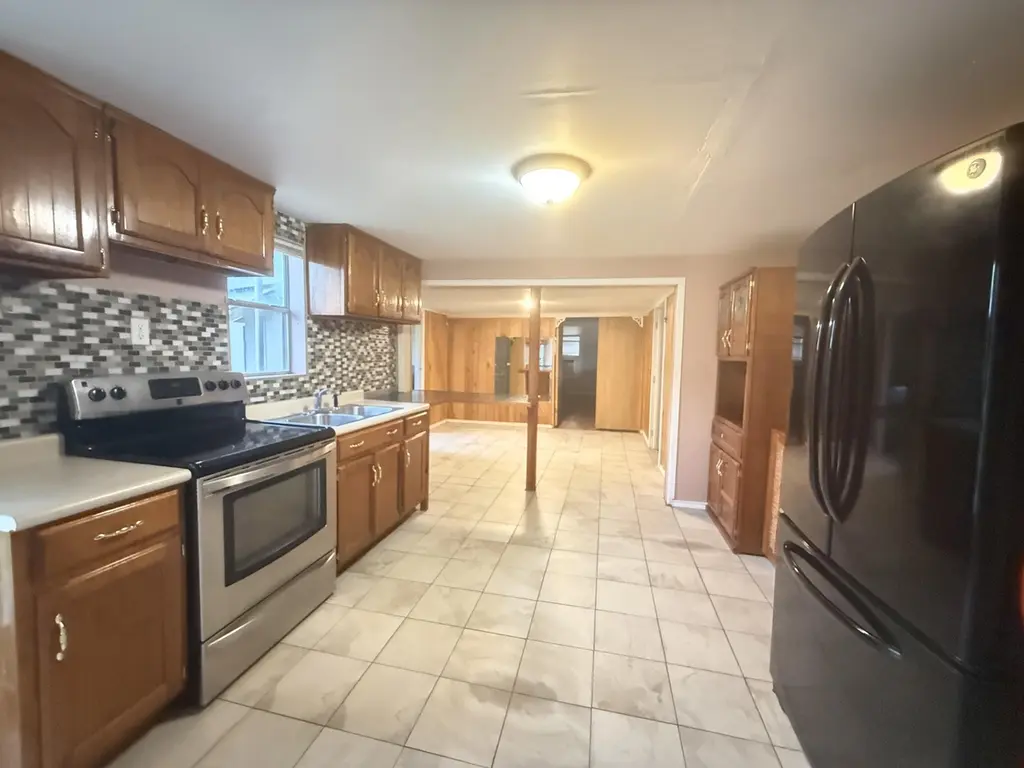
3 bed/ 1 bath home with a flexible layout and direct access to Jaime Padron Memorial Park right from the backyard. The home features an updated tiled walk-in shower, spacious kitchen with tile backsplash, large dining area, and laminate flooring in the bedrooms. A 9x9 bonus room off dining area offers extra flexibility and could be used as a study, office, dream pantry, hobby room, or additional storage space. Covered parking with additional driveway space. The park views create a peaceful backyard setting. Conveniently located near shopping and GAFB. Cash or conventional financing only. Great opportunity for an investor, rental property, or buyer looking for affordable space with potential
Key facts
- Covered parking
- Park views
- 9x9 bonus room
Tags
Property features AI
Exterior
- Parking: Carport (1 space); Driveway
- Utilities: Public water; Public sewer
- Home design: Single family residence; Residential property
- Construction: Brick, fiber cement and stone exterior; Pillar/post/pier foundation
- Exterior features: Paved public road frontage on a city street; Fencing (other); Shingle roof
Interior
- Kitchen: Electric cooktop
- Flooring: Laminate; Tile
- Bathrooms: 1 full bathroom
- Heating & cooling: Wall/window air conditioning units; Heating (other)
- Interior features: Electric cooktop; Laminate and tile flooring; Total of 8 rooms
- Laundry & utility: Washer hookup; Electric dryer hookup; Dedicated laundry room
Neighborhood map
What this means for you Summary
Snapshot
- This is a 3-bed/1.0-bath single-family listed at $110k.
Deal economics
- At list price, monthly cash flow is $392 ($5k/yr) — positive.
- The deal already cash-flows at list — no discount required.
- Meets the 1% rule at list price ($1k rent vs $110k).
- Recommended offer: $107k (3.0% below list) — sets the bar for market timing.
- Cap rate 10.6% vs local median 3.8% in San Angelo — top-decile yield for the area; either an underpriced asset or a hidden risk that comps aren't pricing in. Stress-test before assuming the spread holds.
Location & tenants
- Location reads 73/100 on livability (#199 in TX) — a middle-class / working-renter tenant base. Strengths: cost of living A+, housing A+, health & safety A+; Watch: employment C-, amenities F, commute F.
- San Angelo ISD (urban): math 27% / reading 33% proficiency, ranked #627 of 826 in TX (top 76%) — families likely to look elsewhere, expect single-tenant / working-renter base with shorter leases.
- Zoned schools: Lamar El (math 41% / reading 46%, grade F, #1,269 of 4,322 statewide, top 30%, 515 students, 43% FRL); Glenn Middle (math 25% / reading 29%, grade F, #1,177 of 1,662 statewide, top 72%, 1,258 students, 53% FRL); Central H S (math 22% / reading 43%, grade F, #1,029 of 1,632 statewide, top 64%, 3,065 students, 48% FRL) — zoned schools at 48% FRL track the district average.
- Market conditions: Rents rising fast (+8.5%/yr); 227 active listings in the ZIP; 6 comparable units currently listed for rent nearby; rentals lingering (median 44d on market — plan ~5-8 weeks vacancy on turnover, expect pricing pressure); 83% of comp listings sitting > 30 days — soft ceiling on asking rent; 233 units permitted in Tom Green County in 2024 (0 in 5+ unit buildings).
- This rent runs 35% of the median local income ($49k/yr) — at the standard rent-burdened threshold; future hikes will face affordability resistance.
Forward outlook
- Local home prices are declining (-3.0%/yr); year-one equity from $761 of loan paydown is wiped out by about $3k of value loss. Plan a longer hold.
- Tom Green County population projected at +35% by 2050 — long-run rental-demand tailwind backs the buy-and-hold thesis.
- At projected returns (-3.0% appreciation + 8.0% rent growth), your $31k cash investment doubles in ~6 years — after that, you're playing with house money.
Negotiation context
- It's been on market 42 days — a 3% lower offer ($107k) is reasonable based on typical stale-listing flexibility.
- Current owner paid $21k; list at $110k implies a 424% gain — meaningful room to come down on a strong offer.
Risks & watch-outs
- Climate carrying-cost: major wildfire risk; extreme-heat days projected 7→22/yr by 2055 (HVAC capex compounding) — expect insurance premiums to compound above CPI over the hold.
Questions for the listing agent
- It's been on market 42 days. Have you received any prior offers? Is the seller open to a 3% concession, seller financing, or rate buy-down credit?
- Built in 1964 — when were the roof, HVAC, electrical panel, plumbing, and water heater last replaced?
- Is there a deadline driving the sale (1031 exchange, divorce, estate, relocation)? That informs how much negotiation room exists.
- Schools are F-rated, which usually means shorter tenancies and higher turnover. Who's the typical renter profile here, and what's been the actual vacancy rate?
- What's the average days-on-market for RENTAL listings here right now (not sales)? A rising rental-DOM trend means longer vacancies and softer asking-rent achievability than the comps imply.
- What's the recent tenant-quality profile in this submarket — average credit score on applications, eviction rate, late-payment / NSF rate, and stable-employment percentage? A property-management company in the area should have these aggregated.
- How much new for-sale + rental construction is in the pipeline within 1–3 miles? Heavy new supply typically softens prices + rents 12–24 months out; constrained supply supports both.
Investment metrics
- 1% rule
- 1.31% ✓
- Cap rate
- 10.57%
- Cash-on-cash
- 15.29%
- DSCR
- 1.68
- GRM
- 6.4
CMA / ARV
- ARV (median comp)
- $192,333
- List price
- $110,000
- Delta
- -42.81%
- Verdict
- UNDERPRICED
- Comps
- 20 within 1.0 mi
Show comp detail 5 sales within ~0.75 mi
| Address | Dist | Beds/Ba | Sqft | Sold | Price | $/sf | Match |
|---|---|---|---|---|---|---|---|
| 124 Ave U | 0.14mi | 2/1.0 (-1) | 824 (+2%) | 7mo | $35,000 | $42 | 79 |
| 2113 S Hill St | 0.34mi | 2/1.0 (-1) | 816 (+1%) | 2mo | $99,000 | $121 | 75 |
| 2319 Ben Ficklin Rd | 0.27mi | 2/1.0 (-1) | 836 (+4%) | 22mo | $89,500 | $107 | 58 |
| 313 W Ave Ave W | 0.10mi | 2/1.0 (-1) | 912 (+13%) | 17mo | $85,000 | $93 | 54 |
| 917 Texas Ave | 0.44mi | 2/1.0 (-1) | 900 (+12%) | 18mo | $96,000 | $107 | 40 |
Match score weights: distance 35% · size 25% · config 20% · recency 20%. Top-matched comps best support the ARV.
Projected returns pro-forma
-3.0% appreciation · 8.0% rent growth · sell at horizon
- IRR
- 11.4%
- Equity multiple
- 1.48×
- Total profit
- $14,778
- Equity at exit
- $16,401
- IRR
- 24.1%
- Equity multiple
- 3.59×
- Total profit
- $79,666
- Equity at exit
- $9,511
Cash invested: $30,800 (down + closing). Projections, not guarantees.
Landlord ↔ Tenant lean methodology
- Overall (STATE)
- 87 Strongly Landlord-Friendly
- State Texas
- 87 Strongly Landlord-Friendly · R+5
- County
- — inherits STATE
- City
- — inherits STATE
ZIP-level market 76903
- Rents YoY
- 8.5%
- Active inventory
- 227
- Price-to-rent
- 6.4×
Monthly cashflow live
- Estimated rent
- $1,437 high interval (Pro) →
- Mortgage (P&I)
- −$577
- Tax from tax record
- −$120 /mo · $1,441/yr
- Insurance
- −$46
- HOA
- −$0
- Vacancy / Maint / Mgmt
- −$302
- Net cashflow
- $392
Break-even live
UW: 25.0% down · 7.5% · 30yr · 1.5% tax · 5.0% vac · 8.0% maint · 8.0% mgmt
Financing live
Cash to close
- Down payment
- $27,500
- Closing costs
- $3,300
- Reserves months
- —
- Total cash needed
- —
Loan-product check · same deal, 3 products live
Conventional
25% down · 7.5% · 30yr
- Down + closing
- —
- Monthly P&I
- —
- Monthly cashflow
- —
- DSCR
- —
- Eligible?
- —
Personal DTI + credit; lowest rate.
DSCR
20% down · 8.5% · 30yr
- Down + closing
- —
- Monthly P&I
- —
- Monthly cashflow
- —
- DSCR
- —
- Eligible?
- —
No personal income docs; deal must DSCR.
Hard money
10% down · 12.0% · 12mo
- Down + closing
- —
- Monthly P&I
- —
- Monthly cashflow
- —
- DSCR
- —
- Eligible?
- —
Short-term bridge; refi at stabilization.
Rent comps 6 comps
| Address | Beds | Baths | Sqft | Rent | $/sqft | DOM | Units | Dist |
|---|---|---|---|---|---|---|---|---|
| 4225 S Jackson St San Angelo, TX | 2.0–3.0 | 2.0–3.0 | 1000 | $1,819 | $1.82 | 21d | 12 | 1.04mi |
| 1222 S Abe St Unit CK-03 San Angelo, TX | 2.0 | 1.5 | 1007 | $1,425 | $1.42 | 43d | 1 | 1.06mi |
| 1222 S Abe St Unit CK-02 San Angelo, TX | 2.0 | 1.5 | 837 | $1,200 | $1.43 | 43d | 1 | 1.06mi |
| 24 Rhine Loop San Angelo, TX | 2.0 | 2.0 | 1056 | $850 | $0.80 | 43d | 1 | 1.20mi |
| 304 Greer St San Angelo, TX | 2.0 | 1.0 | 1020 | $1,250 | $1.23 | 43d | 1 | 1.36mi |
| 209 West Avenue C Unit A San Angelo, TX | 2.0 | 2.0 | 1100 | $1,400 | $1.27 | 43d | 1 | 1.39mi |
Listing history 17 events
-
2026-06-19days on market $110,000 Active 42 DOM
-
2026-06-18days on market $110,000 Active 41 DOM
-
2026-06-17days on market $110,000 Active 40 DOM
-
2026-06-16days on market $110,000 Active 39 DOM
-
2026-06-15days on market $110,000 Active 38 DOM
-
2026-06-14days on market $110,000 Active 36 DOM
-
2026-06-13days on market $110,000 Active 35 DOM
-
2026-06-10days on market $110,000 Active 33 DOM
-
2026-06-09days on market $110,000 Active 32 DOM
-
2026-06-08days on market $110,000 Active 31 DOM
-
2026-06-07pricedays on market $110,000 Active 30 DOM
-
2026-06-02days on market $125,000 Active 25 DOM
-
2026-06-01days on market $125,000 Active 24 DOM
-
2026-05-31days on market $125,000 Active 23 DOM
-
2026-05-30days on market $125,000 Active 22 DOM
-
2026-05-07$125,000 Active 700-char remark
-
2011-06-15soldstatus $21,000
ⓘ Source: listings_history table (triggers on properties + properties_extension) + one-shot
backfill from property_details.listing_events for pre-trigger history.
Tax reassessment forecast TX · Resets to sale price
- Current annual tax
- $1,441 · $120/mo
- Projected year-2 tax
- $2,013 · $168/mo
- Expected delta
- +$572/yr (+$48/mo · 39.7%)
ⓘ Screening estimate from a state-policy table — verify with the county assessor before closing.
Climate risk First Street
- Flood 4/10 Moderate FEMA zone X (shaded) · 23% chance over 30 yrs
- Wildfire 6/10 Major
- Heat 7/10 Severe 7 d/yr ≥104°F today · 22 d/yr by 30 yrs out
- Wind 4/10 Moderate 17% chance of damaging wind over 30 yrs
- Air quality 1/10 Low 0 unhealthy d/yr today · 0 by 30 yrs out
Nearby sold comps map
Loading sold comps map…
Walkable amenities ~0.75 mi
Loading nearby amenities…
Taxation est. · year 1
- Rental income
- $17,244
- − Mortgage interest
- −$6,162
- − Property taxes
- −$1,441
- − Insurance
- −$550
- − Repairs & maintenance
- −$1,380
- − Management
- −$1,380
- − Depreciation
- −$3,200
- Taxable income
- $3,133
- Est. tax owed @ 24.0%
- −$752
- After-tax cash flow
- $3,958/yr
For passive investors: Depreciation is non-cash, so a rental often shows a tax loss while cash-flowing — sheltering income. Rental losses are passive: they offset passive income freely, and up to $25,000/yr can offset ordinary (W-2) income if you actively participate and your MAGI is under $100k (phasing out to $0 by $150k); unused losses carry forward. On sale, claimed depreciation is recaptured at up to 25%, and gains may owe capital-gains tax (a 1031 exchange can defer both). Figures are a year-1 estimate at your 24.0% rate — not tax advice; consult a CPA.
Schools (NCES district)
- District
- San Angelo ISD
- NCES district ID
- 4838700
- Math proficiency
- 27% ▼ -9.00%
- Reading proficiency
- 33% ▼ -3.00%
- Median HH income
- $43,501
- Composite
- 25.56/100
- National rank
- #7427
- State rank
- #627 of 826 in TX
Livability — San Angelo
- Score
- 73/100
- State rank
- #199
- US rank
- #5030
Category grades
Schools grade is shown separately in the Schools card above.
Census & demographics
- Census place
- San Angelo, TX
- County
- Tom Green County · 113,188 people
- City population
- 81,357
- Metro
- San Angelo, TX
- Population (ZIP)
- 29,947
- Household income
- $49,498
- Rent vs Own
- Severe rent burden
- 1255.0
Population outlook (Tom Green County) Hauer SSP2
- Today (2025)
- 135,110 people
- By 2030
- 144,090 · +6.6%
- By 2040
- 162,561 · +20.3%
- By 2050
- 182,158 · +34.8%
- By 2075
- 232,274 · +71.9%
- By 2100
- 268,218 · +98.5%
Race, ethnicity, and origin ACS 2023
- Neighborhood character
- Diverse neighborhood (Simpson 0.56)
- Race & ethnicity
- Hispanic / Latino 56% White 36% Two or more races 26% Black 5%
- Hispanic origin (detail)
- Mexican 49% Puerto Rican 1%
- Common ancestry
- Italian 1% Serbian 1% Slovak 1%
- Foreign-born
- 10% · Canada
- Languages at home
- 66% English-only · Spanish 33%
Political lean MEDSL · Tom Green
- 2024 margin
- Solid R (+48.0) · D 25.5% · R 73.5% · Other 1.0%
- 2008→2024 swing
- -6.3pp toward R · 2008: -41.7pp · 2024: -48.0pp
- All cycles
- 2024: R+48.0 2020: R+44.4 2016: R+47.9 2012: R+47.9 2008: R+41.7
Not yet ingested
- Civics
- —
Market trends
- HPI YoY
- ▼ -164.90%
- Current HPI
- 217.0406
- Rent YoY
- ▲ 8.46%
- Metro
- San Angelo, TX
- State GDP YoY
- ▲ 3.95%
- F500 in state
- 110
Industry mix (Fortune 500 HQ in TX)
| Industry | F500 HQs | Revenue |
|---|---|---|
| Energy | 16 | $1,198B |
|
||
| Technology | 5 | $198B |
|
||
| Engineering / Construction | 4 | $72B |
|
||
| Energy Services | 3 | $60B |
|
||
| Utilities | 3 | $41B |
|
||
| Healthcare | 2 | $330B |
|
||
Price history
+423.8% since first listed3 events — show timeline
- 2026-06-04 Price Changed $110,000 SAAR TX
- 2026-05-07 Listed $125,000 SAAR TX
- 2011-06-15 Sold (Public Records) $21,000 Public Records
Property tax history
+3.9%/yrLatest (2025): $1,441 · +26.0% YoY. Source: county tax records.
Cash-flow waterfall
monthlySold comps — $/sqft
last 12 mo · ≤1 miLoading sold comps…