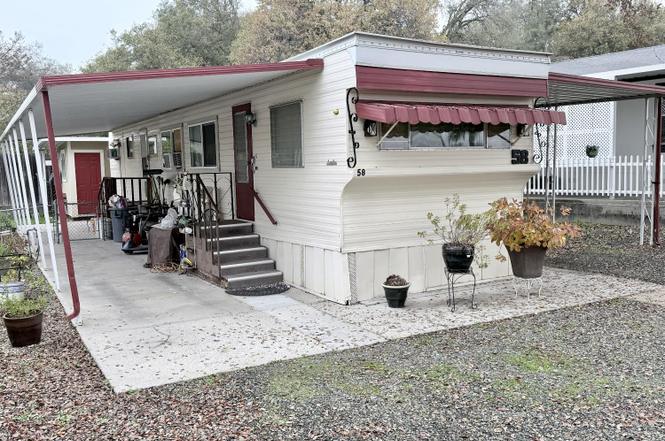
4800 Auburn Folsom Rd #58 · Granite Bay, CA
Flood risk 1/10 · Minimal
- FEMA flood zone
- X (unshaded)
- Chance of flooding over 30 yrs
- 0.0%
- Est. flood insurance / yr
- $507 – $1,088
Fire risk 9/10 · Severe
- Est. fire insurance / yr
- $659 – $1,223
Heat risk 7/10 · Major
- Hot days now (above 102°F)
- 7 days/yr
- Hot days in 30 yrs
- 16 days/yr
Wind risk 1/10 · Minimal
- Chance of severe wind over 30 yrs
- —
Air-quality risk 10/10 · Severe
- Unhealthy air days now
- 30 days/yr
- Unhealthy air days in 30 yrs
- 33 days/yr
Risk factors via First Street. Map © Google.
Why this score? — see what drove the D+ grade
The composite is a weighted blend of 9 inputs, each scored 0–100. Each bar is that input's sub-score; the figure is the points it added to the 100-point composite (weight × sub-score).
- Cash flow +15.0/30.0
- ARV discount +7.5/15.0
- 1% rule +5.0/10.0
- DSCR +5.0/10.0
- Schools +4.9/10.0
- Livability +3.2/5.0
- Rent growth +2.5/5.0
- Condition / age +2.5/5.0
- Appreciation +0.0/10.0
$15,000
🖨 Deal sheet 📄 Offer letter ✓ Due diligence
Listing remarks
This 840 square foot Travel Trailer home at Glenbrook Trails a 55+ community in Loomis, CA offers a cozy retreat with 2 bedrooms and 2 bathrooms. Built in 1959, this home features a spacious master bedroom, fully equipped kitchen, and a separate dining room perfect for entertaining guests. The exterior of the home boasts a shed for storage, a patio for outdoor dining, a fence for added privacy, and beautiful trees on the property. With an open porch and aluminum siding, this home exudes charm and character. Located in the picturesque community of Glenbrook Trails, residents can enjoy the tranquil surroundings and peaceful atmosphere of Loomis, CA. The community offers a variety of amenities
Key facts
- Updated clubhouse
- Newer shed
- Spa
Tags
Property features AI
Finance
- Other: Located near clubhouse and front yard; Community contains 101 spaces; Directions: Enter community from Auburn Folsom Rd onto Sequoia, turn right on Manzanita; the home is on the left at space 58
- HOA & community: No homeowners association; Senior community; Land lease required ($1,300)
Exterior
- Parking: Covered parking; Total of 4 parking spaces; No enclosed garage
- Utilities: Gas plumbed; Natural gas connected; Individual electric meter; Individual gas meter; 220 volts in laundry; Public sewer; Water from district
- Home design: Manufactured in park (single wide); Original condition; Built in 1959; Mobile home make: Angel
- Construction: Metal roof; Metal skirting
- Exterior features: Carport awning; Porch awning; Storage shed(s)
Interior
- Kitchen: Built-in gas oven; Built-in gas range; Hood over range; Microwave; Garbage disposal; Breakfast area
- Bedrooms: 2 bedrooms (possible 3)
- Flooring: Carpet; Linoleum; Parquet
- Bathrooms: 2 full bathrooms; Tub with shower over and separate shower stall(s)
- Heating & cooling: Central heating; Window unit(s) for cooling
- Interior features: Built-in gas oven and built-in gas range; Hood over range; Garbage disposal; Microwave; Gas water heater; Breakfast area and breakfast nook; Porch with steps and carpeting on porch; Window screens; Storage area
- Laundry & utility: Washer and dryer included; Laundry closet/inside laundry area
Neighborhood map
What this means for you Summary
Snapshot
- This is a 2-bed/2.0-bath manufactured listed at $15k.
Deal economics
- At list price, monthly cash flow is $2k ($21k/yr) — positive.
- The deal already cash-flows at list — no discount required.
- Meets the 1% rule at list price ($2k rent vs $15k).
- Recommended offer: $13k (12.0% below list) — sets the bar for market timing.
- Cap rate 147.3% vs local median 1.2% in Granite Bay — top-decile yield for the area; either an underpriced asset or a hidden risk that comps aren't pricing in. Stress-test before assuming the spread holds.
Location & tenants
- Location reads 65/100 on livability (#386 in CA) — a middle-class / working-renter tenant base. Strengths: schools A+, employment A+, housing A+; Watch: amenities F, commute F, cost of living F.
- Placer Union High (suburban): math 39% / reading 72% proficiency, ranked #98 of 517 in CA (top 19%) — acceptable for families but not a draw, mixed tenant base, ~2y average lease.
- Market conditions: 87 active listings in the ZIP; high-income renter base; 3,535 units permitted in Placer County in 2024 (689 in 5+ unit buildings).
Forward outlook
- Local home prices are declining (-3.0%/yr); year-one equity from $104 of loan paydown is wiped out by about $450 of value loss. Plan a longer hold.
- Placer County population projected at +20% by 2050 — long-run rental-demand tailwind backs the buy-and-hold thesis.
- At projected returns (-3.0% appreciation + 3.0% rent growth), your $4k cash investment doubles in ~1 year — after that, you're playing with house money.
Negotiation context
- It's been on market 189 days — a 12% lower offer ($13k) is reasonable based on typical stale-listing flexibility.
Risks & watch-outs
- Watch-outs: built in 1959 — expect roof / HVAC / electrical / plumbing capex.
- Climate carrying-cost: severe wildfire risk; extreme-heat days projected 7→16/yr by 2055 (HVAC capex compounding) — expect insurance premiums to compound above CPI over the hold.
Questions for the listing agent
- It's been on market 189 days. Have you received any prior offers? Is the seller open to a 12% concession, seller financing, or rate buy-down credit?
- Built in 1959 — when were the roof, HVAC, electrical panel, plumbing, and water heater last replaced?
- Why hasn't it sold? Are there any deal-killer items the seller is aware of (foundation, flood, title, zoning, code violations)?
- Is there a deadline driving the sale (1031 exchange, divorce, estate, relocation)? That informs how much negotiation room exists.
- Schools are A-rated — typically a magnet for longer-tenancy family renters. What's the average tenant stay here, and is there a school-zone premium baked into asking?
- The area grade is low — what's the realistic commute time and amenity access for the typical tenant pool here? Any planned neighborhood developments (good or bad) we should know about?
- What's the average days-on-market for RENTAL listings here right now (not sales)? A rising rental-DOM trend means longer vacancies and softer asking-rent achievability than the comps imply.
- What's the recent tenant-quality profile in this submarket — average credit score on applications, eviction rate, late-payment / NSF rate, and stable-employment percentage? A property-management company in the area should have these aggregated.
- How much new for-sale + rental construction is in the pipeline within 1–3 miles? Heavy new supply typically softens prices + rents 12–24 months out; constrained supply supports both.
Investment metrics
- 1% rule
- 15.75% ✓
- Cap rate
- 147.33%
- Cash-on-cash
- 503.71%
- DSCR
- 23.41
- GRM
- 0.5
CMA / ARV
- ARV (on-the-fly)
- $78,960
- Comps found
- 3
Show comp detail 3 sales within ~0.75 mi
| Address | Dist | Beds/Ba | Sqft | Sold | Price | $/sf | Match |
|---|---|---|---|---|---|---|---|
| 4800 Auburn Folsom Rd #38 | 0.06mi | 2/1.0 | 900 (+7%) | 8mo | $35,000 | $39 | 75 |
| 4800 Auburn Folsom Rd #54 | 0.08mi | 2/1.0 | 768 (-9%) | 14mo | $72,400 | $94 | 66 |
| 4800 Auburn Folsom Rd #52 | 0.06mi | 2/1.0 | 720 (-14%) | 18mo | $100,000 | $139 | 54 |
Match score weights: distance 35% · size 25% · config 20% · recency 20%. Top-matched comps best support the ARV.
Projected returns pro-forma
-3.0% appreciation · 3.0% rent growth · sell at horizon
- IRR
- —
- Equity multiple
- 27.16×
- Total profit
- $109,890
- Equity at exit
- $2,237
- IRR
- —
- Equity multiple
- 58.24×
- Total profit
- $240,419
- Equity at exit
- $1,297
Cash invested: $4,200 (down + closing). Projections, not guarantees.
Landlord ↔ Tenant lean methodology
- Overall (STATE)
- 18 Strongly Tenant-Friendly
- State California
- 18 Strongly Tenant-Friendly · D+13
- County
- — inherits STATE
- City
- — inherits STATE
ZIP-level market 95650
- Active inventory
- 87
- Price-to-rent
- 0.5×
Monthly cashflow live
- Estimated rent
- $2,363 medium interval (Pro) →
- Mortgage (P&I)
- −$79
- Tax est. 1.5%
- −$19 /mo · $225/yr
- Insurance
- −$6
- HOA
- −$0
- Vacancy / Maint / Mgmt
- −$496
- Net cashflow
- $1,763
Break-even live
UW: 25.0% down · 7.5% · 30yr · 1.5% tax · 5.0% vac · 8.0% maint · 8.0% mgmt
Financing live
Cash to close
- Down payment
- $3,750
- Closing costs
- $450
- Reserves months
- —
- Total cash needed
- —
Loan-product check · same deal, 3 products live
Conventional
25% down · 7.5% · 30yr
- Down + closing
- —
- Monthly P&I
- —
- Monthly cashflow
- —
- DSCR
- —
- Eligible?
- —
Personal DTI + credit; lowest rate.
DSCR
20% down · 8.5% · 30yr
- Down + closing
- —
- Monthly P&I
- —
- Monthly cashflow
- —
- DSCR
- —
- Eligible?
- —
No personal income docs; deal must DSCR.
Hard money
10% down · 12.0% · 12mo
- Down + closing
- —
- Monthly P&I
- —
- Monthly cashflow
- —
- DSCR
- —
- Eligible?
- —
Short-term bridge; refi at stabilization.
Listing history 12 events
-
2026-06-18days on market $15,000 Active 189 DOM
-
2026-06-17days on market $15,000 Active 188 DOM
-
2026-06-16days on market $15,000 Active 187 DOM
-
2026-06-15days on market $15,000 Active 186 DOM
-
2026-06-13days on market $15,000 Active 184 DOM
-
2026-06-13days on market $15,000 Active 183 DOM
-
2026-06-08days on market $15,000 Active 180 DOM
-
2026-06-07days on market $15,000 Active 179 DOM
-
2026-06-03days on market $15,000 Active 175 DOM
-
2026-06-02pricedays on market $15,000 Active 174 DOM
-
2026-06-01days on market $24,500 Active 173 DOM
-
2026-05-31days on market $24,500 Active 172 DOM
ⓘ Source: listings_history table (triggers on properties + properties_extension) + one-shot
backfill from property_details.listing_events for pre-trigger history.
Climate risk First Street
- Flood 1/10 Low FEMA zone X (unshaded) · 0% chance over 30 yrs
- Wildfire 9/10 Extreme
- Heat 7/10 Severe 7 d/yr ≥102°F today · 16 d/yr by 30 yrs out
- Wind 1/10 Low
- Air quality 10/10 Extreme 30 unhealthy d/yr today · 33 by 30 yrs out
Nearby sold comps map
Loading sold comps map…
Walkable amenities ~0.75 mi
Loading nearby amenities…
Taxation est. · year 1
- Rental income
- $28,354
- − Mortgage interest
- −$840
- − Property taxes
- −$225
- − Insurance
- −$75
- − Repairs & maintenance
- −$2,268
- − Management
- −$2,268
- − Depreciation
- −$436
- Taxable income
- $22,241
- Est. tax owed @ 24.0%
- −$5,338
- After-tax cash flow
- $15,818/yr
For passive investors: Depreciation is non-cash, so a rental often shows a tax loss while cash-flowing — sheltering income. Rental losses are passive: they offset passive income freely, and up to $25,000/yr can offset ordinary (W-2) income if you actively participate and your MAGI is under $100k (phasing out to $0 by $150k); unused losses carry forward. On sale, claimed depreciation is recaptured at up to 25%, and gains may owe capital-gains tax (a 1031 exchange can defer both). Figures are a year-1 estimate at your 24.0% rate — not tax advice; consult a CPA.
Schools (NCES district)
- District
- Placer Union High
- NCES district ID
- 0630750
- Math proficiency
- 39% ▲ 1.00%
- Reading proficiency
- 72% ▲ 3.00%
- Median HH income
- $69,119
- Composite
- 49.04/100
- National rank
- #2060
- State rank
- #98 of 517 in CA
Livability — Granite Bay
- Score
- 65/100
- State rank
- #386
- US rank
- #13127
Category grades
Schools grade is shown separately in the Schools card above.
Census & demographics
- County
- Placer County · 390,510 people
- City population
- 22,985
- Metro
- Sacramento-Roseville-Folsom, CA
- Population (ZIP)
- 13,405
- Household income
- $117,912
- Rent vs Own
- Severe rent burden
- 175.0
Population outlook (Placer County) Hauer SSP2
- Today (2025)
- 422,709 people
- By 2030
- 444,249 · +5.1%
- By 2040
- 480,192 · +13.6%
- By 2050
- 506,390 · +19.8%
- By 2075
- 550,219 · +30.2%
- By 2100
- 547,760 · +29.6%
Race, ethnicity, and origin ACS 2023
- Neighborhood character
- Predominantly White (82%)
- Race & ethnicity
- White 82% Two or more races 10% Hispanic / Latino 8% Asian 3%
- Hispanic origin (detail)
- Mexican 6%
- Common ancestry
- Lithuanian 6% Italian 3% Slovak 3%
- Foreign-born
- 5% · Canada, South Korea
- Languages at home
- 94% English-only · Spanish 3% Russian/Polish/Slavic 2%
Political lean MEDSL · Placer
- 2024 margin
- Lean R (+8.5) · D 44.3% · R 52.8% · Other 2.9%
- 2008→2024 swing
- +2.8pp toward D · 2008: -11.3pp · 2024: -8.5pp
- All cycles
- 2024: R+8.5 2020: R+6.7 2016: R+11.3 2012: R+20.1 2008: R+11.3
Not yet ingested
- Civics
- —
Market trends
- HPI YoY
- ▼ -437.22%
- Current HPI
- 318.2743
- Rent YoY
- —
- Metro
- Sacramento-Roseville-Folsom, CA
- State GDP YoY
- ▲ 3.21%
- F500 in state
- 116
Industry mix (Fortune 500 HQ in CA)
| Industry | F500 HQs | Revenue |
|---|---|---|
| Technology | 27 | $1,492B |
|
||
| Financial Services | 3 | $174B |
|
||
| Retail | 3 | $44B |
|
||
| Insurance | 3 | $26B |
|
||
| Media / Entertainment | 2 | $115B |
|
||
| Pharmaceuticals / Biotech | 2 | $62B |
|
||
Cash-flow waterfall
monthlySold comps — $/sqft
last 12 mo · ≤1 miLoading sold comps…