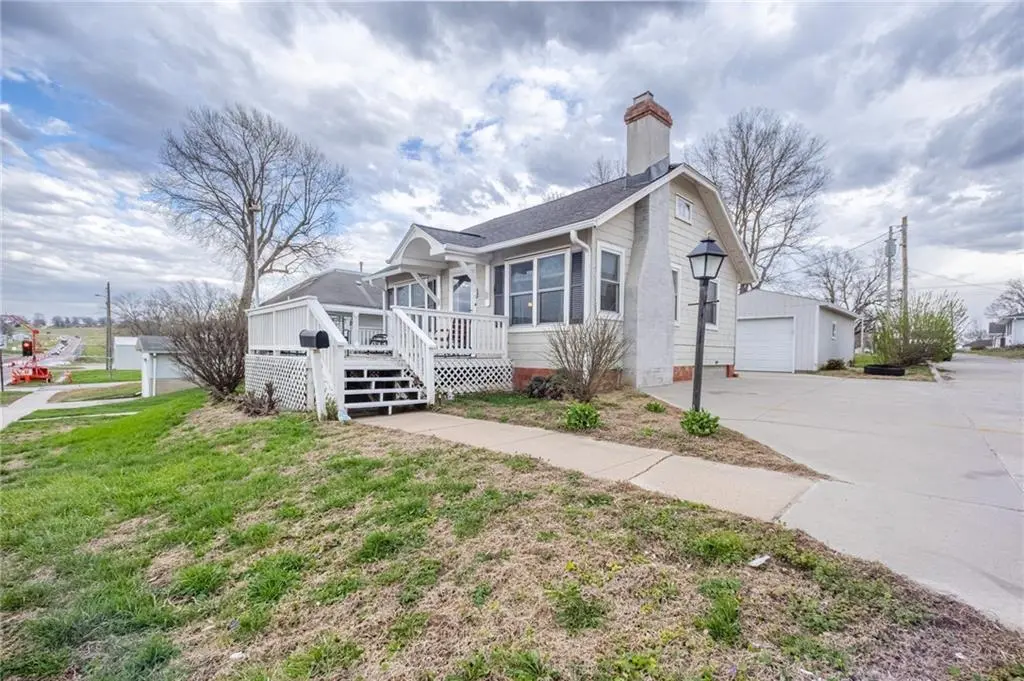
106 US 136 Hwy E · Rock Port, MO
Flood risk 1/10 · Minimal
- FEMA flood zone
- —
- Chance of flooding over 30 yrs
- 0.0%
- Est. flood insurance / yr
- —
Fire risk 1/10 · Minimal
- Est. fire insurance / yr
- $1,054 – $1,958
Heat risk 4/10 · Minor
- Hot days now (above 105°F)
- 7 days/yr
- Hot days in 30 yrs
- 16 days/yr
Wind risk 2/10 · Minimal
- Chance of severe wind over 30 yrs
- —
Air-quality risk 1/10 · Minimal
- Unhealthy air days now
- 0 days/yr
- Unhealthy air days in 30 yrs
- 0 days/yr
Risk factors via First Street. Map © Google.
Why this score? — see what drove the D grade
The composite is a weighted blend of 9 inputs, each scored 0–100. Each bar is that input's sub-score; the figure is the points it added to the 100-point composite (weight × sub-score).
- Cash flow +11.8/30.0
- ARV discount +6.1/15.0
- Appreciation +5.9/10.0
- Schools +5.6/10.0
- Livability +3.6/5.0
- DSCR +3.5/10.0
- Rent growth +2.5/5.0
- Condition / age +2.5/5.0
- 1% rule +2.4/10.0
$109,900
🖨 Deal sheet (PDF) 📄 Offer letter ✓ Due diligence
Listing remarks
Charming and updated 2-bedroom, 1-bath home offering comfort, functionality, and recent improvements throughout! This property features beautiful natural wood floors paired with durable vinyl plank flooring, giving it a warm yet low-maintenance appeal. Major updates include a newer central electric air system (2022), new gutters (2024), and updated windows for improved efficiency. The kitchen comes fully equipped with a refrigerator, stove, and dishwasher—all new in 2024 and included with the home. A recently installed egress window has officially converted this into a true 2-bedroom home, adding both value and additional usable space. Outside, you’ll find a detached garage and
Key facts
- Natural wood floors
- Updated windows
- New gutters
Tags
Property features AI
Finance
- Financial info: $665 annual tax (provided for reference)
- HOA & community: No association fees
Exterior
- Parking: Detached 1-car garage
- Utilities: Public water; Public sewer; Fiber available
- Home design: Single-family residence; Bungalow floor plan; Residential property
- Construction: Composition roof; Construction materials: Other; Age: approximately 76–100 years
- Exterior features: Property located inside city limits; Lot approximately 5,994 square feet
Interior
- Bedrooms: Two bedrooms — one on the first floor and one in the basement
- Flooring: Vinyl flooring
- Bathrooms: One full bathroom (on the first floor)
- Heating & cooling: Natural gas heating; Electric cooling
- Interior features: Formal dining area; Finished basement with inside entrance and egress window(s); Electric fireplace
- Laundry & utility: Laundry room located in the basement
Neighborhood map
What this means for you Summary
Snapshot
- This is a 2-bed/1.0-bath other listed at $110k.
Deal economics
- At list price, monthly cash flow is $-31 ($-373/yr) — negative.
- To cash-flow at today's rent, offer at most $104k (5.0% below list).
- To meet the 1% rule (rent ≥ 1% of price), the offer needs to be $82k (25.5% below list).
- Recommended offer: $82k (25.5% below list) — sets the bar for 1% rule.
Location & tenants
- Location reads 71/100 on livability (#100 in MO) — a middle-class / working-renter tenant base. Strengths: cost of living A+, housing A+, crime A; Watch: amenities F, commute F, health & safety F.
- Rock Port R-II (rural): math 60% / reading 70% proficiency, ranked #23 of 535 in MO (top 4%) — acceptable for families but not a draw, mixed tenant base, ~2y average lease.
- Zoned schools: Rock Port Elem. (math 72% / reading 57%, grade B, #70 of 1,115 statewide, top 8%, 197 students, 33% FRL); Rock Port High (math 42% / reading 62%, grade D+, #92 of 521 statewide, top 20%, 158 students, 27% FRL) — zoned schools at 30% FRL track the district average.
- Market conditions: 8 active listings in the ZIP.
Forward outlook
- In year one you build about $3k of equity ($760 loan paydown + $2k appreciation (1.8% local appreciation)).
- Atchison County population projected at -30% by 2050 — secular population decline; favor cash flow + early exit over multi-decade hold.
- At projected returns (1.8% appreciation + 3.0% rent growth), your $31k cash investment doubles in ~9 years — after that, you're playing with house money.
Negotiation context
- Only 14 days on market — expect competitive offers; lowballing is unlikely to land.
- 3 sale attempts with the ask held roughly flat each time — persistent listings suggest the price (not the market) is what's stuck; bring a comps-based counter.
Risks & watch-outs
- Watch-outs: built in 1920 — expect roof / HVAC / electrical / plumbing capex.
Questions for the listing agent
- What do current leases actually rent for vs. the listed asking? Can we see a recent rent roll and the last 12 months of T-12 income?
- Built in 1920 — when were the roof, HVAC, electrical panel, plumbing, and water heater last replaced?
- Is there a deadline driving the sale (1031 exchange, divorce, estate, relocation)? That informs how much negotiation room exists.
- The area grade is low — what's the realistic commute time and amenity access for the typical tenant pool here? Any planned neighborhood developments (good or bad) we should know about?
- What's the average days-on-market for RENTAL listings here right now (not sales)? A rising rental-DOM trend means longer vacancies and softer asking-rent achievability than the comps imply.
- What's the recent tenant-quality profile in this submarket — average credit score on applications, eviction rate, late-payment / NSF rate, and stable-employment percentage? A property-management company in the area should have these aggregated.
- How much new for-sale + rental construction is in the pipeline within 1–3 miles? Heavy new supply typically softens prices + rents 12–24 months out; constrained supply supports both.
Investment metrics
- 1% rule
- 0.74% ✗
- Cap rate
- 5.95%
- Cash-on-cash
- -1.21%
- DSCR
- 0.95
- GRM
- 11.2
CMA / ARV
- ARV (median comp)
- $106,627
- List price
- $109,900
- Delta
- 3.07%
- Verdict
- FAIR
- Comps
- 10 within 1.0 mi
Projected returns pro-forma
1.79% appreciation · 3.0% rent growth · sell at horizon
- IRR
- 2.6%
- Equity multiple
- 1.14×
- Total profit
- $4,333
- Equity at exit
- $42,085
- IRR
- 6.6%
- Equity multiple
- 1.88×
- Total profit
- $27,174
- Equity at exit
- $59,649
Cash invested: $30,772 (down + closing). Projections, not guarantees.
Landlord ↔ Tenant lean methodology
- Overall (STATE)
- 81 Strongly Landlord-Friendly
- State Missouri
- 81 Strongly Landlord-Friendly · R+10
- County
- — inherits STATE
- City
- — inherits STATE
ZIP-level market 64482
- Home prices YoY
- 1.2%
- Active inventory
- 8
- Price-to-rent
- 11.2×
Monthly cashflow live
- Estimated rent
- $818 medium interval (Pro) →
- Mortgage (P&I)
- −$576
- Tax from tax record
- −$55 /mo · $665/yr
- Insurance
- −$46
- HOA
- −$0
- Vacancy / Maint / Mgmt
- −$172
- Net cashflow
- $-31
Break-even live
Sensitivity live
| Price | -10% $31 | -5% $0 | +0% $-31 | +5% $-62 | +10% $-93 |
|---|---|---|---|---|---|
| Rent | -10% $-96 | -5% $-63 | +0% $-31 | +5% $1 | +10% $34 |
| Rate | -1.0pp $24 | -0.5pp $-3 | base $-31 | +0.5pp $-60 | +1.0pp $-89 |
UW: 25.0% down · 7.5% · 30yr · 1.5% tax · 5.0% vac · 8.0% maint · 8.0% mgmt
Financing live
Cash to close
- Down payment
- $27,475
- Closing costs
- $3,297
- Reserves months
- —
- Total cash needed
- —
Loan-product check · same deal, 3 products live
Conventional
25% down · 7.5% · 30yr
- Down + closing
- —
- Monthly P&I
- —
- Monthly cashflow
- —
- DSCR
- —
- Eligible?
- —
Personal DTI + credit; lowest rate.
DSCR
20% down · 8.5% · 30yr
- Down + closing
- —
- Monthly P&I
- —
- Monthly cashflow
- —
- DSCR
- —
- Eligible?
- —
No personal income docs; deal must DSCR.
Hard money
10% down · 12.0% · 12mo
- Down + closing
- —
- Monthly P&I
- —
- Monthly cashflow
- —
- DSCR
- —
- Eligible?
- —
Short-term bridge; refi at stabilization.
Listing history 15 events
-
2026-06-17status $109,900 Pending 14 DOM
-
2026-06-16days on market $109,900 Active 14 DOM
-
2026-06-15days on market $109,900 Active 13 DOM
-
2026-06-13days on market $109,900 Active 11 DOM
-
2026-06-12days on market $109,900 Active 10 DOM
-
2026-06-09days on market $109,900 Active 7 DOM
-
2026-06-08days on market $109,900 Active 6 DOM
-
2026-06-07days on market $109,900 Active 5 DOM
-
2026-06-05days on market $109,900 Active 3 DOM
-
2026-06-03days on market $109,900 Active 1 DOM
-
2026-05-31days on market $109,900 Active 24 DOM
-
2026-05-15status Active 930-char remark
-
2026-04-18status Pending 930-char remark
-
2026-04-10$109,900 Active 930-char remark
-
2022-07-14soldstatus
ⓘ Source: listings_history table (triggers on properties + properties_extension) + one-shot
backfill from property_details.listing_events for pre-trigger history.
Tax reassessment forecast MO · Resets to sale price
- Current annual tax
- $665 · $55/mo
- Projected year-2 tax
- $1,066 · $89/mo
- Expected delta
- +$401/yr (+$33/mo · 60.2%)
ⓘ Screening estimate from a state-policy table — verify with the county assessor before closing.
Climate risk First Street
- Flood 1/10 Low 0% chance over 30 yrs
- Wildfire 1/10 Low
- Heat 4/10 Moderate 7 d/yr ≥105°F today · 16 d/yr by 30 yrs out
- Wind 2/10 Low
- Air quality 1/10 Low 0 unhealthy d/yr today · 0 by 30 yrs out
Nearby sold comps map
Loading sold comps map…
Walkable amenities ~0.75 mi
Loading nearby amenities…
Taxation est. · year 1
- Rental income
- $9,820
- − Mortgage interest
- −$6,156
- − Property taxes
- −$665
- − Insurance
- −$550
- − Repairs & maintenance
- −$786
- − Management
- −$786
- − Depreciation
- −$3,197
- Taxable loss
- −$2,319
- Est. tax savings @ 24.0%
- +$557
- After-tax cash flow
- $184/yr
For passive investors: Depreciation is non-cash, so a rental often shows a tax loss while cash-flowing — sheltering income. Rental losses are passive: they offset passive income freely, and up to $25,000/yr can offset ordinary (W-2) income if you actively participate and your MAGI is under $100k (phasing out to $0 by $150k); unused losses carry forward. On sale, claimed depreciation is recaptured at up to 25%, and gains may owe capital-gains tax (a 1031 exchange can defer both). Figures are a year-1 estimate at your 24.0% rate — not tax advice; consult a CPA.
Schools (NCES district)
- District
- Rock Port R-II
- NCES district ID
- 2926790
- Math proficiency
- 60% ▼ -5.00%
- Reading proficiency
- 70% ▬ 0.00%
- Median HH income
- $44,082
- Composite
- 56.04/100
- National rank
- #2554
- State rank
- #23 of 535 in MO
Livability — Rock Port
- Score
- 71/100
- State rank
- #100
- US rank
- #6745
Category grades
Schools grade is shown separately in the Schools card above.
Census & demographics
- Census place
- Rock Port, MO
- Population (ZIP)
- 1,971
Population outlook (Atchison County) Hauer SSP2
- Today (2025)
- 4,684 people
- By 2030
- 4,353 · -7.1%
- By 2040
- 3,768 · -19.6%
- By 2050
- 3,299 · -29.6%
- By 2075
- 2,495 · -46.7%
- By 2100
- 1,835 · -60.8%
Race, ethnicity, and origin ACS 2023
- Neighborhood character
- Predominantly White (94%)
- Race & ethnicity
- White 94% Two or more races 3%
- Common ancestry
- Serbian 2% Italian 2% Romanian 2%
- Foreign-born
- 1% · Vietnam
- Languages at home
- 99% English-only · Spanish 1%
Political lean MEDSL · Atchison
- 2024 margin
- Solid R (+59.8) · D 19.5% · R 79.3% · Other 1.2%
- 2008→2024 swing
- -28.4pp toward R · 2008: -31.4pp · 2024: -59.8pp
- All cycles
- 2024: R+59.8 2020: R+58.1 2016: R+55.8 2012: R+42.3 2008: R+31.4
Not yet ingested
- Civics
- —
Market trends
- HPI YoY
- ▲ 1.79%
- Current HPI
- 146.1019
- Rent YoY
- —
- Metro
- —
- State GDP YoY
- ▲ 1.84%
- F500 in state
- 20
Industry mix (Fortune 500 HQ in MO)
| Industry | F500 HQs | Revenue |
|---|---|---|
| Healthcare | 1 | $163B |
|
||
| Insurance | 1 | $21B |
|
||
| Industrial Technology | 1 | $17B |
|
||
| Retail | 1 | $16B |
|
||
| Industrial Distribution | 1 | $10B |
|
||
| Utilities | 1 | $9B |
|
||
Price history
+0.0% since first listed7 events — show timeline
- 2026-06-16 Pending — Heartland MLS as Distributed by MLS Grid
- 2026-06-02 Listed $109,900 Heartland MLS as Distributed by MLS Grid
- 2026-05-31 Listing Removed — Heartland MLS as Distributed by MLS Grid
- 2026-05-15 Relisted — Heartland MLS as Distributed by MLS Grid
- 2026-04-18 Pending — Heartland MLS as Distributed by MLS Grid
- 2026-04-10 Listed $109,900 Heartland MLS as Distributed by MLS Grid
- 2022-07-14 Sold (Public Records) — Public Records
Property tax history
+5.5%/yrLatest (2025): $665 · +14.7% YoY. Source: county tax records.
Cash-flow waterfall
monthlySold comps — $/sqft
last 12 mo · ≤1 miLoading sold comps…