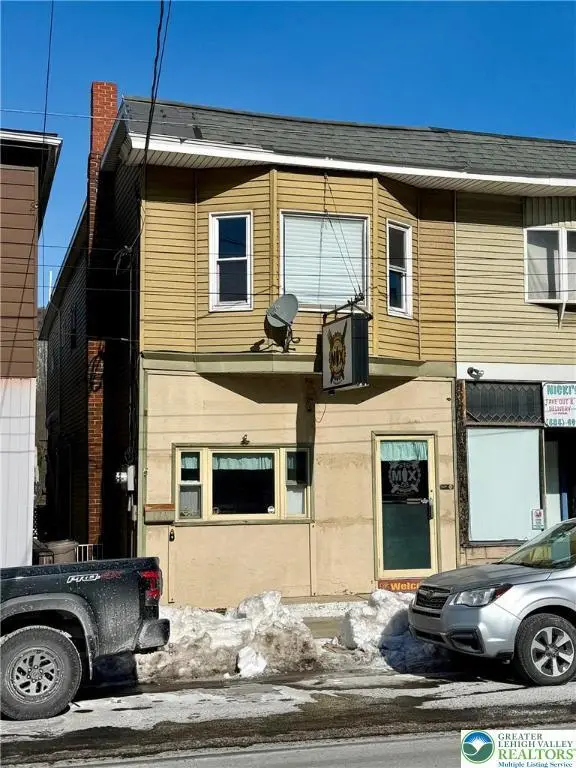
106 E Catawissa St · Nesquehoning, PA
Flood risk 1/10 · Minimal
- FEMA flood zone
- X (unshaded)
- Chance of flooding over 30 yrs
- 0.0%
- Est. flood insurance / yr
- $507 – $1,088
Fire risk 3/10 · Minor
- Est. fire insurance / yr
- $511 – $949
Heat risk 4/10 · Minor
- Hot days now (above 94°F)
- 8 days/yr
- Hot days in 30 yrs
- 17 days/yr
Wind risk 4/10 · Minor
- Chance of severe wind over 30 yrs
- 9.0%
Air-quality risk 2/10 · Minimal
- Unhealthy air days now
- 1 days/yr
- Unhealthy air days in 30 yrs
- 2 days/yr
Risk factors via First Street. Map © Google.
Why this score? — see what drove the D- grade
The composite is a weighted blend of 9 inputs, each scored 0–100. Each bar is that input's sub-score; the figure is the points it added to the 100-point composite (weight × sub-score).
- ARV discount +10.3/15.0
- Cash flow +6.4/30.0
- Appreciation +4.0/10.0
- 1% rule +3.8/10.0
- Livability +3.4/5.0
- Rent growth +2.5/5.0
- Condition / age +2.5/5.0
- Schools +2.0/10.0
- DSCR +0.7/10.0
$149,900
🖨 Deal sheet 📄 Offer letter ✓ Due diligence
Listing remarks MLS
There is more than an opportunity in this incredible 2-unit investment, which was recently the well-known “In The Mix Pub” right in the heart of Nesquehoning. This unique property offers the new owners all kinds of options. The upper-level 2-bedroom apartment is ready for lease, so get started immediately with income potential. Now, you can build on by possibly opening your own diner or storefront business. If that's not your thing, how about selling off all the equipment that comes with the sale to help fund a 2nd residential unit conversion, offering you even more income potential? With a location like this, only minutes away from Jim Thorpe and tons of seasonal outdoor activities and fun, this could be an amazing short-term rental as well. Don’t wait, book your viewing today and start or add to your investment empire.
Key facts
- Built 1916
- Listed 2 days
Neighborhood map
What this means for you Summary
Snapshot
- This is a 2-bed/1.0-bath townhouse listed at $150k.
Deal economics
- At list price, monthly cash flow is $-261 ($-3k/yr) — negative.
- To cash-flow at today's rent, offer at most $108k (27.9% below list).
- To meet the 1% rule (rent ≥ 1% of price), the offer needs to be $131k (12.4% below list).
- Recommended offer: $108k (27.9% below list) — sets the bar for cash-flow.
Location & tenants
- Location reads 68/100 on livability (#872 in PA) — a middle-class / working-renter tenant base. Strengths: crime A+, cost of living A+, housing A+; Watch: employment C-, schools D-, amenities F.
- Panther Valley SD (rural): math 14% / reading 35% proficiency, ranked #477 of 539 in PA (top 88%) — low school quality limits family demand, transient renter base, plan for 1-2y turnover.
- Market conditions: 26 active listings in the ZIP; 6 comparable units currently listed for rent nearby; rentals at typical pace (median 21d on market — plan ~3-4 weeks tenant-placement turnaround); 180 units permitted in Carbon County in 2024 (10 in 5+ unit buildings).
Forward outlook
- Local home prices are declining (-2.1%/yr); year-one equity from $1k of loan paydown is wiped out by about $3k of value loss. Plan a longer hold.
- Carbon County population projected at -18% by 2050 — secular population decline; favor cash flow + early exit over multi-decade hold.
Negotiation context
- Only 2 days on market — expect competitive offers; lowballing is unlikely to land.
- 2 sale attempts since 2y ago; this cycle's ask has dropped $10k (6%) from the opening price — seller is motivated, your offer sets the floor, not the list.
- Current owner paid $109k; 38% above their basis — modest negotiation headroom, anchor on the comps not their cost.
Risks & watch-outs
- Watch-outs: property tax is 3.6% of price; built in 1916 — expect roof / HVAC / electrical / plumbing capex.
Questions for the listing agent
- What do current leases actually rent for vs. the listed asking? Can we see a recent rent roll and the last 12 months of T-12 income?
- Built in 1916 — when were the roof, HVAC, electrical panel, plumbing, and water heater last replaced?
- Property tax is high relative to price — has the assessment been appealed recently, and will the sale trigger a re-assessment?
- Is there a deadline driving the sale (1031 exchange, divorce, estate, relocation)? That informs how much negotiation room exists.
- Schools are D-rated, which usually means shorter tenancies and higher turnover. Who's the typical renter profile here, and what's been the actual vacancy rate?
- The area grade is low — what's the realistic commute time and amenity access for the typical tenant pool here? Any planned neighborhood developments (good or bad) we should know about?
- What's the average days-on-market for RENTAL listings here right now (not sales)? A rising rental-DOM trend means longer vacancies and softer asking-rent achievability than the comps imply.
- What's the recent tenant-quality profile in this submarket — average credit score on applications, eviction rate, late-payment / NSF rate, and stable-employment percentage? A property-management company in the area should have these aggregated.
- How much new for-sale + rental construction is in the pipeline within 1–3 miles? Heavy new supply typically softens prices + rents 12–24 months out; constrained supply supports both.
Investment metrics
- 1% rule
- 0.88% ✗
- Cap rate
- 4.20%
- Cash-on-cash
- -7.48%
- DSCR
- 0.67
- GRM
- 9.5
CMA / ARV
- ARV (median comp)
- $160,027
- List price
- $149,900
- Delta
- -6.33%
- Verdict
- FAIR
- Comps
- 10 within 1.0 mi
Show comp detail 6 sales within ~0.75 mi
| Address | Dist | Beds/Ba | Sqft | Sold | Price | $/sf | Match |
|---|---|---|---|---|---|---|---|
| 142 E Center St | 0.07mi | 3/1.5 (+1) | 1,184 (-2%) | 7mo | $160,000 | $135 | 80 |
| 64 W Catawissa St | 0.23mi | 3/1.0 (+1) | 1,216 (+0%) | 16mo | $88,000 | $72 | 70 |
| 25 E Railroad | 0.15mi | 3/1.0 (+1) | 1,128 (-7%) | 8mo | $125,000 | $111 | 70 |
| 72 Rhume St | 0.31mi | 3/2.0 (+1) | 1,200 (-1%) | 14mo | $136,500 | $114 | 63 |
| 204 W Coal St | 0.39mi | 2/1.0 | 1,176 (-3%) | 20mo | $77,250 | $66 | 60 |
| 194 Coal St | 0.38mi | 3/1.0 (+1) | 1,388 (+14%) | 1mo | $161,900 | $117 | 52 |
Match score weights: distance 35% · size 25% · config 20% · recency 20%. Top-matched comps best support the ARV.
Projected returns pro-forma
-2.08% appreciation · 3.0% rent growth · sell at horizon
- IRR
- -22.0%
- Equity multiple
- 0.17×
- Total profit
- $-34,924
- Equity at exit
- $28,562
- IRR
- -15.7%
- Equity multiple
- -0.09×
- Total profit
- $-45,933
- Equity at exit
- $23,885
Cash invested: $41,972 (down + closing). Projections, not guarantees.
Landlord ↔ Tenant lean methodology
- Overall (STATE)
- 62 Landlord-Friendly
- State Pennsylvania
- 62 Landlord-Friendly · EVEN
- County
- — inherits STATE
- City
- — inherits STATE
ZIP-level market 18240
- Home prices YoY
- -1.1%
- Active inventory
- 26
- Price-to-rent
- 9.5×
Monthly cashflow live
- Estimated rent
- $1,313 high interval (Pro) →
- Mortgage (P&I)
- −$786
- Tax from tax record
- −$450 /mo · $5,401/yr
- Insurance
- −$62
- HOA
- −$0
- Vacancy / Maint / Mgmt
- −$276
- Net cashflow
- $-261
Break-even live
UW: 25.0% down · 7.5% · 30yr · 1.5% tax · 5.0% vac · 8.0% maint · 8.0% mgmt
Financing live
Cash to close
- Down payment
- $37,475
- Closing costs
- $4,497
- Reserves months
- —
- Total cash needed
- —
Loan-product check · same deal, 3 products live
Conventional
25% down · 7.5% · 30yr
- Down + closing
- —
- Monthly P&I
- —
- Monthly cashflow
- —
- DSCR
- —
- Eligible?
- —
Personal DTI + credit; lowest rate.
DSCR
20% down · 8.5% · 30yr
- Down + closing
- —
- Monthly P&I
- —
- Monthly cashflow
- —
- DSCR
- —
- Eligible?
- —
No personal income docs; deal must DSCR.
Hard money
10% down · 12.0% · 12mo
- Down + closing
- —
- Monthly P&I
- —
- Monthly cashflow
- —
- DSCR
- —
- Eligible?
- —
Short-term bridge; refi at stabilization.
Rent comps 6 comps
| Address | Beds | Baths | Sqft | Rent | $/sqft | DOM | Units | Dist |
|---|---|---|---|---|---|---|---|---|
| 2 W Center St Nesquehoning, PA | 3.0 | 1.5 | 1000 | $1,200 | $1.20 | 44d | 1 | 0.11mi |
| 68 W Center St Nesquehoning, PA | 3.0 | 1.0 | 1152 | $1,200 | $1.04 | 21d | 1 | 0.20mi |
| 13 School St Unit 70 Nesquehoning, PA | 2.0 | 1.0 | 950 | $1,300 | $1.37 | 19d | 1 | 0.23mi |
| 69 W Ridge St Nesquehoning, PA | 3.0 | 1.0 | 900 | $975 | $1.08 | 14d | 1 | 0.27mi |
| 243 W High St Nesquehoning, PA | 3.0 | 2.0 | 1107 | $1,100 | $0.99 | 43d | 1 | 0.40mi |
| 59 E Garibaldi Ave Nesquehoning, PA | 3.0 | 2.0 | 1200 | $2,500 | $2.08 | 2d | 1 | 0.42mi |
Listing history 14 events
-
2026-06-18days on market $149,900 Active 2 DOM
-
2026-06-16remarks 699-char remark
-
2026-06-16days on market $149,900 Active 1 DOM
-
2026-06-02days on market $149,900 Active 111 DOM
-
2026-06-01days on market $149,900 Active 110 DOM
-
2026-05-31days on market $149,900 Active 109 DOM
-
2026-05-31days on market $149,900 Active 108 DOM
-
2026-04-29price $149,900 850-char remark
Show marketing remark (850 chars)
There is more than an opportunity in this incredible 2-unit investment, which was recently the well-known “In The Mix Pub” right in the heart of Nesquehoning. This unique property offers the new owners all kinds of options. The upper-level 2-bedroom apartment is ready for lease, so get started immediately with income potential. Now, you can build on by possibly opening your own diner or storefront business. If that's not your thing, how about selling off all the equipment that comes with the sale to help fund a 2nd residential unit conversion, offering you even more income potential? With a location like this, only minutes away from Jim Thorpe and tons of seasonal outdoor activities and fun, this could be an amazing short-term rental as well. Don’t wait, book your viewing today and start or add to your investment empire.
-
2026-04-01price $157,500 850-char remark
Show marketing remark (850 chars)
There is more than an opportunity in this incredible 2-unit investment, which was recently the well-known “In The Mix Pub” right in the heart of Nesquehoning. This unique property offers the new owners all kinds of options. The upper-level 2-bedroom apartment is ready for lease, so get started immediately with income potential. Now, you can build on by possibly opening your own diner or storefront business. If that's not your thing, how about selling off all the equipment that comes with the sale to help fund a 2nd residential unit conversion, offering you even more income potential? With a location like this, only minutes away from Jim Thorpe and tons of seasonal outdoor activities and fun, this could be an amazing short-term rental as well. Don’t wait, book your viewing today and start or add to your investment empire.
-
2026-02-11$159,900 Active 850-char remark
Show marketing remark (850 chars)
There is more than an opportunity in this incredible 2-unit investment, which was recently the well-known “In The Mix Pub” right in the heart of Nesquehoning. This unique property offers the new owners all kinds of options. The upper-level 2-bedroom apartment is ready for lease, so get started immediately with income potential. Now, you can build on by possibly opening your own diner or storefront business. If that's not your thing, how about selling off all the equipment that comes with the sale to help fund a 2nd residential unit conversion, offering you even more income potential? With a location like this, only minutes away from Jim Thorpe and tons of seasonal outdoor activities and fun, this could be an amazing short-term rental as well. Don’t wait, book your viewing today and start or add to your investment empire.
-
2025-05-31historical
-
2024-12-22$160,000 Active
-
2014-01-02soldstatus $108,800
-
2008-05-27soldstatus $200,000
ⓘ Source: listings_history table (triggers on properties + properties_extension) + one-shot
backfill from property_details.listing_events for pre-trigger history.
Tax reassessment forecast PA · Partial reset (capped growth)
- Current annual tax
- $5,401 · $450/mo
- Projected year-2 tax
- $5,401 · $450/mo
- Expected delta
- $0/yr ($0/mo · 0.0%)
ⓘ Screening estimate from a state-policy table — verify with the county assessor before closing.
Climate risk First Street
- Flood 1/10 Low FEMA zone X (unshaded) · 0% chance over 30 yrs
- Wildfire 3/10 Moderate
- Heat 4/10 Moderate 8 d/yr ≥94°F today · 17 d/yr by 30 yrs out
- Wind 4/10 Moderate 9% chance of damaging wind over 30 yrs
- Air quality 2/10 Low 1 unhealthy d/yr today · 2 by 30 yrs out
Nearby sold comps map
Loading sold comps map…
Walkable amenities ~0.75 mi
Loading nearby amenities…
Taxation est. · year 1
- Rental income
- $15,754
- − Mortgage interest
- −$8,397
- − Property taxes
- −$5,401
- − Insurance
- −$750
- − Repairs & maintenance
- −$1,260
- − Management
- −$1,260
- − Depreciation
- −$4,361
- Taxable loss
- −$5,674
- Est. tax savings @ 24.0%
- +$1,362
- After-tax cash flow
- $-1,776/yr
For passive investors: Depreciation is non-cash, so a rental often shows a tax loss while cash-flowing — sheltering income. Rental losses are passive: they offset passive income freely, and up to $25,000/yr can offset ordinary (W-2) income if you actively participate and your MAGI is under $100k (phasing out to $0 by $150k); unused losses carry forward. On sale, claimed depreciation is recaptured at up to 25%, and gains may owe capital-gains tax (a 1031 exchange can defer both). Figures are a year-1 estimate at your 24.0% rate — not tax advice; consult a CPA.
Schools (NCES district)
- District
- Panther Valley SD
- NCES district ID
- 4218450
- Math proficiency
- 14% ▼ -7.00%
- Reading proficiency
- 35% ▼ -14.00%
- Median HH income
- $36,914
- Composite
- 20.31/100
- National rank
- #8613
- State rank
- #477 of 539 in PA
Livability — Nesquehoning
- Score
- 68/100
- State rank
- #872
- US rank
- #9211
Category grades
Schools grade is shown separately in the Schools card above.
Census & demographics
- Census place
- Nesquehoning, PA
- City population
- 3,909
- Population (ZIP)
- 3,909
Population outlook (Carbon County) Hauer SSP2
- Today (2025)
- 61,643 people
- By 2030
- 59,840 · -2.9%
- By 2040
- 55,413 · -10.1%
- By 2050
- 50,843 · -17.5%
- By 2075
- 43,326 · -29.7%
- By 2100
- 37,126 · -39.8%
Race, ethnicity, and origin ACS 2023
- Neighborhood character
- Predominantly White (83%)
- Race & ethnicity
- White 83% Hispanic / Latino 11% Two or more races 7% Black 4%
- Hispanic origin (detail)
- Puerto Rican 11%
- Common ancestry
- Romanian 7% Subsaharan African 4% Polish 3%
- Foreign-born
- 3% · Canada
- Languages at home
- 97% English-only · Spanish 2%
Political lean MEDSL · Carbon
- 2024 margin
- Solid R (+34.8) · D 32.2% · R 67.0%
- 2008→2024 swing
- -36.7pp toward R · 2008: 1.9pp · 2024: -34.8pp
- All cycles
- 2024: R+34.8 2020: R+32.0 2016: R+34.1 2012: R+6.9 2008: D+1.9
Not yet ingested
- Civics
- —
Market trends
- HPI YoY
- ▼ -2.08%
- Current HPI
- 190.5896
- Rent YoY
- —
- Metro
- —
- State GDP YoY
- ▲ 1.68%
- F500 in state
- 34
Industry mix (Fortune 500 HQ in PA)
| Industry | F500 HQs | Revenue |
|---|---|---|
| Healthcare | 2 | $309B |
|
||
| Insurance | 2 | $27B |
|
||
| Telecommunications / Media | 1 | $124B |
|
||
| Industrial Distribution | 1 | $22B |
|
||
| Financial Services | 1 | $20B |
|
||
| Chemicals / Materials | 1 | $18B |
|
||
Price history
-25.1% since first listed7 events — show timeline
- 2026-04-29 Price Changed $149,900 GLVRMLS
- 2026-04-01 Price Changed $157,500 GLVRMLS
- 2026-02-11 Listed $159,900 GLVRMLS
- 2025-05-31 Listing Removed — GLVRMLS
- 2024-12-22 Listed $160,000 GLVRMLS
- 2014-01-02 Sold (Public Records) $108,800 Public Records
- 2008-05-27 Sold (Public Records) $200,000 Public Records
Property tax history
+2.0%/yrLatest (2026): $5,401 · +2.7% YoY. Source: county tax records.
Cash-flow waterfall
monthlySold comps — $/sqft
last 12 mo · ≤1 miLoading sold comps…