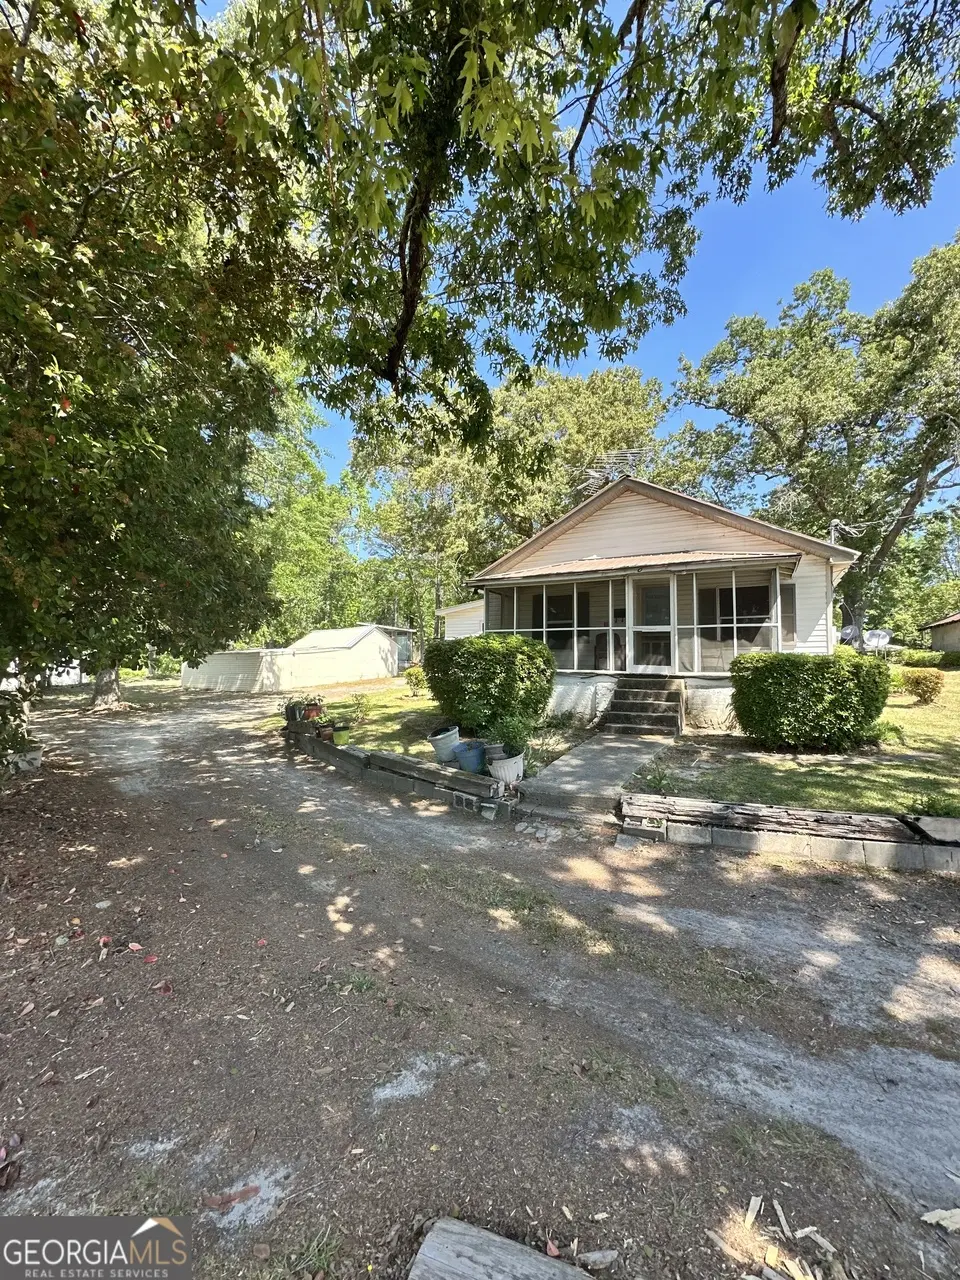
204 Hudson St · Wrens, GA
Flood risk 1/10 · Minimal
- FEMA flood zone
- X (unshaded)
- Chance of flooding over 30 yrs
- 0.0%
- Est. flood insurance / yr
- $507 – $1,088
Fire risk 4/10 · Minor
- Est. fire insurance / yr
- $963 – $1,789
Heat risk 7/10 · Major
- Hot days now (above 107°F)
- 7 days/yr
- Hot days in 30 yrs
- 17 days/yr
Wind risk 6/10 · Moderate
- Chance of severe wind over 30 yrs
- 65.0%
Air-quality risk 2/10 · Minimal
- Unhealthy air days now
- 2 days/yr
- Unhealthy air days in 30 yrs
- 2 days/yr
Risk factors via First Street. Map © Google.
Why this score? — see what drove the C grade
The composite is a weighted blend of 9 inputs, each scored 0–100. Each bar is that input's sub-score; the figure is the points it added to the 100-point composite (weight × sub-score).
- Cash flow +18.9/30.0
- ARV discount +15.0/15.0
- DSCR +6.0/10.0
- Appreciation +5.4/10.0
- 1% rule +3.9/10.0
- Livability +2.9/5.0
- Rent growth +2.5/5.0
- Condition / age +2.5/5.0
- Schools +1.0/10.0
$90,000
🖨 Deal sheet (PDF) 📄 Offer letter ✓ Due diligence
Listing remarks MLS
This 1271 square foot single family home has 3 bedrooms and 2.0 bathrooms.
Key facts
- 0.32 acre lot
- Garage
- Built 1900
Neighborhood map
What this means for you Summary
Snapshot
- This is a 3-bed/1.0-bath single-family listed at $90k.
Deal economics
- At list price, monthly cash flow is $93 ($1k/yr) — positive.
- The deal already cash-flows at list — no discount required.
- To meet the 1% rule (rent ≥ 1% of price), the offer needs to be $80k (11.1% below list).
- Recommended offer: $80k (11.1% below list) — sets the bar for 1% rule.
Location & tenants
- Location reads 58/100 on livability (#434 in GA) — a working-class tenant base; expect higher turnover. Strengths: cost of living A+, housing A+, crime A; Watch: schools F, amenities F, commute F.
- Jefferson County (rural): math 10% / reading 15% proficiency, ranked #166 of 174 in GA (top 95%) — low school quality limits family demand, transient renter base, plan for 1-2y turnover; 78% free/reduced lunch — lower-income household profile, screen leases tightly.
- Market conditions: 28 active listings in the ZIP; 2 comparable units currently listed for rent nearby; 10 units permitted in Jefferson County in 2024 (0 in 5+ unit buildings).
Forward outlook
- In year one you build about $1k of equity ($622 loan paydown + $747 appreciation (0.8% local appreciation)).
- Jefferson County population projected at -31% by 2050 — secular population decline; favor cash flow + early exit over multi-decade hold.
- At projected returns (0.8% appreciation + 3.0% rent growth), your $25k cash investment doubles in ~8 years — after that, you're playing with house money.
Negotiation context
- It's been on market 77 days — a 6% lower offer ($85k) is reasonable based on typical stale-listing flexibility.
Risks & watch-outs
- Watch-outs: built in 1900 — expect roof / HVAC / electrical / plumbing capex.
- Climate carrying-cost: major wind risk, 65% chance of damaging wind over 30y; extreme-heat days projected 7→17/yr by 2055 (HVAC capex compounding) — expect insurance premiums to compound above CPI over the hold.
Questions for the listing agent
- It's been on market 77 days. Have you received any prior offers? Is the seller open to a 11% concession, seller financing, or rate buy-down credit?
- Built in 1900 — when were the roof, HVAC, electrical panel, plumbing, and water heater last replaced?
- Why hasn't it sold? Are there any deal-killer items the seller is aware of (foundation, flood, title, zoning, code violations)?
- Is there a deadline driving the sale (1031 exchange, divorce, estate, relocation)? That informs how much negotiation room exists.
- Schools are F-rated, which usually means shorter tenancies and higher turnover. Who's the typical renter profile here, and what's been the actual vacancy rate?
- What's the average days-on-market for RENTAL listings here right now (not sales)? A rising rental-DOM trend means longer vacancies and softer asking-rent achievability than the comps imply.
- What's the recent tenant-quality profile in this submarket — average credit score on applications, eviction rate, late-payment / NSF rate, and stable-employment percentage? A property-management company in the area should have these aggregated.
- How much new for-sale + rental construction is in the pipeline within 1–3 miles? Heavy new supply typically softens prices + rents 12–24 months out; constrained supply supports both.
Investment metrics
- 1% rule
- 0.89% ✗
- Cap rate
- 7.53%
- Cash-on-cash
- 4.43%
- DSCR
- 1.20
- GRM
- 9.4
CMA / ARV
- ARV (median comp)
- $128,896
- List price
- $90,000
- Delta
- -30.18%
- Verdict
- UNDERPRICED
- Comps
- 12 within 1.0 mi
Show comp detail 6 sales within ~0.75 mi
| Address | Dist | Beds/Ba | Sqft | Sold | Price | $/sf | Match |
|---|---|---|---|---|---|---|---|
| 111 Matthews St | 0.45mi | 3/2.0 | 1,210 (-2%) | 8mo | $201,000 | $166 | 65 |
| 102 Hill St | 0.45mi | 2/2.0 (-1) | 1,260 (+2%) | 10mo | $159,000 | $126 | 58 |
| 109 Matthews St | 0.49mi | 3/2.0 | 1,210 (-2%) | 21mo | $204,900 | $169 | 53 |
| 106 Allie Rd | 0.74mi | 3/2.0 | 1,204 (-2%) | 9mo | $179,995 | $149 | 51 |
| 412 N Thompson St | 0.48mi | 3/1.5 | 1,160 (-6%) | 24mo | $127,000 | $109 | 46 |
| 304 Fleming St | 0.62mi | 3/1.0 | 1,080 (-12%) | 5mo | $63,500 | $59 | 46 |
Match score weights: distance 35% · size 25% · config 20% · recency 20%. Top-matched comps best support the ARV.
Projected returns pro-forma
0.83% appreciation · 3.0% rent growth · sell at horizon
- IRR
- 5.4%
- Equity multiple
- 1.27×
- Total profit
- $6,821
- Equity at exit
- $29,933
- IRR
- 9.8%
- Equity multiple
- 2.17×
- Total profit
- $29,397
- Equity at exit
- $39,173
Cash invested: $25,200 (down + closing). Projections, not guarantees.
Landlord ↔ Tenant lean methodology
- Overall (STATE)
- 90 Strongly Landlord-Friendly
- State Georgia
- 90 Strongly Landlord-Friendly · R+3
- County
- — inherits STATE
- City
- — inherits STATE
ZIP-level market 30833
- Home prices YoY
- 0.5%
- Active inventory
- 28
- Price-to-rent
- 9.4×
Monthly cashflow live
- Estimated rent
- $800 medium interval (Pro) →
- Mortgage (P&I)
- −$472
- Tax from tax record
- −$30 /mo · $355/yr
- Insurance
- −$38
- HOA
- −$0
- Vacancy / Maint / Mgmt
- −$168
- Net cashflow
- $93
Break-even live
Sensitivity live
| Price | -10% $144 | -5% $118 | +0% $93 | +5% $67 | +10% $42 |
|---|---|---|---|---|---|
| Rent | -10% $30 | -5% $61 | +0% $93 | +5% $125 | +10% $156 |
| Rate | -1.0pp $138 | -0.5pp $116 | base $93 | +0.5pp $70 | +1.0pp $46 |
UW: 25.0% down · 7.5% · 30yr · 1.5% tax · 5.0% vac · 8.0% maint · 8.0% mgmt
Financing live
Cash to close
- Down payment
- $22,500
- Closing costs
- $2,700
- Reserves months
- —
- Total cash needed
- —
Loan-product check · same deal, 3 products live
Conventional
25% down · 7.5% · 30yr
- Down + closing
- —
- Monthly P&I
- —
- Monthly cashflow
- —
- DSCR
- —
- Eligible?
- —
Personal DTI + credit; lowest rate.
DSCR
20% down · 8.5% · 30yr
- Down + closing
- —
- Monthly P&I
- —
- Monthly cashflow
- —
- DSCR
- —
- Eligible?
- —
No personal income docs; deal must DSCR.
Hard money
10% down · 12.0% · 12mo
- Down + closing
- —
- Monthly P&I
- —
- Monthly cashflow
- —
- DSCR
- —
- Eligible?
- —
Short-term bridge; refi at stabilization.
Rent comps 2 comps
| Address | Beds | Baths | Sqft | Rent | $/sqft | DOM | Units | Dist |
|---|---|---|---|---|---|---|---|---|
| 703 E Walker St Wrens, GA | 2.0 | 1.0 | 1020 | $800 | $0.78 | 45d | 1 | 0.92mi |
| 703 E Walker St Wrens, GA | 2.0 | 1.0 | 1020 | $800 | $0.78 | 24d | 1 | 0.92mi |
Listing history 17 events
-
2026-06-21days on market $90,000 Active 77 DOM
-
2026-06-18days on market $90,000 Active 75 DOM
-
2026-06-17days on market $90,000 Active 74 DOM
-
2026-06-16days on market $90,000 Active 73 DOM
-
2026-06-15days on market $90,000 Active 72 DOM
-
2026-06-13days on market $90,000 Active 70 DOM
-
2026-06-12days on market $90,000 Active 69 DOM
-
2026-06-09days on market $90,000 Active 66 DOM
-
2026-06-08days on market $90,000 Active 65 DOM
-
2026-06-07days on market $90,000 Active 64 DOM
-
2026-06-07days on market $90,000 Active 63 DOM
-
2026-06-04days on market $90,000 Active 60 DOM
-
2026-06-02days on market $90,000 Active 59 DOM
-
2026-06-01statusdays on market $90,000 Active 58 DOM
-
2026-05-31days on market $90,000 Price Change 57 DOM
-
2026-05-31days on market $90,000 Price Change 56 DOM
-
2026-04-01$100,000 New 74-char remark
Show marketing remark (74 chars)
This 1271 square foot single family home has 3 bedrooms and 2.0 bathrooms.
ⓘ Source: listings_history table (triggers on properties + properties_extension) + one-shot
backfill from property_details.listing_events for pre-trigger history.
Tax reassessment forecast GA · Resets to sale price
- Current annual tax
- $355 · $30/mo
- Projected year-2 tax
- $828 · $69/mo
- Expected delta
- +$473/yr (+$39/mo · 133.4%)
ⓘ Screening estimate from a state-policy table — verify with the county assessor before closing.
Climate risk First Street
- Flood 1/10 Low FEMA zone X (unshaded) · 0% chance over 30 yrs
- Wildfire 4/10 Moderate
- Heat 7/10 Severe 7 d/yr ≥107°F today · 17 d/yr by 30 yrs out
- Wind 6/10 Major 65% chance of damaging wind over 30 yrs
- Air quality 2/10 Low 2 unhealthy d/yr today · 2 by 30 yrs out
Nearby sold comps map
Loading sold comps map…
Walkable amenities ~0.75 mi
Loading nearby amenities…
Taxation est. · year 1
- Rental income
- $9,600
- − Mortgage interest
- −$5,041
- − Property taxes
- −$355
- − Insurance
- −$450
- − Repairs & maintenance
- −$768
- − Management
- −$768
- − Depreciation
- −$2,618
- Taxable loss
- −$400
- Est. tax savings @ 24.0%
- +$96
- After-tax cash flow
- $1,212/yr
For passive investors: Depreciation is non-cash, so a rental often shows a tax loss while cash-flowing — sheltering income. Rental losses are passive: they offset passive income freely, and up to $25,000/yr can offset ordinary (W-2) income if you actively participate and your MAGI is under $100k (phasing out to $0 by $150k); unused losses carry forward. On sale, claimed depreciation is recaptured at up to 25%, and gains may owe capital-gains tax (a 1031 exchange can defer both). Figures are a year-1 estimate at your 24.0% rate — not tax advice; consult a CPA.
Schools (NCES district)
- District
- Jefferson County
- NCES district ID
- 1303060
- Math proficiency
- 10% ▼ -11.00%
- Reading proficiency
- 15% ▼ -8.00%
- Median HH income
- $28,884
- Composite
- 9.66/100
- National rank
- #9837
- State rank
- #166 of 174 in GA
Livability — Wrens
- Score
- 58/100
- State rank
- #434
- US rank
- #21066
Category grades
Schools grade is shown separately in the Schools card above.
Census & demographics
- Census place
- Wrens, GA
- Population (ZIP)
- 4,150
Population outlook (Jefferson County) Hauer SSP2
- Today (2025)
- 14,362 people
- By 2030
- 13,415 · -6.6%
- By 2040
- 11,559 · -19.5%
- By 2050
- 9,949 · -30.7%
- By 2075
- 7,040 · -51.0%
- By 2100
- 5,145 · -64.2%
Race, ethnicity, and origin ACS 2023
- Neighborhood character
- Diverse neighborhood (Simpson 0.57)
- Race & ethnicity
- Black 51% White 41% Hispanic / Latino 3% Two or more races 2% Asian 1%
- Common ancestry
- Estonian 5% Romanian 4% Slovak 2%
- Foreign-born
- 4% · Canada, China
- Languages at home
- 94% English-only · Spanish 3% Other Indo-European 2% Chinese 2%
Political lean MEDSL · Jefferson
- 2024 margin
- Toss-up / Even · D 49.2% · R 50.5%
- 2008→2024 swing
- -16.3pp toward R · 2008: 15.0pp · 2024: -1.2pp
- All cycles
- 2024: R+1.2 2020: D+6.8 2016: D+10.8 2012: D+17.1 2008: D+15.0
Not yet ingested
- Civics
- —
Market trends
- HPI YoY
- ▲ 0.83%
- Current HPI
- 172.6754
- Rent YoY
- —
- Metro
- —
- State GDP YoY
- ▲ 2.66%
- F500 in state
- 28
Industry mix (Fortune 500 HQ in GA)
| Industry | F500 HQs | Revenue |
|---|---|---|
| Paper / Packaging | 2 | $29B |
|
||
| Retail | 1 | $160B |
|
||
| Transportation / Logistics | 1 | $91B |
|
||
| Airlines | 1 | $62B |
|
||
| Consumer Goods | 1 | $47B |
|
||
| Utilities | 1 | $25B |
|
||
Price history
1 event — show timeline
- 2026-04-01 Listed $100,000 GAMLS
Property tax history
+5.5%/yrLatest (2025): $355 · +115.9% YoY. Source: county tax records.
Cash-flow waterfall
monthlySold comps — $/sqft
last 12 mo · ≤1 miLoading sold comps…