 Fourplex
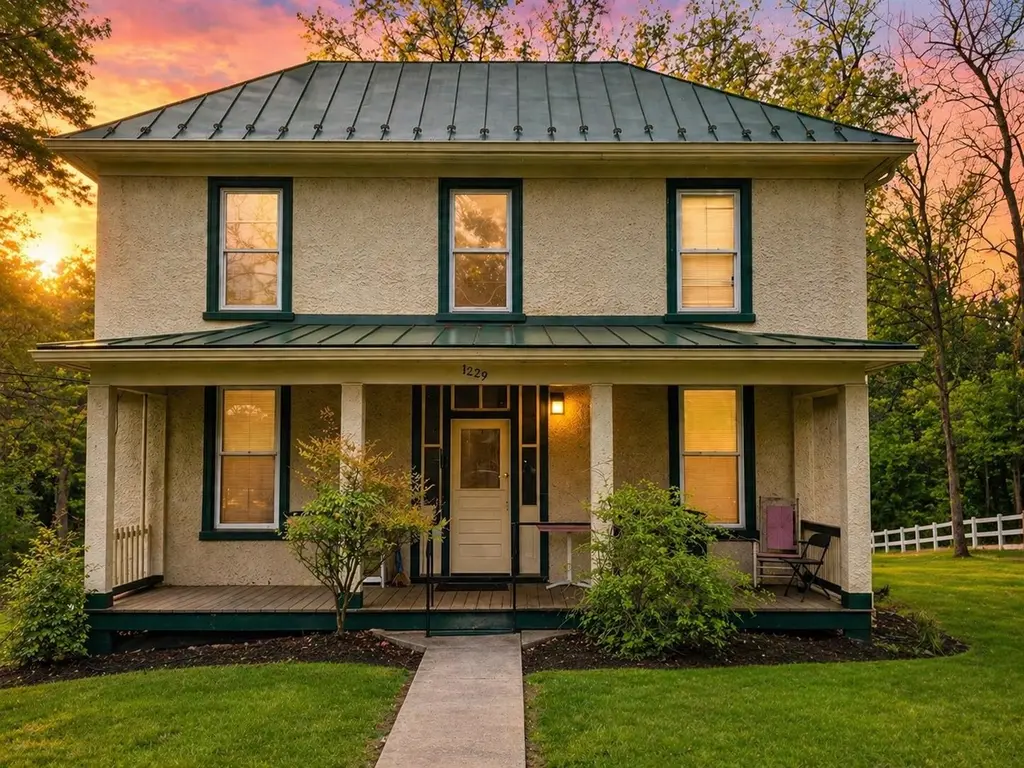
1229 Stack St · Staunton, VA
Flood risk 1/10 · Minimal
- FEMA flood zone
- X (unshaded)
- Chance of flooding over 30 yrs
- 0.0%
- Est. flood insurance / yr
- $473 – $860
Fire risk 4/10 · Minor
- Est. fire insurance / yr
- $666 – $1,236
Heat risk 4/10 · Minor
- Hot days now (above 100°F)
- 7 days/yr
- Hot days in 30 yrs
- 18 days/yr
Wind risk 2/10 · Minimal
- Chance of severe wind over 30 yrs
- 1.0%
Air-quality risk 1/10 · Minimal
- Unhealthy air days now
- 0 days/yr
- Unhealthy air days in 30 yrs
- 0 days/yr
Risk factors via First Street. Map © Google.
Why this score? — see what drove the C+ grade
The composite is a weighted blend of 9 inputs, each scored 0–100. Each bar is that input's sub-score; the figure is the points it added to the 100-point composite (weight × sub-score).
- Cash flow +28.7/30.0
- DSCR +10.0/10.0
- 1% rule +7.1/10.0
- Schools +4.8/10.0
- Livability +4.0/5.0
- Rent growth +3.9/5.0
- Condition / age +2.5/5.0
- ARV discount +0.0/15.0
- Appreciation +0.0/10.0
$399,000
🖨 Deal sheet 📄 Offer letter ✓ Due diligence
Multi-family units
County records classify this as Multi-Family (5+ Unit). Listing-text estimate: 4 units. estimate disagrees with records
5+ unit building — per-unit beds/baths from public records are typically unavailable; the breakdown below (if shown) is an estimate from the listing text.
Listing remarks
Excellent opportunity to own a fully occupied 4-unit apartment building in Staunton. Each unit features 1 bedroom and 1 bathroom. Property is currently generating $2,500 per month ($30,000 annually) with strong upside potential as current rents are below market value. This property offers immediate cash flow with the opportunity to increase returns through rent adjustments and improvements. Conveniently located with strong rental demand in the area. Ideal for investors looking to expand their portfolio with a value-add asset. Newer Metal Roof and Gutters. Vinyl Replacement Windows.
Key facts
- 1,306 sq ft lot
- Built 1914
- Listed 43 days
Property features AI
Finance
- Financial info: Owner pays sewer, water, and taxes; Tenants pay electricity
Exterior
- Utilities: Public water; Public sewer; Cable available
- Home design: Quadruplex (multi-family); Public road frontage
- Construction: Metal roof; Block and slab foundation
- Exterior features: Deck
Interior
- Bedrooms: One 4+ bedroom unit; One 3-bedroom unit; One 2-bedroom unit; One 1-bedroom unit
- Bathrooms: Each unit includes 1 bathroom
- Heating & cooling: Electric baseboard heating
- Interior features: Exterior-entry basement; Has basement
Neighborhood map
What this means for you Summary
Snapshot
- This is a 4 × 1-bed/1-bath units multifamily listed at $399k.
Deal economics
- At list price, monthly cash flow is $1k ($16k/yr) — positive. Per door: $332/mo.
- The deal already cash-flows at list — no discount required.
- Meets the 1% rule at list price ($5k rent vs $399k).
- Recommended offer: $387k (3.0% below list) — sets the bar for market timing.
- Cap rate 10.3% vs local median 2.9% in Staunton — top-decile yield for the area; either an underpriced asset or a hidden risk that comps aren't pricing in. Stress-test before assuming the spread holds.
Location & tenants
- Location reads 81/100 on livability (#56 in VA, #1,524 nationally) — a professional / high-income tenant draw. Strengths: cost of living A+, housing A+, health & safety A+; Watch: commute F.
- Staunton City Public School District (urban): math 48% / reading 67% proficiency, ranked #73 of 131 in VA (top 56%) — acceptable for families but not a draw, mixed tenant base, ~2y average lease.
- Zoned schools: Bessie Weller Elementary (math 42% / reading 57%, grade D, #742 of 1,108 statewide, top 70%, 369 students, 99% FRL); Shelburne Middle (math 43% / reading 66%, grade B-, #194 of 342 statewide, top 60%, 574 students, 99% FRL); Staunton High (math 48% / reading 77%, grade B-, #226 of 319 statewide, top 72%, 822 students, 99% FRL) — zoned schools average 99% FRL vs 47% district-wide (52 pts higher); higher-poverty schools than district average — tighter screening recommended.
- Market conditions: Rents rising fast (+5.8%/yr); 297 active listings in the ZIP; 71 units permitted in Staunton city in 2024 (20 in 5+ unit buildings).
- At $4,820/mo this rent would consume 87% of the median local household income ($66k/yr) (locally 1306% of renters already pay >50% of income on rent) — very limited rent-growth headroom before tenants either downsize or default.
Forward outlook
- Local home prices are declining (-3.0%/yr); year-one equity from $3k of loan paydown is wiped out by about $12k of value loss. Plan a longer hold.
- Staunton County population projected at +9% by 2050 — modest demand growth; plan on rents tracking national, not racing it.
- At projected returns (-3.0% appreciation + 5.8% rent growth), your $112k cash investment doubles in ~7 years — after that, you're playing with house money.
Negotiation context
- It's been on market 44 days — a 3% lower offer ($387k) is reasonable based on typical stale-listing flexibility.
Risks & watch-outs
- Watch-outs: built in 1914 — expect roof / HVAC / electrical / plumbing capex.
Questions for the listing agent
- It's been on market 44 days. Have you received any prior offers? Is the seller open to a 3% concession, seller financing, or rate buy-down credit?
- Can we see the unit-by-unit rent roll, current vacancy, and any below-market leases? What's the average tenancy length?
- What capital expenditures (roof, boiler, parking lot, exteriors) have been made in the last 5 years, and what's planned in the next 2?
- Built in 1914 — when were the roof, HVAC, electrical panel, plumbing, and water heater last replaced?
- Is there a deadline driving the sale (1031 exchange, divorce, estate, relocation)? That informs how much negotiation room exists.
- Schools are A-rated — typically a magnet for longer-tenancy family renters. What's the average tenant stay here, and is there a school-zone premium baked into asking?
- What's the average days-on-market for RENTAL listings here right now (not sales)? A rising rental-DOM trend means longer vacancies and softer asking-rent achievability than the comps imply.
- What's the recent tenant-quality profile in this submarket — average credit score on applications, eviction rate, late-payment / NSF rate, and stable-employment percentage? A property-management company in the area should have these aggregated.
- How much new apartment / multifamily construction is in the pipeline within 1–3 miles? Heavy new supply (>2% of stock underway) typically softens rents 12–24 months out; light construction supports rent growth.
Investment metrics
- 1% rule
- 1.21% ✓
- Cap rate
- 10.28%
- Cash-on-cash
- 14.25%
- DSCR
- 1.63
- GRM
- 6.9
CMA / ARV
- ARV (median comp)
- $294,400
- List price
- $399,000
- Delta
- 35.53%
- Verdict
- OVERPRICED
- Comps
- 20 within 1.0 mi
Projected returns pro-forma
-3.0% appreciation · 5.77% rent growth · sell at horizon
- IRR
- 7.5%
- Equity multiple
- 1.30×
- Total profit
- $33,542
- Equity at exit
- $59,492
- IRR
- 18.9%
- Equity multiple
- 2.77×
- Total profit
- $197,572
- Equity at exit
- $34,498
Cash invested: $111,720 (down + closing). Projections, not guarantees.
Landlord ↔ Tenant lean methodology
- Overall (STATE)
- 55 Moderately Landlord-Leaning
- State Virginia
- 55 Moderately Landlord-Leaning · D+2
- County
- — inherits STATE
- City
- — inherits STATE
ZIP-level market 24401
- Rents YoY
- 5.8%
- Active inventory
- 297
- Price-to-rent
- 27.6×
Monthly cashflow live
- Estimated rent
- $4,820 medium interval (Pro) →
- Mortgage (P&I)
- −$2,092
- Tax from tax record
- −$223 /mo · $2,671/yr
- Insurance
- −$166
- HOA
- −$0
- Vacancy / Maint / Mgmt
- −$1,012
- Net cashflow
- $1,327
Break-even live
4-unit breakdown (identical units grouped — click to expand)
| Units | Beds | Baths | Est. rent |
|---|---|---|---|
| 4× units | 1 | 1 | $4,820 |
| #1 | 1 | 1 | $1,205 |
| #2 | 1 | 1 | $1,205 |
| #3 | 1 | 1 | $1,205 |
| #4 | 1 | 1 | $1,205 |
| Total (4 units) | $4,820 | ||
UW: 25.0% down · 7.5% · 30yr · 1.5% tax · 5.0% vac · 8.0% maint · 8.0% mgmt
Financing live
Cash to close
- Down payment
- $99,750
- Closing costs
- $11,970
- Reserves months
- —
- Total cash needed
- —
Loan-product check · same deal, 3 products live
Conventional
25% down · 7.5% · 30yr
- Down + closing
- —
- Monthly P&I
- —
- Monthly cashflow
- —
- DSCR
- —
- Eligible?
- —
Personal DTI + credit; lowest rate.
DSCR
20% down · 8.5% · 30yr
- Down + closing
- —
- Monthly P&I
- —
- Monthly cashflow
- —
- DSCR
- —
- Eligible?
- —
No personal income docs; deal must DSCR.
Hard money
10% down · 12.0% · 12mo
- Down + closing
- —
- Monthly P&I
- —
- Monthly cashflow
- —
- DSCR
- —
- Eligible?
- —
Short-term bridge; refi at stabilization.
Listing history 17 events
-
2026-06-19days on market $399,000 Active 44 DOM
-
2026-06-18days on market $399,000 Active 43 DOM
-
2026-06-17days on market $399,000 Active 42 DOM
-
2026-06-16days on market $399,000 Active 41 DOM
-
2026-06-15days on market $399,000 Active 40 DOM
-
2026-06-14days on market $399,000 Active 38 DOM
-
2026-06-13days on market $399,000 Active 37 DOM
-
2026-06-10days on market $399,000 Active 35 DOM
-
2026-06-09days on market $399,000 Active 34 DOM
-
2026-06-08days on market $399,000 Active 33 DOM
-
2026-06-07days on market $399,000 Active 32 DOM
-
2026-06-05days on market $399,000 Active 29 DOM
-
2026-06-02days on market $399,000 Active 27 DOM
-
2026-06-01days on market $399,000 Active 26 DOM
-
2026-05-31days on market $399,000 Active 25 DOM
-
2026-05-30days on market $399,000 Active 24 DOM
-
2026-05-06$399,000 Active 588-char remark
ⓘ Source: listings_history table (triggers on properties + properties_extension) + one-shot
backfill from property_details.listing_events for pre-trigger history.
Tax reassessment forecast VA · Resets to sale price
- Current annual tax
- $2,671 · $223/mo
- Projected year-2 tax
- $3,272 · $273/mo
- Expected delta
- +$601/yr (+$50/mo · 22.5%)
ⓘ Screening estimate from a state-policy table — verify with the county assessor before closing.
Climate risk First Street
- Flood 1/10 Low FEMA zone X (unshaded) · 0% chance over 30 yrs
- Wildfire 4/10 Moderate
- Heat 4/10 Moderate 7 d/yr ≥100°F today · 18 d/yr by 30 yrs out
- Wind 2/10 Low 100% chance of damaging wind over 30 yrs
- Air quality 1/10 Low 0 unhealthy d/yr today · 0 by 30 yrs out
Nearby sold comps map
Loading sold comps map…
Walkable amenities ~0.75 mi
Loading nearby amenities…
Taxation est. · year 1
- Rental income
- $57,840
- − Mortgage interest
- −$22,350
- − Property taxes
- −$2,671
- − Insurance
- −$1,995
- − Repairs & maintenance
- −$4,627
- − Management
- −$4,627
- − Depreciation
- −$11,607
- Taxable income
- $9,962
- Est. tax owed @ 24.0%
- −$2,391
- After-tax cash flow
- $13,528/yr
For passive investors: Depreciation is non-cash, so a rental often shows a tax loss while cash-flowing — sheltering income. Rental losses are passive: they offset passive income freely, and up to $25,000/yr can offset ordinary (W-2) income if you actively participate and your MAGI is under $100k (phasing out to $0 by $150k); unused losses carry forward. On sale, claimed depreciation is recaptured at up to 25%, and gains may owe capital-gains tax (a 1031 exchange can defer both). Figures are a year-1 estimate at your 24.0% rate — not tax advice; consult a CPA.
Schools (NCES district)
- District
- Staunton City Public School District
- NCES district ID
- 5103690
- Math proficiency
- 48% ▼ -33.00%
- Reading proficiency
- 67% ▼ -6.00%
- Median HH income
- $42,712
- Composite
- 48.23/100
- National rank
- #2163
- State rank
- #73 of 131 in VA
Livability — Staunton
- Score
- 81/100
- State rank
- #56
- US rank
- #1524
Category grades
Schools grade is shown separately in the Schools card above.
Census & demographics
- Census place
- Staunton, VA
- County
- Staunton City · 38,756 people
- City population
- 38,756
- Metro
- Staunton, VA
- Population (ZIP)
- 38,756
- Household income
- $66,300
- Rent vs Own
- Severe rent burden
- 1306.0
Population outlook (Staunton County) Hauer SSP2
- Today (2025)
- 25,515 people
- By 2030
- 26,060 · +2.1%
- By 2040
- 27,024 · +5.9%
- By 2050
- 27,926 · +9.4%
- By 2075
- 29,334 · +15.0%
- By 2100
- 29,046 · +13.8%
Race, ethnicity, and origin ACS 2023
- Neighborhood character
- Predominantly White (83%)
- Race & ethnicity
- White 83% Black 8% Two or more races 5% Hispanic / Latino 4% Asian 1%
- Common ancestry
- Italian 3% Serbian 3% Slovak 2%
- Foreign-born
- 3% · Canada
- Languages at home
- 95% English-only · Spanish 3% Other Indo-European 1% French/Haitian/Cajun 0%
Political lean MEDSL · Staunton
- 2024 margin
- D (+13.4) · D 56.0% · R 42.6% · Other 1.4%
- 2008→2024 swing
- +11.2pp toward D · 2008: 2.2pp · 2024: 13.4pp
- All cycles
- 2024: D+13.4 2020: D+9.9 2016: D+1.8 2012: D+4.1 2008: D+2.2
Not yet ingested
- Civics
- —
Market trends
- HPI YoY
- ▼ -283.01%
- Current HPI
- 210.049
- Rent YoY
- ▲ 5.77%
- Metro
- Staunton, VA
- State GDP YoY
- ▲ 2.40%
- F500 in state
- 50
Industry mix (Fortune 500 HQ in VA)
| Industry | F500 HQs | Revenue |
|---|---|---|
| Aerospace / Defense | 4 | $236B |
|
||
| Technology / Defense | 3 | $32B |
|
||
| Financial Services | 2 | $176B |
|
||
| Utilities | 2 | $27B |
|
||
| Insurance | 2 | $25B |
|
||
| Technology | 2 | $15B |
|
||
Price history
1 event — show timeline
- 2026-05-06 Listed $399,000 GAAR
Property tax history
+5.9%/yrLatest (2025): $2,671 · +18.0% YoY. Source: county tax records.
Cash-flow waterfall
monthlySold comps — $/sqft
last 12 mo · ≤1 miLoading sold comps…