 🏗️ New Construction
9341 Lavender St · Houston, TX
Flood risk No data
- FEMA flood zone
- —
- Chance of flooding over 30 yrs
- —
- Est. flood insurance / yr
- —
Fire risk No data
- Est. fire insurance / yr
- —
Heat risk No data
- Hot days now (above threshold)
- —
- Hot days in 30 yrs
- —
Wind risk No data
- Chance of severe wind over 30 yrs
- —
Air-quality risk No data
- Unhealthy air days now
- —
- Unhealthy air days in 30 yrs
- —
Risk factors via First Street. Map © Google.
Why this score? — see what drove the C- grade
The composite is a weighted blend of 9 inputs, each scored 0–100. Each bar is that input's sub-score; the figure is the points it added to the 100-point composite (weight × sub-score).
- Cash flow +15.0/30.0
- Appreciation +9.3/10.0
- ARV discount +7.5/15.0
- DSCR +4.6/10.0
- Condition / age +4.0/5.0
- Livability +3.7/5.0
- 1% rule +2.9/10.0
- Schools +2.7/10.0
- Rent growth +2.6/5.0
$265,000
🖨 Deal sheet 📄 Offer letter ✓ Due diligence
Listing remarks
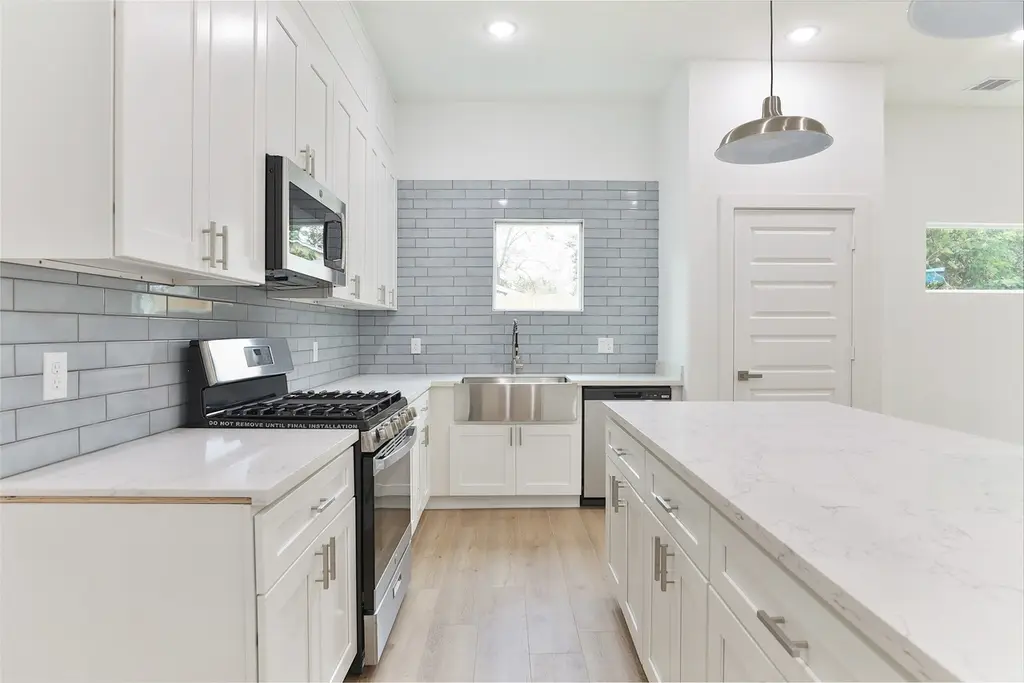
INVESTORS ONLY! TENANT OCCUPIED!! Discover your ideal home with our brand-new property, attractively priced to offer an exceptional blend of comfort and luxury. This residence features three bedrooms and two and a half bathrooms, along with a first-floor family, kitchen space and small backyard. Upon entering, you will be welcomed by an abundance of natural light. These homes showcase premium finishes throughout, including a stunning quartz island, stainless steel appliances, elegant shaker cabinets, and contemporary stainless fixtures in the kitchen. With spacious living areas and a luxurious upstairs en-suite primary suite with balcony, every detail has been thoughtfully curated to enhanc
Key facts
- Quartz island
- Natural light
- Small backyard
Tags
Property features AI
Finance
- Other: Builder: 3 Point Group; Living area approximately 1,600
Exterior
- Parking: Attached 2-car garage with garage door opener
- Security: Smoke detector(s)
- Utilities: Public water; Public sewer
- Home design: Residential property; New construction (2024); Slab foundation; Composition roof
- Construction: Cement siding; Built in 2024
- Exterior features: Fully fenced yard; Private yard; Subdivision lot
Interior
- Kitchen: Dishwasher; Free-standing range; Gas cooktop; Oven; Microwave; Disposal
- Bedrooms: Primary bedroom on second floor (15x13); Bedroom on second floor (12x12); Bedroom on second floor (12x11)
- Flooring: Plank flooring; Vinyl flooring
- Bathrooms: 2 full bathrooms; 1 half bathroom; Primary bathroom on second floor (shared); Second-floor ensuite bathroom; First-floor powder room
- Heating & cooling: Central heating (gas); Central air (electric)
- Interior features: High ceilings; Kitchen island; Kitchen/family room combo; Pantry; Pots & pan drawers; Double vanity; Soaking tub; Separate shower; Tub/shower; Low emissivity windows
- Laundry & utility: Washer hookup; Electric dryer hookup
Neighborhood map
What this means for you Summary
Snapshot
- This is a 4-bed/2.5-bath single-family listed at $265k. Condition is rated good.
Deal economics
- At list price, monthly cash flow is $83 ($997/yr) — positive.
- The deal already cash-flows at list — no discount required.
- To meet the 1% rule (rent ≥ 1% of price), the offer needs to be $211k (20.2% below list).
- Recommended offer: $211k (20.2% below list) — sets the bar for 1% rule.
- Cap rate 6.7% vs local median 3.2% in Houston — top-decile yield for the area; either an underpriced asset or a hidden risk that comps aren't pricing in. Stress-test before assuming the spread holds.
Location & tenants
- Location reads 74/100 on livability (#184 in TX, #4,771 nationally) — a middle-class / working-renter tenant base. Strengths: amenities A+, cost of living A+, housing A+; Watch: crime F.
- Houston ISD (urban): math 27% / reading 35% proficiency, ranked #593 of 826 in TX (top 72%) — families likely to look elsewhere, expect single-tenant / working-renter base with shorter leases; 71% free/reduced lunch — lower-income household profile, screen leases tightly.
- Zoned schools: Shadydale El (math 11% / reading 20%, grade F, #3,990 of 4,322 statewide, top 93%, 631 students, 95% FRL); Forest Brook Middle (math 12% / reading 14%, grade F, #1,609 of 1,662 statewide, top 97%, 613 students, 98% FRL); North Forest H S (math 13% / reading 18%, grade F, #1,505 of 1,632 statewide, top 92%, 974 students, 97% FRL) — zoned schools average 97% FRL vs 71% district-wide (26 pts higher); higher-poverty schools than district average — tighter screening recommended.
- Zoned-school proficiency averages 15% at this address vs 31% district-wide (-16 pts) — the specific schools serving this property underperform the Houston ISD average; the district grade overstates school quality for this exact location.
- Market conditions: Rents flat; 372 active listings in the ZIP; 22 comparable units currently listed for rent nearby; rentals lingering (median 44d on market — plan ~5-8 weeks vacancy on turnover, expect pricing pressure); 55% of comp listings sitting > 30 days — soft ceiling on asking rent; 29,883 units permitted in Harris County in 2024 (8,621 in 5+ unit buildings).
- At $2,115/mo this rent would consume 53% of the median local household income ($48k/yr) (locally 1297% of renters already pay >50% of income on rent) — very limited rent-growth headroom before tenants either downsize or default.
Forward outlook
- In year one you build about $25k of equity ($2k loan paydown + $23k appreciation (8.7% local appreciation)).
- Harris County population projected at +47% by 2050 — long-run rental-demand tailwind backs the buy-and-hold thesis.
- At projected returns (8.7% appreciation + 0.4% rent growth), your $75k cash investment doubles in ~3 years — after that, you're playing with house money.
- By year 2, paydown + projected appreciation supports a ~$40k cash-out refi (75% LTV) — recoverable capital for the next deal without selling this one.
Negotiation context
- It's been on market 31 days — a 3% lower offer ($257k) is reasonable based on typical stale-listing flexibility.
- 3 sale attempts with the ask held roughly flat each time — persistent listings suggest the price (not the market) is what's stuck; bring a comps-based counter.
Questions for the listing agent
- It's been on market 31 days. Have you received any prior offers? Is the seller open to a 20% concession, seller financing, or rate buy-down credit?
- Is there a deadline driving the sale (1031 exchange, divorce, estate, relocation)? That informs how much negotiation room exists.
- Schools are D-rated, which usually means shorter tenancies and higher turnover. Who's the typical renter profile here, and what's been the actual vacancy rate?
- Crime grade is F in this area — have there been break-ins, vandalism, or insurance claims at this property in the last 3 years? What carrier currently insures it and at what premium?
- What's the average days-on-market for RENTAL listings here right now (not sales)? A rising rental-DOM trend means longer vacancies and softer asking-rent achievability than the comps imply.
- What's the recent tenant-quality profile in this submarket — average credit score on applications, eviction rate, late-payment / NSF rate, and stable-employment percentage? A property-management company in the area should have these aggregated.
- How much new for-sale + rental construction is in the pipeline within 1–3 miles? Heavy new supply typically softens prices + rents 12–24 months out; constrained supply supports both.
Investment metrics
- 1% rule
- 0.79% ✗
- Cap rate
- 6.67%
- Cash-on-cash
- 1.33%
- DSCR
- 1.06
- GRM
- 10.5
CMA / ARV
- ARV (on-the-fly)
- $267,530
- Comps found
- 12
Show comp detail 12 sales within ~0.75 mi
| Address | Dist | Beds/Ba | Sqft | Sold | Price | $/sf | Match |
|---|---|---|---|---|---|---|---|
| 4525 Ireland St | 0.09mi | 3/2.5 (-1) | 1,627 (-6%) | 6mo | $269,000 | $165 | 76 |
| 4527 Ireland St | 0.10mi | 3/2.5 (-1) | 1,627 (-6%) | 7mo | $269,000 | $165 | 75 |
| 8722 Clarington St | 0.52mi | 3/2.0 (-1) | 1,600 (-7%) | 7mo | $289,000 | $181 | 50 |
| 4819 Keeland St | 0.66mi | 3/2.5 (-1) | 1,627 (-6%) | 8mo | $252,000 | $155 | 48 |
| 4813 Keeland St | 0.66mi | 3/2.5 (-1) | 1,627 (-6%) | 9mo | $252,000 | $155 | 47 |
| 8714 Clarington St | 0.54mi | 3/2.0 (-1) | 1,600 (-7%) | 11mo | $288,000 | $180 | 47 |
| 4815 Keeland St | 0.66mi | 3/2.5 (-1) | 1,627 (-6%) | 10mo | $252,000 | $155 | 46 |
| 4817 Keeland St | 0.65mi | 3/2.5 (-1) | 1,627 (-6%) | 10mo | $252,000 | $155 | 46 |
| 5709 Senior St | 0.61mi | 4/2.5 | 1,950 (+13%) | 8mo | $115,000 | $59 | 43 |
| 8718 Magna St | 0.61mi | 3/1.5 (-1) | 1,528 (-12%) | 3mo | $200,000 | $131 | 40 |
| 5911 Rietta | 0.66mi | 3/2.0 (-1) | 1,500 (-13%) | 9mo | $269,999 | $180 | 33 |
| 5813 Mayle St | 0.74mi | 3/1.0 (-1) | 1,501 (-13%) | 10mo | $184,999 | $123 | 24 |
Match score weights: distance 35% · size 25% · config 20% · recency 20%. Top-matched comps best support the ARV.
Projected returns pro-forma
8.65% appreciation · 0.44% rent growth · sell at horizon
- IRR
- 21.6%
- Equity multiple
- 2.62×
- Total profit
- $121,263
- Equity at exit
- $215,168
- IRR
- 19.1%
- Equity multiple
- 5.52×
- Total profit
- $338,629
- Equity at exit
- $439,002
Cash invested: $74,908 (down + closing). Projections, not guarantees.
Landlord ↔ Tenant lean methodology
- Overall (STATE)
- 87 Strongly Landlord-Friendly
- State Texas
- 87 Strongly Landlord-Friendly · R+5
- County
- — inherits STATE
- City
- — inherits STATE
ZIP-level market 77016
- Home prices YoY
- 2.8%
- Rents YoY
- 0.4%
- Active inventory
- 372
- Price-to-rent
- 10.4×
Monthly cashflow live
- Estimated rent
- $2,115 high interval (Pro) →
- Mortgage (P&I)
- −$1,403
- Tax from tax record
- −$73 /mo · $877/yr
- Insurance
- −$111
- HOA
- −$0
- Vacancy / Maint / Mgmt
- −$444
- Net cashflow
- $83
Break-even live
UW: 25.0% down · 7.5% · 30yr · 1.5% tax · 5.0% vac · 8.0% maint · 8.0% mgmt
Financing live
Cash to close
- Down payment
- $66,882
- Closing costs
- $8,026
- Reserves months
- —
- Total cash needed
- —
Loan-product check · same deal, 3 products live
Conventional
25% down · 7.5% · 30yr
- Down + closing
- —
- Monthly P&I
- —
- Monthly cashflow
- —
- DSCR
- —
- Eligible?
- —
Personal DTI + credit; lowest rate.
DSCR
20% down · 8.5% · 30yr
- Down + closing
- —
- Monthly P&I
- —
- Monthly cashflow
- —
- DSCR
- —
- Eligible?
- —
No personal income docs; deal must DSCR.
Hard money
10% down · 12.0% · 12mo
- Down + closing
- —
- Monthly P&I
- —
- Monthly cashflow
- —
- DSCR
- —
- Eligible?
- —
Short-term bridge; refi at stabilization.
Rent comps 22 comps
| Address | Beds | Baths | Sqft | Rent | $/sqft | DOM | Units | Dist |
|---|---|---|---|---|---|---|---|---|
| 9422 Sandra St Unit B Houston, TX | 3.0 | 2.5 | 1461 | $1,875 | $1.28 | 43d | 1 | 0.52mi |
| 8639 Peachtree St Unit A Houston, TX | 3.0 | 2.5 | 1150 | $1,750 | $1.52 | 43d | 1 | 0.65mi |
| 4326 Plaag St Unit B Houston, TX | 3.0 | 2.5 | 1150 | $1,595 | $1.39 | 43d | 1 | 1.01mi |
| 7740 Wileyvale Rd Unit B Houston, TX | 3.0 | 2.0 | 1500 | $3,000 | $2.00 | 43d | 1 | 1.17mi |
| 2920 La Estancia Ln Houston, TX | 5.0 | 2.0 | 1562 | $1,761 | $1.13 | 7d | 1 | 1.18mi |
| 3208 Bostic St Unit 1254540P Houston, TX | 3.0 | 2.0 | 1603 | $3,691 | $2.30 | 1d | 1 | 1.19mi |
| 8326 Curry Rd Unit 1228882P Houston, TX | 3.0 | 2.0 | 1614 | $2,878 | $1.78 | 7d | 1 | 1.22mi |
| 8322 Curry Rd Houston, TX | 3.0 | 2.5 | 1599 | $2,500 | $1.56 | 43d | 1 | 1.23mi |
| 8318 Curry Rd Houston, TX | 3.0 | 2.0 | 1558 | $2,299 | $1.48 | 43d | 1 | 1.23mi |
| 10329 Wicklowe St Houston, TX | 3.0 | 2.0 | 1266 | $1,400 | $1.11 | 20d | 1 | 1.23mi |
| 8320 Curry Rd Unit 1391267P Houston, TX | 3.0 | 2.5 | 1550 | $5,134 | $3.31 | 1d | 1 | 1.23mi |
| 8320 Curry Rd Houston, TX | 3.0 | 2.5 | 1558 | $8,950 | $5.74 | 21d | 1 | 1.23mi |
| 9314 Sundown Dr Unit A Houston, TX | 3.0 | 2.5 | 1608 | $1,695 | $1.05 | 14d | 1 | 1.35mi |
| 7119 Bywood St Unit A Houston, TX | 3.0 | 2.5 | 1150 | $1,795 | $1.56 | 43d | 1 | 1.38mi |
| 7201 Hallshire Dr Unit 235 Houston, TX | 3.0 | 1.0 | 1100 | $850 | $0.77 | 43d | 1 | 1.40mi |
| 10221 Bretton Dr Houston, TX | 3.0 | 1.0 | 1350 | $1,700 | $1.26 | 24d | 1 | 1.40mi |
| 9320 Firnat St Unit A Houston, TX | 3.0 | 2.5 | 1900 | $1,850 | $0.97 | 7d | 1 | 1.46mi |
| 9324 Firnat St Unit B Houston, TX | 3.0 | 2.5 | 1600 | $1,900 | $1.19 | 21d | 1 | 1.46mi |
| 9328 Firnat St Unit B Houston, TX | 3.0 | 2.5 | 1902 | $1,900 | $1.00 | 43d | 1 | 1.46mi |
| 9326 Firnat St Unit B Houston, TX | 3.0 | 2.5 | 1902 | $1,900 | $1.00 | 43d | 1 | 1.46mi |
| 9410 Firnat St Unit B Houston, TX | 3.0 | 2.5 | 1500 | $1,900 | $1.27 | 43d | 1 | 1.47mi |
| 5609 Denmark St Unit A Houston, TX | 3.0 | 2.0 | 1410 | $1,595 | $1.13 | 43d | 1 | 1.49mi |
Listing history 19 events
-
2026-06-18days on market $265,000 Active 31 DOM
-
2026-06-17days on market $265,000 Active 30 DOM
-
2026-06-16days on market $265,000 Active 29 DOM
-
2026-06-15days on market $265,000 Active 28 DOM
-
2026-06-13days on market $265,000 Active 26 DOM
-
2026-06-10days on market $265,000 Active 22 DOM
-
2026-06-08days on market $265,000 Active 21 DOM
-
2026-06-07days on market $265,000 Active 20 DOM
-
2026-06-04days on market $265,000 Active 17 DOM
-
2026-06-01days on market $265,000 Active 14 DOM
-
2026-05-31days on market $265,000 Active 13 DOM
-
2026-05-18$265,000 Active
-
2025-11-12historical $2,000
-
2025-10-14historical
-
2025-10-08$2,000
-
2025-09-14price $259,900
-
2025-07-16price $269,900
-
2025-07-09price $274,900
-
2025-06-25$287,000 Active
ⓘ Source: listings_history table (triggers on properties + properties_extension) + one-shot
backfill from property_details.listing_events for pre-trigger history.
Tax reassessment forecast TX · Resets to sale price
- Current annual tax
- $877 · $73/mo
- Projected year-2 tax
- $4,850 · $404/mo
- Expected delta
- +$3,973/yr (+$331/mo · 453.0%)
ⓘ Screening estimate from a state-policy table — verify with the county assessor before closing.
Nearby sold comps map
Loading sold comps map…
Walkable amenities ~0.75 mi
Loading nearby amenities…
Taxation est. · year 1
- Rental income
- $25,376
- − Mortgage interest
- −$14,986
- − Property taxes
- −$877
- − Insurance
- −$1,338
- − Repairs & maintenance
- −$2,030
- − Management
- −$2,030
- − Depreciation
- −$7,783
- Taxable loss
- −$3,667
- Est. tax savings @ 24.0%
- +$880
- After-tax cash flow
- $1,877/yr
For passive investors: Depreciation is non-cash, so a rental often shows a tax loss while cash-flowing — sheltering income. Rental losses are passive: they offset passive income freely, and up to $25,000/yr can offset ordinary (W-2) income if you actively participate and your MAGI is under $100k (phasing out to $0 by $150k); unused losses carry forward. On sale, claimed depreciation is recaptured at up to 25%, and gains may owe capital-gains tax (a 1031 exchange can defer both). Figures are a year-1 estimate at your 24.0% rate — not tax advice; consult a CPA.
Condition & rehab AI · 3 photos
This single-family home is in excellent condition with a modern kitchen and well-maintained exterior. It offers a good investment opportunity with potential for minor cosmetic upgrades to further enhance its value.
Value-add opportunities
- Both Painting the exterior and interior — Fresh paint enhances curb appeal and interior aesthetics.
- Both Landscaping improvements — A well-maintained yard can increase both resale and rental value.
- Both Upgrading light fixtures — Modern light fixtures can improve the home's curb appeal and interior ambiance.
- Both Adding smart home features — Smart home features can increase both resale and rental value by enhancing convenience and energy efficiency.
Renovation cost estimate screening
Value-add ROI direction
- Both Painting the exterior and interior — Fresh paint enhances curb appeal and interior aesthetics. ↑
- Both Landscaping improvements — A well-maintained yard can increase both resale and rental value. ↑
- Both Upgrading light fixtures — Modern light fixtures can improve the home's curb appeal and interior ambiance. ↑
- Both Adding smart home features — Smart home features can increase both resale and rental value by enhancing convenience and energy efficiency. ↑
ⓘ Cost ranges are severity-bucket heuristics (US national rule-of-thumb). Get contractor quotes + a written scope before underwriting a rehab budget.
Schools (NCES district)
- District
- Houston ISD
- NCES district ID
- 4823640
- Math proficiency
- 27% ▼ -18.00%
- Reading proficiency
- 35% ▼ -6.00%
- Median HH income
- $46,054
- Composite
- 26.63/100
- National rank
- #7173
- State rank
- #593 of 826 in TX
Livability — Houston
- Score
- 74/100
- State rank
- #184
- US rank
- #4771
Category grades
Schools grade is shown separately in the Schools card above.
Census & demographics
- Census place
- Houston, TX
- County
- Harris County · 4,702,590 people
- City population
- 3,226,434
- Metro
- Houston-The Woodlands-Sugar Land, TX
- Population (ZIP)
- 29,841
- Household income
- $47,677
- Rent vs Own
- Severe rent burden
- 1297.0
Population outlook (Harris County) Hauer SSP2
- Today (2025)
- 5,571,493 people
- By 2030
- 6,089,821 · +9.3%
- By 2040
- 7,142,806 · +28.2%
- By 2050
- 8,185,864 · +46.9%
- By 2075
- 10,574,329 · +89.8%
- By 2100
- 12,109,958 · +117.4%
Race, ethnicity, and origin ACS 2023
- Neighborhood character
- Majority Black (56%)
- Race & ethnicity
- Black 56% Hispanic / Latino 42% Two or more races 28%
- Hispanic origin (detail)
- Mexican 34%
- Foreign-born
- 18% · Canada
- Languages at home
- 61% English-only · Spanish 37%
Political lean MEDSL · Harris
- 2024 margin
- Lean D (+5.5) · D 52.0% · R 46.4% · Other 1.6%
- 2008→2024 swing
- +3.9pp toward D · 2008: 1.6pp · 2024: 5.5pp
- All cycles
- 2024: D+5.5 2020: D+13.3 2016: D+12.4 2012: D+0.1 2008: D+1.6
Not yet ingested
- Civics
- —
Market trends
- HPI YoY
- ▲ 8.65%
- Current HPI
- 315.6765
- Rent YoY
- ▲ 0.44%
- Metro
- Houston-The Woodlands-Sugar Land, TX
- State GDP YoY
- ▲ 3.95%
- F500 in state
- 110
Industry mix (Fortune 500 HQ in TX)
| Industry | F500 HQs | Revenue |
|---|---|---|
| Energy | 16 | $1,198B |
|
||
| Technology | 5 | $198B |
|
||
| Engineering / Construction | 4 | $72B |
|
||
| Energy Services | 3 | $60B |
|
||
| Utilities | 3 | $41B |
|
||
| Healthcare | 2 | $330B |
|
||
Price history
-7.7% since first listed8 events — show timeline
- 2026-05-18 Listed $265,000 HARMLS
- 2025-11-12 Rental Removed $2,000 HARMLS
- 2025-10-14 Listing Removed — HARMLS
- 2025-10-08 Listed for Rent $2,000 HARMLS
- 2025-09-14 Price Changed $259,900 HARMLS
- 2025-07-16 Price Changed $269,900 HARMLS
- 2025-07-09 Price Changed $274,900 HARMLS
- 2025-06-25 Listed $287,000 HARMLS
Property tax history
+48.6%/yrLatest (2025): $877 · +48.6% YoY. Source: county tax records.
Cash-flow waterfall
monthlySold comps — $/sqft
last 12 mo · ≤1 miLoading sold comps…