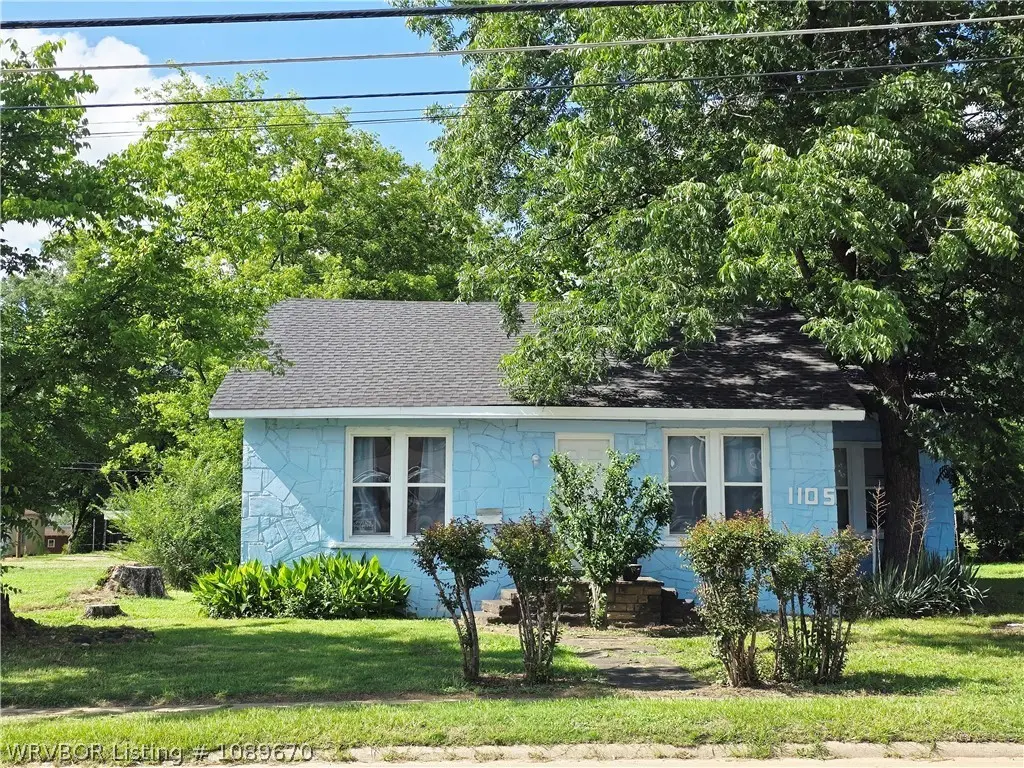
1105 E Walnut St · Paris, AR
Flood risk 1/10 · Minimal
- FEMA flood zone
- X (unshaded)
- Chance of flooding over 30 yrs
- 0.0%
- Est. flood insurance / yr
- $507 – $1,088
Fire risk 5/10 · Moderate
- Est. fire insurance / yr
- $1,499 – $2,785
Heat risk 7/10 · Major
- Hot days now (above 111°F)
- 7 days/yr
- Hot days in 30 yrs
- 21 days/yr
Wind risk 2/10 · Minimal
- Chance of severe wind over 30 yrs
- 2.0%
Air-quality risk 1/10 · Minimal
- Unhealthy air days now
- 0 days/yr
- Unhealthy air days in 30 yrs
- 0 days/yr
Risk factors via First Street. Map © Google.
Why this score? — see what drove the B- grade
The composite is a weighted blend of 9 inputs, each scored 0–100. Each bar is that input's sub-score; the figure is the points it added to the 100-point composite (weight × sub-score).
- Cash flow +25.9/30.0
- ARV discount +15.0/15.0
- DSCR +8.7/10.0
- 1% rule +5.9/10.0
- Livability +3.5/5.0
- Schools +3.2/10.0
- Rent growth +2.5/5.0
- Condition / age +2.5/5.0
- Appreciation +0.0/10.0
$95,000
🖨 Deal sheet 📄 Offer letter ✓ Due diligence
Listing remarks MLS
REO PROPERTY-BANK OWNED. PROPERTY SOLD “AS IS”. The Listing Broker & Seller assume no responsibility & make no guarantees, warranties or representations as to accuracy of the property information or photographs. Buyer to turn on Utilities for INSPECTIONS.
Key facts
- Excellent visibility
- Accessibility
- Bonus room
Tags
Property features AI
Exterior
- Parking: Concrete parking
- Security: Smoke detectors
- Utilities: Public water; Public sewer; Electricity available; Sewer available; Water available
- Home design: Single-family residence; House; One story; South-facing
- Construction: Stone construction; Asphalt shingle roof
- Exterior features: Patio; Partial fencing; Cleared, landscaped, level lot; Paved public road access
Interior
- Kitchen: Range; Refrigerator; Electric water heater
- Flooring: Carpet; Ceramic tile; Vinyl; Wood
- Bathrooms: 1 full bathroom
- Heating & cooling: Central heating; Central air; Ceiling fan cooling
- Interior features: Built-in features; Ceiling fans; Storage; Blinds
- Laundry & utility: Washer hookup; Electric dryer hookup
Neighborhood map
What this means for you Summary
Snapshot
- This is a 2-bed/1.0-bath single-family listed at $95k.
Deal economics
- At list price, monthly cash flow is $235 ($3k/yr) — positive.
- The deal already cash-flows at list — no discount required.
- Meets the 1% rule at list price ($1k rent vs $95k).
- Cap rate 9.3% vs local median 5.6% in Paris — top-decile yield for the area; either an underpriced asset or a hidden risk that comps aren't pricing in. Stress-test before assuming the spread holds.
Location & tenants
- Location reads 69/100 on livability (#68 in AR) — a middle-class / working-renter tenant base. Strengths: cost of living A+, housing A+, health & safety A+; Watch: crime F, amenities F, commute F.
- Paris School District (town): math 41% / reading 37% proficiency, ranked #83 of 238 in AR (top 35%) — families likely to look elsewhere, expect single-tenant / working-renter base with shorter leases.
- Zoned schools: Paris Elementary School (math 57% / reading 27%, grade F, #173 of 454 statewide, top 43%, 431 students, 100% FRL); Paris Middle School (math 39% / reading 43%, grade F, #83 of 201 statewide, top 44%, 317 students, 100% FRL); Paris High School (math 32% / reading 37%, grade F, #92 of 292 statewide, top 37%, 335 students, 100% FRL) — zoned schools average 100% FRL vs 54% district-wide (46 pts higher); higher-poverty schools than district average — tighter screening recommended.
- Market conditions: 78 active listings in the ZIP; 11 units permitted in Logan County in 2024 (0 in 5+ unit buildings).
Forward outlook
- Local home prices are declining (-3.0%/yr); year-one equity from $657 of loan paydown is wiped out by about $3k of value loss. Plan a longer hold.
- Logan County population projected at -13% by 2050 — secular population decline; favor cash flow + early exit over multi-decade hold.
Negotiation context
- Only 8 days on market — expect competitive offers; lowballing is unlikely to land.
- 2 sale attempts since 14y ago with the ask held roughly flat each time — persistent listings suggest the price (not the market) is what's stuck; bring a comps-based counter.
- Current owner paid $12k; list at $95k implies a 716% gain — meaningful room to come down on a strong offer.
Risks & watch-outs
- Climate carrying-cost: moderate wildfire risk; extreme-heat days projected 7→21/yr by 2055 (HVAC capex compounding) — expect insurance premiums to compound above CPI over the hold.
Questions for the listing agent
- Is there a deadline driving the sale (1031 exchange, divorce, estate, relocation)? That informs how much negotiation room exists.
- Schools are D-rated, which usually means shorter tenancies and higher turnover. Who's the typical renter profile here, and what's been the actual vacancy rate?
- Crime grade is F in this area — have there been break-ins, vandalism, or insurance claims at this property in the last 3 years? What carrier currently insures it and at what premium?
- What's the average days-on-market for RENTAL listings here right now (not sales)? A rising rental-DOM trend means longer vacancies and softer asking-rent achievability than the comps imply.
- What's the recent tenant-quality profile in this submarket — average credit score on applications, eviction rate, late-payment / NSF rate, and stable-employment percentage? A property-management company in the area should have these aggregated.
- How much new for-sale + rental construction is in the pipeline within 1–3 miles? Heavy new supply typically softens prices + rents 12–24 months out; constrained supply supports both.
Investment metrics
- 1% rule
- 1.09% ✓
- Cap rate
- 9.26%
- Cash-on-cash
- 10.58%
- DSCR
- 1.47
- GRM
- 7.6
CMA / ARV
- ARV (on-the-fly)
- $134,232
- Comps found
- 12
Show comp detail 12 sales within ~0.75 mi
| Address | Dist | Beds/Ba | Sqft | Sold | Price | $/sf | Match |
|---|---|---|---|---|---|---|---|
| 1104 Main St | 0.02mi | 2/2.0 | 1,260 (-4%) | 15mo | $20,000 | $16 | 75 |
| 801 Main St | 0.14mi | 3/1.0 (+1) | 1,392 (+6%) | 12mo | $144,000 | $103 | 69 |
| 1104 Fuller St | 0.21mi | 3/2.0 (+1) | 1,372 (+4%) | 11mo | $140,000 | $102 | 65 |
| 817 E Chism St | 0.26mi | 2/1.0 | 1,232 (-6%) | 15mo | $57,400 | $47 | 65 |
| 1116 Academy St | 0.13mi | 3/2.0 (+1) | 1,274 (-3%) | 18mo | $30,000 | $24 | 64 |
| 702 5th St | 0.47mi | 3/1.0 (+1) | 1,440 (+9%) | 1mo | $57,000 | $40 | 57 |
| 618 Academy St | 0.25mi | 3/2.0 (+1) | 1,240 (-6%) | 20mo | $105,000 | $85 | 53 |
| 1112 E Wood St | 0.40mi | 3/2.0 (+1) | 1,209 (-8%) | 9mo | $152,700 | $126 | 51 |
| 1133 Old Airport Rd | 0.73mi | 3/1.0 (+1) | 1,368 (+4%) | 11mo | $159,900 | $117 | 45 |
| 804 Wahl St | 0.55mi | 3/2.0 (+1) | 1,250 (-5%) | 15mo | $157,000 | $126 | 44 |
| 1205 Crescent Dr | 0.64mi | 3/1.5 (+1) | 1,161 (-12%) | 6mo | $30,000 | $26 | 39 |
| 1782 Main St | 0.35mi | 3/2.0 (+1) | 1,478 (+12%) | 21mo | $199,500 | $135 | 37 |
Match score weights: distance 35% · size 25% · config 20% · recency 20%. Top-matched comps best support the ARV.
Projected returns pro-forma
-3.0% appreciation · 3.0% rent growth · sell at horizon
- IRR
- -0.5%
- Equity multiple
- 0.98×
- Total profit
- $-486
- Equity at exit
- $14,165
- IRR
- 9.2%
- Equity multiple
- 1.70×
- Total profit
- $18,695
- Equity at exit
- $8,214
Cash invested: $26,600 (down + closing). Projections, not guarantees.
Landlord ↔ Tenant lean methodology
- Overall (STATE)
- 92 Strongly Landlord-Friendly
- State Arkansas
- 92 Strongly Landlord-Friendly · R+14
- County
- — inherits STATE
- City
- — inherits STATE
ZIP-level market 72855
- Home prices YoY
- -8.3%
- Active inventory
- 78
- Price-to-rent
- 7.6×
Monthly cashflow live
- Estimated rent
- $1,038 medium interval (Pro) →
- Mortgage (P&I)
- −$498
- Tax from tax record
- −$48 /mo · $574/yr
- Insurance
- −$40
- HOA
- −$0
- Vacancy / Maint / Mgmt
- −$218
- Net cashflow
- $235
Break-even live
UW: 25.0% down · 7.5% · 30yr · 1.5% tax · 5.0% vac · 8.0% maint · 8.0% mgmt
Financing live
Cash to close
- Down payment
- $23,750
- Closing costs
- $2,850
- Reserves months
- —
- Total cash needed
- —
Loan-product check · same deal, 3 products live
Conventional
25% down · 7.5% · 30yr
- Down + closing
- —
- Monthly P&I
- —
- Monthly cashflow
- —
- DSCR
- —
- Eligible?
- —
Personal DTI + credit; lowest rate.
DSCR
20% down · 8.5% · 30yr
- Down + closing
- —
- Monthly P&I
- —
- Monthly cashflow
- —
- DSCR
- —
- Eligible?
- —
No personal income docs; deal must DSCR.
Hard money
10% down · 12.0% · 12mo
- Down + closing
- —
- Monthly P&I
- —
- Monthly cashflow
- —
- DSCR
- —
- Eligible?
- —
Short-term bridge; refi at stabilization.
Listing history 8 events
-
2026-06-19days on market $95,000 Active 8 DOM
-
2026-06-18days on market $95,000 Active 7 DOM
-
2026-06-17days on market $95,000 Active 6 DOM
-
2026-06-16days on market $95,000 Active 5 DOM
-
2026-06-15days on market $95,000 Active 4 DOM
-
2026-06-14days on market $95,000 Active 2 DOM
-
2026-06-12remarks 695-char remark
-
2026-06-12$95,000 Active 1 DOM
ⓘ Source: listings_history table (triggers on properties + properties_extension) + one-shot
backfill from property_details.listing_events for pre-trigger history.
Tax reassessment forecast AR · Resets to sale price
- Current annual tax
- $574 · $48/mo
- Projected year-2 tax
- $608 · $51/mo
- Expected delta
- +$34/yr (+$3/mo · 5.8%)
ⓘ Screening estimate from a state-policy table — verify with the county assessor before closing.
Climate risk First Street
- Flood 1/10 Low FEMA zone X (unshaded) · 0% chance over 30 yrs
- Wildfire 5/10 Major
- Heat 7/10 Severe 7 d/yr ≥111°F today · 21 d/yr by 30 yrs out
- Wind 2/10 Low 2% chance of damaging wind over 30 yrs
- Air quality 1/10 Low 0 unhealthy d/yr today · 0 by 30 yrs out
Nearby sold comps map
Loading sold comps map…
Walkable amenities ~0.75 mi
Loading nearby amenities…
Taxation est. · year 1
- Rental income
- $12,458
- − Mortgage interest
- −$5,321
- − Property taxes
- −$574
- − Insurance
- −$475
- − Repairs & maintenance
- −$997
- − Management
- −$997
- − Depreciation
- −$2,764
- Taxable income
- $1,330
- Est. tax owed @ 24.0%
- −$319
- After-tax cash flow
- $2,495/yr
For passive investors: Depreciation is non-cash, so a rental often shows a tax loss while cash-flowing — sheltering income. Rental losses are passive: they offset passive income freely, and up to $25,000/yr can offset ordinary (W-2) income if you actively participate and your MAGI is under $100k (phasing out to $0 by $150k); unused losses carry forward. On sale, claimed depreciation is recaptured at up to 25%, and gains may owe capital-gains tax (a 1031 exchange can defer both). Figures are a year-1 estimate at your 24.0% rate — not tax advice; consult a CPA.
Schools (NCES district)
- District
- Paris School District
- NCES district ID
- 0511130
- Math proficiency
- 41% ▼ -9.00%
- Reading proficiency
- 37% ▼ -6.00%
- Median HH income
- $34,950
- Composite
- 32.25/100
- National rank
- #5763
- State rank
- #83 of 238 in AR
Livability — Paris
- Score
- 69/100
- State rank
- #68
- US rank
- #8544
Category grades
Schools grade is shown separately in the Schools card above.
Census & demographics
- Census place
- Paris, AR
- Population (ZIP)
- 6,462
Population outlook (Logan County) Hauer SSP2
- Today (2025)
- 21,046 people
- By 2030
- 20,537 · -2.4%
- By 2040
- 19,443 · -7.6%
- By 2050
- 18,220 · -13.4%
- By 2075
- 16,164 · -23.2%
- By 2100
- 14,858 · -29.4%
Race, ethnicity, and origin ACS 2023
- Neighborhood character
- Predominantly White (87%)
- Race & ethnicity
- White 87% Two or more races 8% Asian 3% Hispanic / Latino 2%
- Common ancestry
- Italian 1% Serbian 1% Lithuanian 1%
- Foreign-born
- 2% · China, Vietnam
- Languages at home
- 95% English-only · Spanish 3% Other Asian/Pacific 1% Chinese 1%
Political lean MEDSL · Logan
- 2024 margin
- Solid R (+62.2) · D 17.8% · R 80.0% · Other 2.1%
- 2008→2024 swing
- -23.5pp toward R · 2008: -38.8pp · 2024: -62.2pp
- All cycles
- 2024: R+62.2 2020: R+59.5 2016: R+51.4 2012: R+41.9 2008: R+38.8
Not yet ingested
- Civics
- —
Market trends
- HPI YoY
- ▼ -15.40%
- Current HPI
- 170.513
- Rent YoY
- —
- Metro
- —
- State GDP YoY
- ▲ 3.80%
- F500 in state
- 10
Industry mix (Fortune 500 HQ in AR)
| Industry | F500 HQs | Revenue |
|---|---|---|
| Retail | 1 | $681B |
|
||
| Food / Agriculture | 1 | $53B |
|
||
| Retail / Energy | 1 | $22B |
|
||
| Transportation / Logistics | 1 | $12B |
|
||
| Energy | 1 | $4B |
|
||
Price history
+578.6% since first listed8 events — show timeline
- 2026-06-10 Listed $95,000 WRVBOR
- 2013-03-20 Sold (MLS) $11,649 CARMLS
- 2013-03-19 Sold (Public Records) $12,000 Public Records
- 2012-12-31 Listed $10,000 CARMLS
- 2006-04-03 Sold (Public Records) $37,000 Public Records
- 2002-09-23 Sold (Public Records) $36,500 Public Records
- 1996-02-16 Sold (Public Records) $13,000 Public Records
- 1980-10-24 Sold (Public Records) $14,000 Public Records
Property tax history
+6.2%/yrLatest (2025): $574 · +9.9% YoY. Source: county tax records.
Cash-flow waterfall
monthlySold comps — $/sqft
last 12 mo · ≤1 miLoading sold comps…