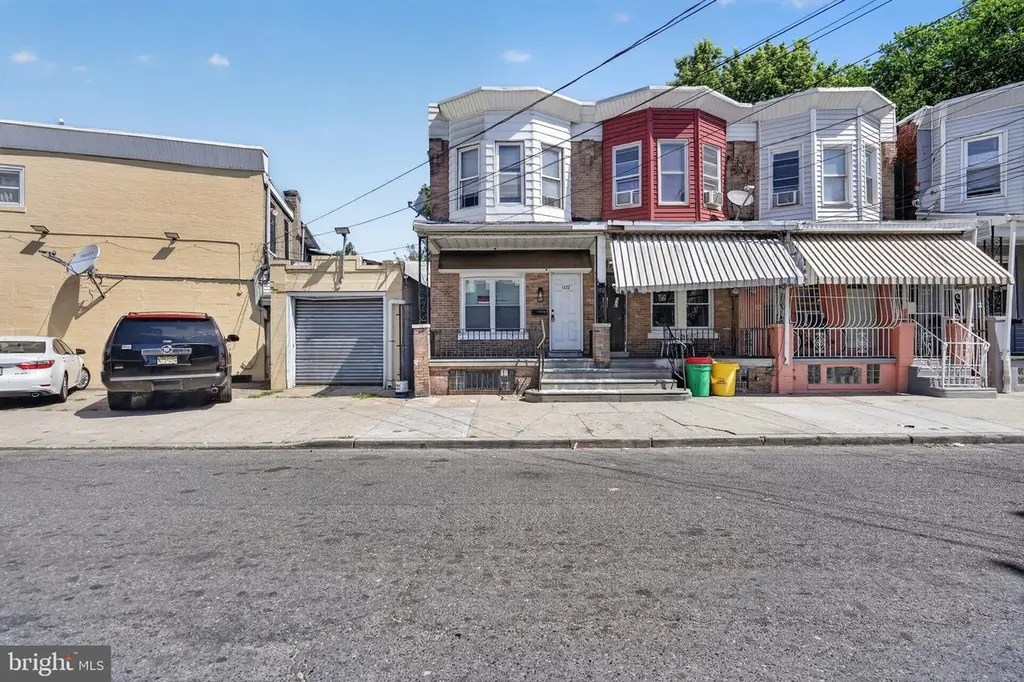
1177 Sheridan St · Camden, NJ
Flood risk 1/10 · Minimal
- FEMA flood zone
- X (unshaded)
- Chance of flooding over 30 yrs
- 0.0%
- Est. flood insurance / yr
- $507 – $1,088
Fire risk 1/10 · Minimal
- Est. fire insurance / yr
- $526 – $976
Heat risk 7/10 · Major
- Hot days now (above 103°F)
- 7 days/yr
- Hot days in 30 yrs
- 15 days/yr
Wind risk 6/10 · Moderate
- Chance of severe wind over 30 yrs
- 40.0%
Air-quality risk 4/10 · Minor
- Unhealthy air days now
- 5 days/yr
- Unhealthy air days in 30 yrs
- 6 days/yr
Risk factors via First Street. Map © Google.
Why this score? — see what drove the C grade
The composite is a weighted blend of 9 inputs, each scored 0–100. Each bar is that input's sub-score; the figure is the points it added to the 100-point composite (weight × sub-score).
- Cash flow +29.6/30.0
- DSCR +10.0/10.0
- 1% rule +7.5/10.0
- Livability +3.5/5.0
- Rent growth +2.5/5.0
- Condition / age +2.5/5.0
- Schools +0.7/10.0
- ARV discount +0.0/15.0
- Appreciation +0.0/10.0
$139,900
🖨 Deal sheet 📄 Offer letter ✓ Due diligence
Listing remarks
HOT ON THE MARKET in Camden, NJ is a rare opportunity that appeals to both homeowners and investors. This well maintained 3 bedroom 1 bathroom is priced to sell, and offers many possibilities. A homeowner can purchase turnkey and customize over time, or an investor can obtain a cash-flowing asset for their portfolio by adding a tenant quickly. This home is being sold vacant and in as-is condition. Please don't miss out on this unique opportunity!
Key facts
- Built 1908
- Listed 6 days
Property features AI
Exterior
- Parking: On-street parking
- Utilities: Natural gas service available; Electric service available
- Home design: End of row/townhouse; Flat roof
- Construction: Block and concrete construction; Concrete perimeter foundation; Built year per assessor
- Exterior features: Public water; Public sewer
Interior
- Bedrooms: 3 bedrooms on main level
- Bathrooms: 1 full bathroom (main level)
- Heating & cooling: Forced air heating; Electric cooling; Natural gas hot water
- Interior features: Unfinished basement; Multiple access exits (2+)
Neighborhood map
What this means for you Summary
Snapshot
- This is a 3-bed/1.0-bath townhouse listed at $140k.
Deal economics
- At list price, monthly cash flow is $505 ($6k/yr) — positive.
- The deal already cash-flows at list — no discount required.
- Meets the 1% rule at list price ($2k rent vs $140k).
- Cap rate 10.6% vs local median 7.1% in Camden — top-decile yield for the area; either an underpriced asset or a hidden risk that comps aren't pricing in. Stress-test before assuming the spread holds.
Location & tenants
- Location reads 70/100 on livability (#262 in NJ) — a middle-class / working-renter tenant base. Strengths: amenities A+, commute A+, cost of living A; Watch: schools F, crime F, employment F.
- Camden City School District (urban): math 3% / reading 16% proficiency, ranked #472 of 472 in NJ (top 100%) — low school quality limits family demand, transient renter base, plan for 1-2y turnover; 86% free/reduced lunch — lower-income household profile, screen leases tightly.
- Market conditions: 95 active listings in the ZIP; 30 comparable units currently listed for rent nearby; rentals at typical pace (median 22d on market — plan ~3-4 weeks tenant-placement turnaround); 1,018 units permitted in Camden County in 2024 (509 in 5+ unit buildings).
Forward outlook
- Local home prices are declining (-3.0%/yr); year-one equity from $967 of loan paydown is wiped out by about $4k of value loss. Plan a longer hold.
- Camden County population projected to shrink 8% by 2050 — rents likely to lag national; underwrite the cash flow, not the appreciation.
- At projected returns (-3.0% appreciation + 3.0% rent growth), your $39k cash investment doubles in ~8 years — after that, you're playing with house money.
Negotiation context
- Only 7 days on market — expect competitive offers; lowballing is unlikely to land.
- 2 sale attempts since 3y ago; this cycle's ask has dropped $10k (7%) from the opening price — seller is motivated, your offer sets the floor, not the list.
Risks & watch-outs
- Watch-outs: built in 1908 — expect roof / HVAC / electrical / plumbing capex.
- Climate carrying-cost: major wind risk, 40% chance of damaging wind over 30y; extreme-heat days projected 7→15/yr by 2055 (HVAC capex compounding) — expect insurance premiums to compound above CPI over the hold.
Questions for the listing agent
- Built in 1908 — when were the roof, HVAC, electrical panel, plumbing, and water heater last replaced?
- Is there a deadline driving the sale (1031 exchange, divorce, estate, relocation)? That informs how much negotiation room exists.
- Schools are F-rated, which usually means shorter tenancies and higher turnover. Who's the typical renter profile here, and what's been the actual vacancy rate?
- Crime grade is F in this area — have there been break-ins, vandalism, or insurance claims at this property in the last 3 years? What carrier currently insures it and at what premium?
- What's the average days-on-market for RENTAL listings here right now (not sales)? A rising rental-DOM trend means longer vacancies and softer asking-rent achievability than the comps imply.
- What's the recent tenant-quality profile in this submarket — average credit score on applications, eviction rate, late-payment / NSF rate, and stable-employment percentage? A property-management company in the area should have these aggregated.
- How much new for-sale + rental construction is in the pipeline within 1–3 miles? Heavy new supply typically softens prices + rents 12–24 months out; constrained supply supports both.
Investment metrics
- 1% rule
- 1.25% ✓
- Cap rate
- 10.62%
- Cash-on-cash
- 15.47%
- DSCR
- 1.69
- GRM
- 6.7
CMA / ARV
- ARV (on-the-fly)
- $98,648
- Comps found
- 12
Show comp detail 12 sales within ~0.75 mi
| Address | Dist | Beds/Ba | Sqft | Sold | Price | $/sf | Match |
|---|---|---|---|---|---|---|---|
| 1623 Pulaski St | 0.11mi | 2/1.0 (-1) | 1,117 (-0%) | 2mo | $145,000 | $130 | 88 |
| 1250 Sayrs | 0.27mi | 3/1.0 | 1,142 (+2%) | 0mo | $100,000 | $88 | 84 |
| 1235 Thurman St | 0.21mi | 3/1.0 | 1,084 (-3%) | 1mo | $108,333 | $100 | 84 |
| 1211 Thurman St | 0.20mi | 3/1.0 | 1,173 (+5%) | 1mo | $86,458 | $74 | 82 |
| 1246 Everett St | 0.24mi | 3/1.0 | 1,081 (-4%) | 1mo | $108,333 | $100 | 82 |
| 1248 Everett St | 0.24mi | 3/1.0 | 1,081 (-4%) | 1mo | $108,333 | $100 | 82 |
| 1154 Thurman St | 0.18mi | 3/1.0 | 1,255 (+12%) | 1mo | $108,333 | $86 | 71 |
| 1085 Morton St | 0.18mi | 3/1.0 | 1,280 (+14%) | 1mo | $83,000 | $65 | 67 |
| 1154 Lansdowne Ave | 0.32mi | 3/1.0 | 995 (-11%) | 1mo | $86,458 | $87 | 66 |
| 837 Sylvan St | 0.74mi | 3/1.0 | 1,120 (-0%) | 1mo | $86,458 | $77 | 64 |
| 1586 Greenwood Ave | 0.70mi | 3/1.5 | 1,184 (+6%) | 1mo | $250,000 | $211 | 55 |
| 1831 S 6th St | 0.75mi | 3/1.0 | 1,213 (+8%) | 1mo | $75,000 | $62 | 51 |
Match score weights: distance 35% · size 25% · config 20% · recency 20%. Top-matched comps best support the ARV.
Projected returns pro-forma
-3.0% appreciation · 3.0% rent growth · sell at horizon
- IRR
- 6.2%
- Equity multiple
- 1.24×
- Total profit
- $9,463
- Equity at exit
- $20,860
- IRR
- 15.6%
- Equity multiple
- 2.26×
- Total profit
- $49,537
- Equity at exit
- $12,096
Cash invested: $39,172 (down + closing). Projections, not guarantees.
Landlord ↔ Tenant lean methodology
- Overall (STATE)
- 21 Tenant-Leaning
- State New Jersey
- 21 Tenant-Leaning · D+6
- County
- — inherits STATE
- City
- — inherits STATE
ZIP-level market 08104
- Active inventory
- 95
- Price-to-rent
- 6.7×
Monthly cashflow live
- Estimated rent
- $1,750 high interval (Pro) →
- Mortgage (P&I)
- −$734
- Tax from tax record
- −$85 /mo · $1,025/yr
- Insurance
- −$58
- HOA
- −$0
- Vacancy / Maint / Mgmt
- −$367
- Net cashflow
- $505
Break-even live
UW: 25.0% down · 7.5% · 30yr · 1.5% tax · 5.0% vac · 8.0% maint · 8.0% mgmt
Financing live
Cash to close
- Down payment
- $34,975
- Closing costs
- $4,197
- Reserves months
- —
- Total cash needed
- —
Loan-product check · same deal, 3 products live
Conventional
25% down · 7.5% · 30yr
- Down + closing
- —
- Monthly P&I
- —
- Monthly cashflow
- —
- DSCR
- —
- Eligible?
- —
Personal DTI + credit; lowest rate.
DSCR
20% down · 8.5% · 30yr
- Down + closing
- —
- Monthly P&I
- —
- Monthly cashflow
- —
- DSCR
- —
- Eligible?
- —
No personal income docs; deal must DSCR.
Hard money
10% down · 12.0% · 12mo
- Down + closing
- —
- Monthly P&I
- —
- Monthly cashflow
- —
- DSCR
- —
- Eligible?
- —
Short-term bridge; refi at stabilization.
Rent comps 30 comps
| Address | Beds | Baths | Sqft | Rent | $/sqft | DOM | Units | Dist |
|---|---|---|---|---|---|---|---|---|
| 1502 S 9th St Camden, NJ | 2.0 | 1.0 | 1050 | $1,475 | $1.40 | 19d | 1 | 0.38mi |
| 209 Cedar Ave Oaklyn, NJ | 2.0 | 1.0 | 1400 | $1,500 | $1.07 | 16d | 1 | 0.59mi |
| 209 Cedar Ave Oaklyn, NJ | 2.0 | 1.0 | 1400 | $1,800 | $1.29 | 5d | 1 | 0.59mi |
| 1364 Kaighn Ave Camden, NJ | 2.0 | 1.0 | 912 | $1,485 | $1.63 | 2d | 1 | 0.60mi |
| 141 Cooper Ave Oaklyn, NJ | 2.0 | 1.0 | 850 | $1,725 | $2.03 | 24d | 1 | 0.62mi |
| 145 Cooper Ave Unit 1N Woodlynne, NJ | 2.0 | 1.0 | 850 | $1,725 | $2.03 | 18d | 1 | 0.63mi |
| 1455 Wildwood Ave Camden, NJ | 3.0 | 1.5 | 1353 | $1,900 | $1.40 | 10d | 1 | 0.75mi |
| 1055 Kenwood Ave Camden, NJ | 4.0 | 1.0 | 1088 | $1,875 | $1.72 | 24d | 1 | 0.77mi |
| 1509 Park Blvd Camden, NJ | 1.0–2.0 | 1.0 | 1075 | $1,650 | $1.53 | 24d | 1 | 0.88mi |
| 1759 S 4th St Unit B Camden, NJ | 2.0 | 1.0 | 800 | $1,500 | $1.88 | 24d | 1 | 0.89mi |
| 457 Mechanic St Camden, NJ | 3.0 | 2.0 | 1200 | $1,950 | $1.62 | 18d | 1 | 0.89mi |
| 301 Champion Ave Oaklyn, NJ | 2.0 | 1.0 | 661 | $1,770 | $2.68 | 4d | 3 | 1.04mi |
| 708 Royden St Camden, NJ | 3.0 | 1.0 | 1113 | $1,595 | $1.43 | 17d | 1 | 1.09mi |
| 537 Newton Ave Camden, NJ | 2.0 | 1.0 | 1092 | $1,500 | $1.37 | 12d | 1 | 1.11mi |
| 537 Newton Ave Camden, NJ | 2.0 | 1.0 | 1092 | $1,500 | $1.37 | 18d | 1 | 1.11mi |
| 2829 Idaho Rd Camden, NJ | 3.0 | 1.5 | 1048 | $1,700 | $1.62 | 24d | 1 | 1.14mi |
| 727 Berkley St Camden, NJ | 2.0 | 1.5 | 1008 | $1,660 | $1.65 | 24d | 1 | 1.16mi |
| 2892 N Constitution Rd Camden, NJ | 3.0 | 1.0 | 1040 | $2,000 | $1.92 | 24d | 1 | 1.16mi |
| 225 Haddon Ave Collingswood, NJ | 2.0 | 2.0 | 1211 | $3,372 | $2.78 | 1d | 6 | 1.20mi |
| 1220 Grant Ave Unit 2 Oaklyn, NJ | 2.0 | 1.0 | 1000 | $1,800 | $1.80 | 20d | 1 | 1.22mi |
| 132 E Franklin Ave Unit A Collingswood, NJ | 2.0 | 1.0 | 1000 | $2,400 | $2.40 | 24d | 1 | 1.29mi |
| 609 Henry St Camden, NJ | 3.0 | 1.0 | 1290 | $1,600 | $1.24 | 24d | 1 | 1.29mi |
| 430 Richey Ave Unit 1A Oaklyn, NJ | 2.0 | 1.0 | 897 | $2,100 | $2.34 | 4d | 1 | 1.30mi |
| 1034 Collings Ave Oaklyn, NJ | 2.0 | 1.0 | 1100 | $1,750 | $1.59 | 18d | 1 | 1.30mi |
| 3079 Alabama Rd Camden, NJ | 2.0 | 1.0 | 832 | $1,700 | $2.04 | 24d | 1 | 1.31mi |
| 3132 Independence Rd Camden, NJ | 3.0 | 1.5 | 1168 | $1,595 | $1.37 | 21d | 1 | 1.38mi |
| 440 Henry St Camden, NJ | 3.0 | 1.5 | 1224 | $2,200 | $1.80 | 24d | 1 | 1.40mi |
| 1021 Monitor Rd Camden, NJ | 3.0 | 1.0 | 1012 | $1,710 | $1.69 | 24d | 1 | 1.41mi |
| 3136 Tuckahoe Rd Camden, NJ | 2.0 | 1.0 | 800 | $1,350 | $1.69 | 24d | 1 | 1.42mi |
| 3255 Crescent Dr Unit 03-3220 Camden, NJ | 2.0 | 1.0 | 700 | $1,350 | $1.93 | 24d | 1 | 1.49mi |
Listing history 8 events
-
2026-06-18price $139,900 Active 7 DOM
-
2026-06-18days on market $149,900 Active 7 DOM
-
2026-06-17days on market $149,900 Active 6 DOM
-
2026-06-16days on market $149,900 Active 5 DOM
-
2026-06-15days on market $149,900 Active 4 DOM
-
2026-06-13days on market $149,900 Active 2 DOM
-
2026-06-13remarks 451-char remark
-
2026-06-13$149,900 Active 1 DOM
ⓘ Source: listings_history table (triggers on properties + properties_extension) + one-shot
backfill from property_details.listing_events for pre-trigger history.
Tax reassessment forecast NJ · Partial reset (capped growth)
- Current annual tax
- $1,025 · $85/mo
- Projected year-2 tax
- $2,254 · $188/mo
- Expected delta
- +$1,229/yr (+$102/mo · 119.9%)
ⓘ Screening estimate from a state-policy table — verify with the county assessor before closing.
Climate risk First Street
- Flood 1/10 Low FEMA zone X (unshaded) · 0% chance over 30 yrs
- Wildfire 1/10 Low
- Heat 7/10 Severe 7 d/yr ≥103°F today · 15 d/yr by 30 yrs out
- Wind 6/10 Major 40% chance of damaging wind over 30 yrs
- Air quality 4/10 Moderate 5 unhealthy d/yr today · 6 by 30 yrs out
Nearby sold comps map
Loading sold comps map…
Walkable amenities ~0.75 mi
Loading nearby amenities…
Taxation est. · year 1
- Rental income
- $20,997
- − Mortgage interest
- −$7,837
- − Property taxes
- −$1,025
- − Insurance
- −$700
- − Repairs & maintenance
- −$1,680
- − Management
- −$1,680
- − Depreciation
- −$4,070
- Taxable income
- $4,007
- Est. tax owed @ 24.0%
- −$962
- After-tax cash flow
- $5,098/yr
For passive investors: Depreciation is non-cash, so a rental often shows a tax loss while cash-flowing — sheltering income. Rental losses are passive: they offset passive income freely, and up to $25,000/yr can offset ordinary (W-2) income if you actively participate and your MAGI is under $100k (phasing out to $0 by $150k); unused losses carry forward. On sale, claimed depreciation is recaptured at up to 25%, and gains may owe capital-gains tax (a 1031 exchange can defer both). Figures are a year-1 estimate at your 24.0% rate — not tax advice; consult a CPA.
Schools (NCES district)
- District
- Camden City School District
- NCES district ID
- 3402640
- Math proficiency
- 3% ▼ -6.00%
- Reading proficiency
- 16% ▬ 0.00%
- Median HH income
- $25,845
- Composite
- 6.85/100
- National rank
- #9981
- State rank
- #472 of 472 in NJ
Livability — Camden
- Score
- 70/100
- State rank
- #262
- US rank
- #7721
Category grades
Schools grade is shown separately in the Schools card above.
Census & demographics
- Census place
- Camden, NJ
- City population
- 20,865
- Population (ZIP)
- 21,508
Population outlook (Camden County) Hauer SSP2
- Today (2025)
- 507,964 people
- By 2030
- 502,182 · -1.1%
- By 2040
- 485,602 · -4.4%
- By 2050
- 465,630 · -8.3%
- By 2075
- 419,986 · -17.3%
- By 2100
- 369,492 · -27.3%
Race, ethnicity, and origin ACS 2023
- Neighborhood character
- Diverse neighborhood (Simpson 0.56)
- Race & ethnicity
- Black 53% Hispanic / Latino 40% Two or more races 9% White 2% Asian 1%
- Hispanic origin (detail)
- Mexican 2% Puerto Rican 22% Cuban 2% Dominican 9%
- Common ancestry
- Hispanic 2%
- Foreign-born
- 9% · Canada, Vietnam
- Languages at home
- 69% English-only · Spanish 29% Vietnamese 1%
Political lean MEDSL · Camden
- 2024 margin
- Strong D (+27.4) · D 63.0% · R 35.5% · Other 1.5%
- 2008→2024 swing
- -8.8pp toward R · 2008: 36.2pp · 2024: 27.4pp
- All cycles
- 2024: D+27.4 2020: D+33.5 2016: D+32.4 2012: D+36.6 2008: D+36.2
Not yet ingested
- Civics
- —
Market trends
- HPI YoY
- ▼ -123.43%
- Current HPI
- 209.3596
- Rent YoY
- —
- Metro
- —
- State GDP YoY
- ▲ 2.05%
- F500 in state
- 34
Industry mix (Fortune 500 HQ in NJ)
| Industry | F500 HQs | Revenue |
|---|---|---|
| Consumer Goods | 3 | $31B |
|
||
| Pharmaceuticals | 2 | $153B |
|
||
| Technology | 2 | $21B |
|
||
| Insurance | 2 | $20B |
|
||
| Healthcare | 2 | $19B |
|
||
| Financial Services | 1 | $70B |
|
||
Price history
+9893.3% since first listed5 events — show timeline
- 2026-06-12 Listed $149,900 BRIGHT MLS
- 2026-06-10 Coming Soon $149,900 BRIGHT MLS
- 2024-03-14 Rental Removed $1,425 APPFOLIO
- 2024-01-12 Price Changed $1,425 APPFOLIO
- 2023-12-15 Listed for Rent $1,500 APPFOLIO
Property tax history
-0.6%/yrLatest (2025): $1,025 · +4.1% YoY. Source: county tax records.
Cash-flow waterfall
monthlySold comps — $/sqft
last 12 mo · ≤1 miLoading sold comps…