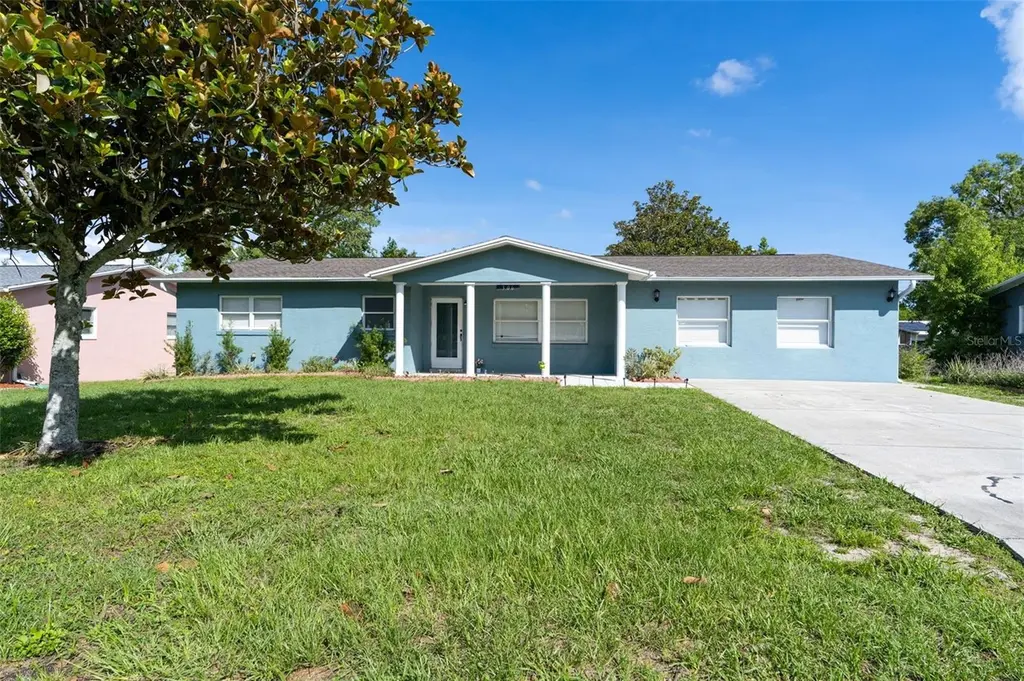
306 S Monroe St · Beverly Hills, FL
Flood risk 1/10 · Minimal
- FEMA flood zone
- X (unshaded)
- Chance of flooding over 30 yrs
- 0.0%
- Est. flood insurance / yr
- $507 – $1,088
Fire risk 2/10 · Minimal
- Est. fire insurance / yr
- $947 – $1,759
Heat risk 9/10 · Severe
- Hot days now (above 108°F)
- 7 days/yr
- Hot days in 30 yrs
- 25 days/yr
Wind risk 9/10 · Severe
- Chance of severe wind over 30 yrs
- 99.0%
Air-quality risk 1/10 · Minimal
- Unhealthy air days now
- 0 days/yr
- Unhealthy air days in 30 yrs
- 0 days/yr
Risk factors via First Street. Map © Google.
Why this score? — see what drove the C- grade
The composite is a weighted blend of 9 inputs, each scored 0–100. Each bar is that input's sub-score; the figure is the points it added to the 100-point composite (weight × sub-score).
- ARV discount +15.0/15.0
- Cash flow +14.8/30.0
- DSCR +4.5/10.0
- Schools +4.1/10.0
- 1% rule +3.9/10.0
- Livability +3.2/5.0
- Rent growth +2.5/5.0
- Condition / age +2.5/5.0
- Appreciation +0.0/10.0
$229,000
🖨 Deal sheet (PDF) 📄 Offer letter ✓ Due diligence
Listing remarks MLS
Welcome to 306 S Monroe Street in Beverly Hills, Florida—a spacious and inviting home offering comfort, flexibility, and endless potential. Featuring 3 bedrooms, 2 bathrooms, and over 2,100 square feet of living space, this property provides plenty of room for both everyday living and entertaining. The thoughtfully designed layout includes generous living areas filled with natural light, creating a warm and welcoming atmosphere throughout. The home offers an additional bonus space that can easily be used as a home office, playroom, hobby room, or second living area to fit your lifestyle needs. Outside, you'll find a large fenced-in backyard with ample space for outdoor gatherings, pets, gardening, or simply enjoying Florida's beautiful weather. A storage shed adds extra convenience and functionality. Nestled in the heart of Beverly Hills, this property is conveniently located near shopping, dining, medical facilities, parks, and outdoor recreation while still maintaining a peaceful neighborhood feel. Whether you're looking for a primary residence, seasonal retreat, or investment opportunity, this home offers exceptional value and versatility. The home is currently being leased and would be a fantastic investment opportunity. Don't miss your chance to make 306 S Monroe Street your own and enjoy everything Citrus County has to offer!
Key facts
- Storage shed
- 9,600 sq ft lot
- Built 1979
Tags
Property features AI
Finance
- Financial info: No lease restrictions reported
- HOA & community: No HOA / association
Exterior
- Parking: No parking details provided
- Utilities: Public water; Public sewer; Electricity connected; Sewer connected
- Home design: Single family residence; One story; Northeast facing; Residential property
- Construction: Block construction; Shingle roof; Block and slab foundation; Built on a 0.22-acre lot (approx. 80 x 120)
- Exterior features: Patio; Exterior storage; Chain link fencing; Asphalt/paved road access
Interior
- Kitchen: Dishwasher; Freezer; Microwave; Refrigerator
- Bedrooms: 3 bedrooms
- Flooring: Laminate; Tile
- Bathrooms: 2 full bathrooms
- Heating & cooling: Central heating; Heat pump; Central air conditioning
- Interior features: Ceiling fans; Walk-in closets
- Laundry & utility: Laundry inside
Neighborhood map
What this means for you Summary
Snapshot
- This is a 3-bed/2.0-bath single-family listed at $229k.
Deal economics
- At list price, monthly cash flow is $64 ($765/yr) — positive.
- The deal already cash-flows at list — no discount required.
- To meet the 1% rule (rent ≥ 1% of price), the offer needs to be $205k (10.5% below list).
- Recommended offer: $205k (10.5% below list) — sets the bar for 1% rule.
Location & tenants
- Location reads 64/100 on livability (#666 in FL) — a middle-class / working-renter tenant base. Strengths: cost of living A+, housing A+, health & safety A+; Watch: amenities F, commute F, employment F.
- Citrus (rural): math 49% / reading 50% proficiency, ranked #44 of 73 in FL (top 60%) — families likely to look elsewhere, expect single-tenant / working-renter base with shorter leases.
- Zoned schools: Forest Ridge Elementary School (math 55% / reading 59%, grade C+, #781 of 2,144 statewide, top 38%, 708 students, 67% FRL); Lecanto Middle School (math 49% / reading 49%, grade C-, #265 of 571 statewide, top 48%, 809 students, 55% FRL); Lecanto High School (math 46% / reading 53%, grade D, #179 of 667 statewide, top 29%, 1,630 students, 46% FRL) — zoned schools at 56% FRL track the district average.
- Market conditions: 401 active listings in the ZIP; 13 comparable units currently listed for rent nearby; rentals at typical pace (median 23d on market — plan ~3-4 weeks tenant-placement turnaround); 2,443 units permitted in Citrus County in 2024 (0 in 5+ unit buildings).
- This rent runs 45% of the median local income ($55k/yr) — at the standard rent-burdened threshold; future hikes will face affordability resistance.
Forward outlook
- Local home prices are declining (-3.0%/yr); year-one equity from $2k of loan paydown is wiped out by about $7k of value loss. Plan a longer hold.
- Citrus County population projected to shrink 10% by 2050 — rents likely to lag national; underwrite the cash flow, not the appreciation.
Negotiation context
- It's been on market 19 days — a 2% lower offer ($226k) is reasonable based on typical stale-listing flexibility.
- 11 sale attempts since 19y ago with the ask held roughly flat each time — persistent listings suggest the price (not the market) is what's stuck; bring a comps-based counter.
- Current owner paid $159k; 44% above their basis — modest negotiation headroom, anchor on the comps not their cost.
Risks & watch-outs
- Climate carrying-cost: severe wind risk, 99% chance of damaging wind over 30y; extreme-heat days projected 7→25/yr by 2055 (HVAC capex compounding) — expect insurance premiums to compound above CPI over the hold.
Questions for the listing agent
- Built in 1979 — when were the roof, HVAC, electrical panel, plumbing, and water heater last replaced?
- Is there a deadline driving the sale (1031 exchange, divorce, estate, relocation)? That informs how much negotiation room exists.
- Schools are F-rated, which usually means shorter tenancies and higher turnover. Who's the typical renter profile here, and what's been the actual vacancy rate?
- What's the average days-on-market for RENTAL listings here right now (not sales)? A rising rental-DOM trend means longer vacancies and softer asking-rent achievability than the comps imply.
- What's the recent tenant-quality profile in this submarket — average credit score on applications, eviction rate, late-payment / NSF rate, and stable-employment percentage? A property-management company in the area should have these aggregated.
- How much new for-sale + rental construction is in the pipeline within 1–3 miles? Heavy new supply typically softens prices + rents 12–24 months out; constrained supply supports both.
Investment metrics
- 1% rule
- 0.89% ✗
- Cap rate
- 6.63%
- Cash-on-cash
- 1.19%
- DSCR
- 1.05
- GRM
- 9.3
CMA / ARV
- ARV (on-the-fly)
- $324,650
- Comps found
- 8
Show comp detail 8 sales within ~0.75 mi
| Address | Dist | Beds/Ba | Sqft | Sold | Price | $/sf | Match |
|---|---|---|---|---|---|---|---|
| 29 S J Kellner Blvd | 0.23mi | 2/2.5 (-1) | 2,026 (-6%) | 1mo | $220,000 | $109 | 71 |
| 97 S Adams St | 0.45mi | 3/2.0 | 2,252 (+5%) | 7mo | $250,000 | $111 | 66 |
| 419 W Putting Green Ct | 0.45mi | 4/2.0 (+1) | 2,000 (-7%) | 4mo | $301,750 | $151 | 59 |
| 415 W Putting Green Ct | 0.45mi | 4/2.0 (+1) | 2,020 (-6%) | 8mo | $321,750 | $159 | 57 |
| 54 Sj Kellner Blvd | 0.30mi | 2/2.0 (-1) | 1,969 (-8%) | 15mo | $234,500 | $119 | 55 |
| 2457 N Brentwood Cir | 0.37mi | 3/2.0 | 1,844 (-14%) | 10mo | $341,500 | $185 | 51 |
| 2692 N Brentwood Cir | 0.75mi | 3/2.0 | 1,948 (-9%) | 19mo | $295,000 | $151 | 34 |
| 2676 N Brentwood Cir | 0.72mi | 3/2.0 | 1,832 (-15%) | 13mo | $299,900 | $164 | 31 |
Match score weights: distance 35% · size 25% · config 20% · recency 20%. Top-matched comps best support the ARV.
Projected returns pro-forma
-3.0% appreciation · 3.0% rent growth · sell at horizon
- IRR
- -14.4%
- Equity multiple
- 0.48×
- Total profit
- $-33,036
- Equity at exit
- $34,145
- IRR
- -5.6%
- Equity multiple
- 0.63×
- Total profit
- $-23,484
- Equity at exit
- $19,800
Cash invested: $64,120 (down + closing). Projections, not guarantees.
Landlord ↔ Tenant lean methodology
- Overall (STATE)
- 87 Strongly Landlord-Friendly
- State Florida
- 87 Strongly Landlord-Friendly · R+3
- County
- — inherits STATE
- City
- — inherits STATE
ZIP-level market 34465
- Home prices YoY
- -33.1%
- Active inventory
- 401
- Price-to-rent
- 9.3×
Monthly cashflow live
- Estimated rent
- $2,050 high interval (Pro) →
- Mortgage (P&I)
- −$1,201
- Tax from tax record
- −$259 /mo · $3,109/yr
- Insurance
- −$95
- HOA
- −$0
- Vacancy / Maint / Mgmt
- −$430
- Net cashflow
- $64
Break-even live
Sensitivity live
| Price | -10% $193 | -5% $129 | +0% $64 | +5% $-1 | +10% $-66 |
|---|---|---|---|---|---|
| Rent | -10% $-98 | -5% $-17 | +0% $64 | +5% $145 | +10% $226 |
| Rate | -1.0pp $179 | -0.5pp $122 | base $64 | +0.5pp $4 | +1.0pp $-56 |
UW: 25.0% down · 7.5% · 30yr · 1.5% tax · 5.0% vac · 8.0% maint · 8.0% mgmt
Financing live
Cash to close
- Down payment
- $57,250
- Closing costs
- $6,870
- Reserves months
- —
- Total cash needed
- —
Loan-product check · same deal, 3 products live
Conventional
25% down · 7.5% · 30yr
- Down + closing
- —
- Monthly P&I
- —
- Monthly cashflow
- —
- DSCR
- —
- Eligible?
- —
Personal DTI + credit; lowest rate.
DSCR
20% down · 8.5% · 30yr
- Down + closing
- —
- Monthly P&I
- —
- Monthly cashflow
- —
- DSCR
- —
- Eligible?
- —
No personal income docs; deal must DSCR.
Hard money
10% down · 12.0% · 12mo
- Down + closing
- —
- Monthly P&I
- —
- Monthly cashflow
- —
- DSCR
- —
- Eligible?
- —
Short-term bridge; refi at stabilization.
Rent comps 13 comps
| Address | Beds | Baths | Sqft | Rent | $/sqft | DOM | Units | Dist |
|---|---|---|---|---|---|---|---|---|
| 1984 W Marsten Ct Lecanto, FL | 3.0 | 2.0 | 1854 | $2,000 | $1.08 | 22d | 1 | 0.28mi |
| 209 S Tyler St Beverly Hills, FL | 2.0 | 2.0 | 1604 | $1,500 | $0.94 | 22d | 1 | 0.36mi |
| 1882 W Angelica Loop Lecanto, FL | 3.0 | 2.0 | 1706 | $1,900 | $1.11 | 22d | 1 | 0.45mi |
| 1933 W Shanelle Path Lecanto, FL | 3.0 | 2.0 | 1690 | $2,300 | $1.36 | 22d | 1 | 0.68mi |
| 42 Roosevelt Blvd Unit 1 Beverly Hills, FL | 3.0 | 1.5 | 1612 | $1,449 | $0.90 | 22d | 1 | 0.68mi |
| 1876 W Shanelle Path Lecanto, FL | 3.0 | 2.0 | 1675 | $2,100 | $1.25 | 22d | 1 | 0.73mi |
| 2443 N Andrea Pt Lecanto, FL | 3.0 | 2.5 | 1988 | $2,500 | $1.26 | 22d | 1 | 0.89mi |
| 2131 N Pinecone Ave Lecanto, FL | 2.0 | 2.0 | 1438 | $2,000 | $1.39 | 22d | 1 | 1.20mi |
| 1973 N Ember Path Hernando, FL | 2.0 | 2.0 | 1786 | $2,800 | $1.57 | 22d | 1 | 1.32mi |
| 1281 W Diamond Shore Loop Hernando, FL | 2.0 | 2.0 | 1686 | $3,000 | $1.78 | 22d | 1 | 1.37mi |
| 23 N Lee St Beverly Hills, FL | 2.0 | 1.0 | 1416 | $1,350 | $0.95 | 22d | 1 | 1.42mi |
| 1240 W Diamond Shore Loop Hernando, FL | 2.0 | 2.0 | 1770 | $2,900 | $1.64 | 22d | 1 | 1.44mi |
| 877 W Silver Meadow Loop Hernando, FL | 3.0 | 2.0 | 1637 | $2,500 | $1.53 | 22d | 1 | 1.48mi |
Listing history 14 events
-
2026-06-21days on market $229,000 Active 19 DOM
-
2026-06-19days on market $229,000 Active 17 DOM
-
2026-06-18days on market $229,000 Active 16 DOM
-
2026-06-17days on market $229,000 Active 15 DOM
-
2026-06-16days on market $229,000 Active 14 DOM
-
2026-06-15days on market $229,000 Active 13 DOM
-
2026-06-14days on market $229,000 Active 11 DOM
-
2026-06-13days on market $229,000 Active 10 DOM
-
2026-06-10days on market $229,000 Active 8 DOM
-
2026-06-09days on market $229,000 Active 7 DOM
-
2026-06-08days on market $229,000 Active 6 DOM
-
2026-06-07days on market $229,000 Active 5 DOM
-
2026-06-03remarks 693-char remark
-
2026-06-03$229,000 Active 1 DOM
ⓘ Source: listings_history table (triggers on properties + properties_extension) + one-shot
backfill from property_details.listing_events for pre-trigger history.
Tax reassessment forecast FL · Resets to sale price
- Current annual tax
- $3,109 · $259/mo
- Projected year-2 tax
- $3,109 · $259/mo
- Expected delta
- $0/yr ($0/mo · 0.0%)
ⓘ Screening estimate from a state-policy table — verify with the county assessor before closing.
Climate risk First Street
- Flood 1/10 Low FEMA zone X (unshaded) · 0% chance over 30 yrs
- Wildfire 2/10 Low
- Heat 9/10 Extreme 7 d/yr ≥108°F today · 25 d/yr by 30 yrs out
- Wind 9/10 Extreme 99% chance of damaging wind over 30 yrs
- Air quality 1/10 Low 0 unhealthy d/yr today · 0 by 30 yrs out
Nearby sold comps map
Loading sold comps map…
Walkable amenities ~0.75 mi
Loading nearby amenities…
Taxation est. · year 1
- Rental income
- $24,594
- − Mortgage interest
- −$12,828
- − Property taxes
- −$3,109
- − Insurance
- −$1,145
- − Repairs & maintenance
- −$1,968
- − Management
- −$1,968
- − Depreciation
- −$6,662
- Taxable loss
- −$3,084
- Est. tax savings @ 24.0%
- +$740
- After-tax cash flow
- $1,505/yr
For passive investors: Depreciation is non-cash, so a rental often shows a tax loss while cash-flowing — sheltering income. Rental losses are passive: they offset passive income freely, and up to $25,000/yr can offset ordinary (W-2) income if you actively participate and your MAGI is under $100k (phasing out to $0 by $150k); unused losses carry forward. On sale, claimed depreciation is recaptured at up to 25%, and gains may owe capital-gains tax (a 1031 exchange can defer both). Figures are a year-1 estimate at your 24.0% rate — not tax advice; consult a CPA.
Schools (NCES district)
- District
- Citrus
- NCES district ID
- 1200270
- Math proficiency
- 49% ▼ -10.00%
- Reading proficiency
- 50% ▼ -6.00%
- Median HH income
- $38,618
- Composite
- 41.28/100
- National rank
- #3519
- State rank
- #44 of 73 in FL
Livability — Beverly Hills
- Score
- 64/100
- State rank
- #666
- US rank
- #13671
Category grades
Schools grade is shown separately in the Schools card above.
Census & demographics
- Census place
- Beverly Hills, FL
- County
- Citrus County · 111,314 people
- City population
- 18,879
- Metro
- Homosassa Springs, FL
- Population (ZIP)
- 18,879
- Household income
- $54,869
- Rent vs Own
- Severe rent burden
- 334.0
Population outlook (Citrus County) Hauer SSP2
- Today (2025)
- 138,622 people
- By 2030
- 136,886 · -1.3%
- By 2040
- 132,009 · -4.8%
- By 2050
- 125,196 · -9.7%
- By 2075
- 108,570 · -21.7%
- By 2100
- 84,454 · -39.1%
Race, ethnicity, and origin ACS 2023
- Neighborhood character
- Predominantly White (82%)
- Race & ethnicity
- White 82% Hispanic / Latino 8% Black 4% Two or more races 3% Asian 2%
- Hispanic origin (detail)
- Mexican 1% Puerto Rican 3%
- Common ancestry
- Romanian 4% Lithuanian 3% Slovak 2%
- Foreign-born
- 8% · Canada, Vietnam, Dominican Republic
- Languages at home
- 93% English-only · Spanish 4% French/Haitian/Cajun 1% Other Asian/Pacific 1%
Political lean MEDSL · Citrus
- 2024 margin
- Solid R (+45.9) · D 26.8% · R 72.6%
- 2008→2024 swing
- -29.8pp toward R · 2008: -16.1pp · 2024: -45.9pp
- All cycles
- 2024: R+45.9 2020: R+41.0 2016: R+39.7 2012: R+21.9 2008: R+16.1
Not yet ingested
- Civics
- —
Market trends
- HPI YoY
- ▼ -138.62%
- Current HPI
- 279.7183
- Rent YoY
- —
- Metro
- Homosassa Springs, FL
- State GDP YoY
- ▲ 3.28%
- F500 in state
- 36
Industry mix (Fortune 500 HQ in FL)
| Industry | F500 HQs | Revenue |
|---|---|---|
| Industrial Technology | 2 | $29B |
|
||
| Insurance | 2 | $17B |
|
||
| Retail | 1 | $60B |
|
||
| Technology Distribution | 1 | $58B |
|
||
| Homebuilding | 1 | $35B |
|
||
| Technology Manufacturing | 1 | $35B |
|
||
Price history
+472.5% since first listed23 events — show timeline
- 2026-06-02 Listed $229,000 RACC
- 2026-06-02 Listed $229,000 Stellar MLS as Distributed by MLS Grid
- 2026-05-01 Rental Removed $1,600 RENTALBEAST
- 2026-04-02 Listed for Rent $1,600 RENTALBEAST
- 2026-04-01 Rental Removed $1,600 REDFIN
- 2026-01-20 Listed for Rent $1,600 REDFIN
- 2025-12-15 Rental Removed $1,700 RENTALBEAST
- 2025-11-19 Listed for Rent $1,700 RENTALBEAST
- 2025-11-18 Rental Removed $1,700 PROPERTYWARE
- 2025-11-13 Listed for Rent $1,700 PROPERTYWARE
- 2025-11-13 Rental Removed $1,700 RENTALBEAST
- 2025-11-07 Listed for Rent $1,700 RENTALBEAST
- 2025-11-07 Rental Removed $1,700 PROPERTYWARE
- 2025-11-05 Listed for Rent $1,700 PROPERTYWARE
- 2024-03-09 Rental Removed $1,600 PROPERTYWARE
- 2024-01-25 Listed for Rent $1,600 PROPERTYWARE
- 2021-03-10 Sold (Public Records) $159,000 Public Records
- 2012-03-21 Sold (Public Records) $60,000 Public Records
- 2012-02-24 Sold (MLS) $60,000 RACC
- 2011-06-20 Listed $64,900 RACC
- 2008-08-13 Sold (MLS) $87,000 RACC
- 2007-11-28 Listed $99,999 RACC
- 1979-08-01 Sold (Public Records) $40,000 Public Records
Property tax history
+11.6%/yrLatest (2025): $3,109 · +0.9% YoY. Source: county tax records.
Cash-flow waterfall
monthlySold comps — $/sqft
last 12 mo · ≤1 miLoading sold comps…