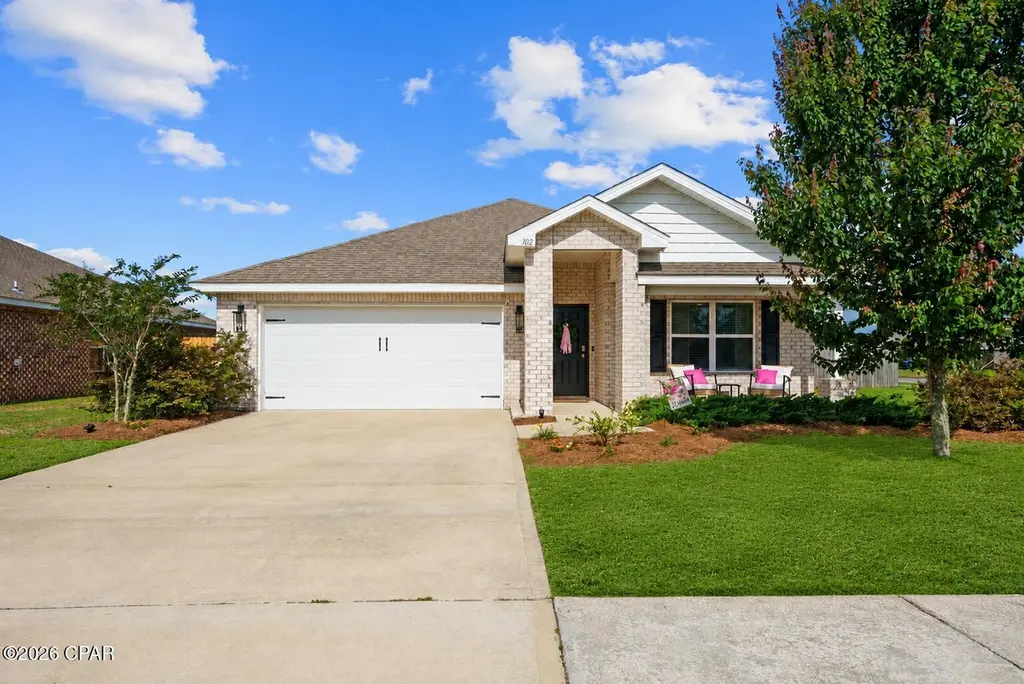
102 Spikes Cir · Lynn Haven, FL
Flood risk 4/10 · Minor
- FEMA flood zone
- X (unshaded)
- Chance of flooding over 30 yrs
- 0.16%
- Est. flood insurance / yr
- $507 – $1,088
Fire risk 6/10 · Moderate
- Est. fire insurance / yr
- $947 – $1,759
Heat risk 10/10 · Severe
- Hot days now (above 105°F)
- 7 days/yr
- Hot days in 30 yrs
- 21 days/yr
Wind risk 9/10 · Severe
- Chance of severe wind over 30 yrs
- 99.0%
Air-quality risk 1/10 · Minimal
- Unhealthy air days now
- 0 days/yr
- Unhealthy air days in 30 yrs
- 0 days/yr
Risk factors via First Street. Map © Google.
Why this score? — see what drove the D- grade
The composite is a weighted blend of 9 inputs, each scored 0–100. Each bar is that input's sub-score; the figure is the points it added to the 100-point composite (weight × sub-score).
- Appreciation +9.5/10.0
- Cash flow +6.6/30.0
- ARV discount +5.0/15.0
- Schools +4.3/10.0
- Livability +4.0/5.0
- Rent growth +2.5/5.0
- Condition / age +2.5/5.0
- 1% rule +0.9/10.0
- DSCR +0.8/10.0
$334,000
🖨 Deal sheet (PDF) 📄 Offer letter ✓ Due diligence
Listing remarks
STOP scrolling and look inside 102 Spike Circle where thoughtful upgrades, timeless finishes, and exceptional outdoor living set this home apart from the typical builder-grade experience. Located on a rare corner lot in Hodges Bayou, this exceptionally maintained 4-bedroom, 2-bath Cali floor plan offers 1,788 square feet of comfortable living space on an oversized . 241-acre lot with added privacy. What makes this home unique is that it's ALL BRICK (all 4 sides) in a community where the builder is no longer building full brick homes. Additionally, this light-colored brick home also features a charming front porch and brick columns that are no longer standard for the Cali floorpan in Hodges.
Key facts
- Covered gazebo
- Full brick
- Charming front porch
Tags
Property features AI
Finance
- HOA & community: Homeowners association with gated community access; Community playground
Exterior
- Parking: Two-car garage
- Security: Smoke detector(s)
- Utilities: Electricity available; Sewer available
- Home design: Single-story home; Brick construction; Slab foundation
- Construction: Brick construction; Slab foundation
- Exterior features: Patio; Open porch; Porch; Gazebo; Fenced yard with privacy fencing; Sprinkler system
Interior
- Kitchen: Electric cooktop; Electric oven
- Bedrooms: Three bedrooms on the first floor (approx. sizes: 12.9 x 11.6; 10.4 x 11; 10.4 x 11); Additional room on the first floor (approx. 12 x 15)
- Bathrooms: Two full bathrooms
- Heating & cooling: Central heating (electric); Central air; Ceiling fans
- Interior features: Double-pane windows; Smoke detector(s)
Neighborhood map
What this means for you Summary
Snapshot
- This is a 4-bed/2.0-bath single-family listed at $334k.
Deal economics
- At list price, monthly cash flow is $-555 ($-7k/yr) — negative.
- To cash-flow at today's rent, offer at most $236k (29.4% below list).
- To meet the 1% rule (rent ≥ 1% of price), the offer needs to be $196k (41.5% below list).
- Recommended offer: $196k (41.5% below list) — sets the bar for 1% rule.
- Cap rate 4.3% vs local median 3.5% in Lynn Haven — meaningfully above typical; check what's discounted (condition, days-on-market, listing class) to confirm the premium yield is real.
Location & tenants
- Location reads 81/100 on livability (#96 in FL, #1,472 nationally) — a professional / high-income tenant draw. Strengths: crime A+, housing A+, health & safety A+; Watch: amenities D+, commute F.
- Bay (suburban): math 51% / reading 51% proficiency, ranked #29 of 73 in FL (top 40%) — acceptable for families but not a draw, mixed tenant base, ~2y average lease.
- Zoned schools: Southport Elementary School (math 47% / reading 57%, grade C-, #990 of 2,144 statewide, top 48%, 506 students, 52% FRL) — zoned schools at 52% FRL track the district average.
- Market conditions: 301 active listings in the ZIP; 2,473 units permitted in Bay County in 2024 (559 in 5+ unit buildings).
Forward outlook
- In year one you build about $33k of equity ($2k loan paydown + $30k appreciation (9.1% local appreciation)).
- Bay County population projected at +24% by 2050 — long-run rental-demand tailwind backs the buy-and-hold thesis.
- By year 2, paydown + projected appreciation supports a ~$52k cash-out refi (75% LTV) — recoverable capital for the next deal without selling this one.
Negotiation context
- It's been on market 30 days — a 2% lower offer ($329k) is reasonable based on typical stale-listing flexibility.
Risks & watch-outs
- Climate carrying-cost: severe wind risk, 99% chance of damaging wind over 30y; major wildfire risk; extreme-heat days projected 7→21/yr by 2055 (HVAC capex compounding) — expect insurance premiums to compound above CPI over the hold.
Questions for the listing agent
- What do current leases actually rent for vs. the listed asking? Can we see a recent rent roll and the last 12 months of T-12 income?
- Is there a deadline driving the sale (1031 exchange, divorce, estate, relocation)? That informs how much negotiation room exists.
- Schools are B-rated — typically a magnet for longer-tenancy family renters. What's the average tenant stay here, and is there a school-zone premium baked into asking?
- The area grade is low — what's the realistic commute time and amenity access for the typical tenant pool here? Any planned neighborhood developments (good or bad) we should know about?
- What's the average days-on-market for RENTAL listings here right now (not sales)? A rising rental-DOM trend means longer vacancies and softer asking-rent achievability than the comps imply.
- What's the recent tenant-quality profile in this submarket — average credit score on applications, eviction rate, late-payment / NSF rate, and stable-employment percentage? A property-management company in the area should have these aggregated.
- How much new for-sale + rental construction is in the pipeline within 1–3 miles? Heavy new supply typically softens prices + rents 12–24 months out; constrained supply supports both.
Investment metrics
- 1% rule
- 0.59% ✗
- Cap rate
- 4.30%
- Cash-on-cash
- -7.13%
- DSCR
- 0.68
- GRM
- 14.2
CMA / ARV
- ARV (on-the-fly)
- $316,476
- Comps found
- 12
Show comp detail 12 sales within ~0.75 mi
| Address | Dist | Beds/Ba | Sqft | Sold | Price | $/sf | Match |
|---|---|---|---|---|---|---|---|
| 7199 Big Buck Blvd | 0.44mi | 4/2.0 | 1,799 (+1%) | 1mo | $324,900 | $181 | 78 |
| 3390 Rachel Pl | 0.44mi | 4/2.0 | 1,799 (+1%) | 1mo | $324,900 | $181 | 78 |
| 7219 Big Buck Blvd | 0.48mi | 4/2.0 | 1,799 (+1%) | 1mo | $333,685 | $185 | 76 |
| 3127 Breezy Bay Ct | 0.37mi | 4/2.5 | 1,722 (-4%) | 1mo | $279,900 | $163 | 74 |
| 3123 Sawgrass St | 0.40mi | 4/2.5 | 1,722 (-4%) | 0mo | $284,900 | $165 | 73 |
| 3119 Breezy Bay Ct | 0.37mi | 3/2.0 (-1) | 1,697 (-5%) | 1mo | $275,000 | $162 | 69 |
| 3131 Breezy Bay Ct | 0.37mi | 3/2.0 (-1) | 1,697 (-5%) | 1mo | $296,900 | $175 | 68 |
| 3124 Breezy Bay Ct | 0.37mi | 3/2.0 (-1) | 1,697 (-5%) | 2mo | $289,900 | $171 | 67 |
| 3127 Sawgrass St | 0.40mi | 3/2.0 (-1) | 1,697 (-5%) | 1mo | $299,900 | $177 | 67 |
| 3702 Tippecanoe Ln | 0.54mi | 3/2.0 (-1) | 1,826 (+2%) | 1mo | $599,000 | $328 | 66 |
| 3135 Breezy Bay Ct | 0.37mi | 4/2.5 | 1,960 (+10%) | 2mo | $319,900 | $163 | 63 |
| 3394 Rachel Pl | 0.45mi | 4/3.0 | 1,968 (+10%) | 1mo | $367,900 | $187 | 58 |
Match score weights: distance 35% · size 25% · config 20% · recency 20%. Top-matched comps best support the ARV.
Projected returns pro-forma
9.08% appreciation · 3.0% rent growth · sell at horizon
- IRR
- 17.2%
- Equity multiple
- 2.34×
- Total profit
- $125,638
- Equity at exit
- $278,772
- IRR
- 16.3%
- Equity multiple
- 5.20×
- Total profit
- $393,240
- Equity at exit
- $579,101
Cash invested: $93,520 (down + closing). Projections, not guarantees.
Landlord ↔ Tenant lean methodology
- Overall (STATE)
- 87 Strongly Landlord-Friendly
- State Florida
- 87 Strongly Landlord-Friendly · R+3
- County
- — inherits STATE
- City
- — inherits STATE
ZIP-level market 32409
- Home prices YoY
- 2.4%
- Active inventory
- 301
- Price-to-rent
- 14.2×
Monthly cashflow live
- Estimated rent
- $1,955 medium interval (Pro) →
- Mortgage (P&I)
- −$1,752
- Tax from tax record
- −$209 /mo · $2,510/yr
- Insurance
- −$139
- HOA
- −$0
- Vacancy / Maint / Mgmt
- −$411
- Net cashflow
- $-555
Break-even live
Sensitivity live
| Price | -10% $-366 | -5% $-461 | +0% $-555 | +5% $-650 | +10% $-744 |
|---|---|---|---|---|---|
| Rent | -10% $-710 | -5% $-633 | +0% $-555 | +5% $-478 | +10% $-401 |
| Rate | -1.0pp $-387 | -0.5pp $-470 | base $-555 | +0.5pp $-642 | +1.0pp $-730 |
UW: 25.0% down · 7.5% · 30yr · 1.5% tax · 5.0% vac · 8.0% maint · 8.0% mgmt
Financing live
Cash to close
- Down payment
- $83,500
- Closing costs
- $10,020
- Reserves months
- —
- Total cash needed
- —
Loan-product check · same deal, 3 products live
Conventional
25% down · 7.5% · 30yr
- Down + closing
- —
- Monthly P&I
- —
- Monthly cashflow
- —
- DSCR
- —
- Eligible?
- —
Personal DTI + credit; lowest rate.
DSCR
20% down · 8.5% · 30yr
- Down + closing
- —
- Monthly P&I
- —
- Monthly cashflow
- —
- DSCR
- —
- Eligible?
- —
No personal income docs; deal must DSCR.
Hard money
10% down · 12.0% · 12mo
- Down + closing
- —
- Monthly P&I
- —
- Monthly cashflow
- —
- DSCR
- —
- Eligible?
- —
Short-term bridge; refi at stabilization.
Listing history 20 events
-
2026-06-21days on market $334,000 Active 30 DOM
-
2026-06-19days on market $334,000 Active 28 DOM
-
2026-06-18days on market $334,000 Active 27 DOM
-
2026-06-17days on market $334,000 Active 26 DOM
-
2026-06-16days on market $334,000 Active 25 DOM
-
2026-06-15days on market $334,000 Active 24 DOM
-
2026-06-14days on market $334,000 Active 22 DOM
-
2026-06-13days on market $334,000 Active 21 DOM
-
2026-06-10days on market $334,000 Active 19 DOM
-
2026-06-09days on market $334,000 Active 18 DOM
-
2026-06-08remarks 699-char remark
-
2026-06-08days on market $334,000 Active 17 DOM
-
2026-06-07days on market $334,000 Active 16 DOM
-
2026-06-05days on market $334,000 Active 13 DOM
-
2026-06-03days on market $334,000 Active 12 DOM
-
2026-06-02days on market $334,000 Active 11 DOM
-
2026-06-01days on market $334,000 Active 10 DOM
-
2026-05-31days on market $334,000 Active 9 DOM
-
2026-05-30days on market $334,000 Active 8 DOM
-
2026-05-21$334,000 Active
ⓘ Source: listings_history table (triggers on properties + properties_extension) + one-shot
backfill from property_details.listing_events for pre-trigger history.
Tax reassessment forecast FL · Resets to sale price
- Current annual tax
- $2,510 · $209/mo
- Projected year-2 tax
- $2,772 · $231/mo
- Expected delta
- +$262/yr (+$22/mo · 10.4%)
ⓘ Screening estimate from a state-policy table — verify with the county assessor before closing.
Climate risk First Street
- Flood 4/10 Moderate FEMA zone X (unshaded) · 16% chance over 30 yrs
- Wildfire 6/10 Major
- Heat 10/10 Extreme 7 d/yr ≥105°F today · 21 d/yr by 30 yrs out
- Wind 9/10 Extreme 99% chance of damaging wind over 30 yrs
- Air quality 1/10 Low 0 unhealthy d/yr today · 0 by 30 yrs out
Nearby sold comps map
Loading sold comps map…
Walkable amenities ~0.75 mi
Loading nearby amenities…
Taxation est. · year 1
- Rental income
- $23,461
- − Mortgage interest
- −$18,709
- − Property taxes
- −$2,510
- − Insurance
- −$1,670
- − Repairs & maintenance
- −$1,877
- − Management
- −$1,877
- − Depreciation
- −$9,716
- Taxable loss
- −$12,899
- Est. tax savings @ 24.0%
- +$3,096
- After-tax cash flow
- $-3,569/yr
For passive investors: Depreciation is non-cash, so a rental often shows a tax loss while cash-flowing — sheltering income. Rental losses are passive: they offset passive income freely, and up to $25,000/yr can offset ordinary (W-2) income if you actively participate and your MAGI is under $100k (phasing out to $0 by $150k); unused losses carry forward. On sale, claimed depreciation is recaptured at up to 25%, and gains may owe capital-gains tax (a 1031 exchange can defer both). Figures are a year-1 estimate at your 24.0% rate — not tax advice; consult a CPA.
Schools (NCES district)
- District
- Bay
- NCES district ID
- 1200090
- Math proficiency
- 51% ▼ -8.00%
- Reading proficiency
- 51% ▼ -7.00%
- Median HH income
- $47,740
- Composite
- 43.41/100
- National rank
- #3014
- State rank
- #29 of 73 in FL
Livability — Lynn Haven
- Score
- 81/100
- State rank
- #96
- US rank
- #1472
Category grades
Schools grade is shown separately in the Schools card above.
Census & demographics
- City population
- 21,459
- Population (ZIP)
- 10,941
Population outlook (Bay County) Hauer SSP2
- Today (2025)
- 206,264 people
- By 2030
- 217,740 · +5.6%
- By 2040
- 238,738 · +15.7%
- By 2050
- 255,545 · +23.9%
- By 2075
- 288,295 · +39.8%
- By 2100
- 288,638 · +39.9%
Race, ethnicity, and origin ACS 2023
- Neighborhood character
- Predominantly White (88%)
- Race & ethnicity
- White 88% Hispanic / Latino 7% Two or more races 4% Asian 1%
- Hispanic origin (detail)
- Mexican 3% Puerto Rican 2%
- Common ancestry
- Lithuanian 4% Slovak 3% Serbian 2%
- Foreign-born
- 4% · Canada, Jamaica, South Korea
- Languages at home
- 94% English-only · Spanish 4% Other Indo-European 1%
Political lean MEDSL · Bay
- 2024 margin
- Solid R (+47.4) · D 25.8% · R 73.1% · Other 1.1%
- 2008→2024 swing
- -6.6pp toward R · 2008: -40.7pp · 2024: -47.4pp
- All cycles
- 2024: R+47.4 2020: R+43.5 2016: R+46.3 2012: R+43.6 2008: R+40.7
Not yet ingested
- Civics
- —
Market trends
- HPI YoY
- ▲ 9.08%
- Current HPI
- 391.06
- Rent YoY
- —
- Metro
- —
- State GDP YoY
- ▲ 3.28%
- F500 in state
- 36
Industry mix (Fortune 500 HQ in FL)
| Industry | F500 HQs | Revenue |
|---|---|---|
| Industrial Technology | 2 | $29B |
|
||
| Insurance | 2 | $17B |
|
||
| Retail | 1 | $60B |
|
||
| Technology Distribution | 1 | $58B |
|
||
| Homebuilding | 1 | $35B |
|
||
| Technology Manufacturing | 1 | $35B |
|
||
Price history
1 event — show timeline
- 2026-05-21 Listed $334,000 CPARMLS
Property tax history
+64.1%/yrLatest (2025): $2,510 · +3.4% YoY. Source: county tax records.
Cash-flow waterfall
monthlySold comps — $/sqft
last 12 mo · ≤1 miLoading sold comps…