4215 Meadow View Dr · Boynton Beach, FL
Flood risk 6/10 · Moderate
- FEMA flood zone
- X (unshaded)
- Chance of flooding over 30 yrs
- 0.68%
- Est. flood insurance / yr
- $507 – $1,088
Fire risk 1/10 · Minimal
- Est. fire insurance / yr
- $947 – $1,759
Heat risk 9/10 · Severe
- Hot days now (above 106°F)
- 7 days/yr
- Hot days in 30 yrs
- 25 days/yr
Wind risk 10/10 · Severe
- Chance of severe wind over 30 yrs
- 99.0%
Air-quality risk 2/10 · Minimal
- Unhealthy air days now
- 1 days/yr
- Unhealthy air days in 30 yrs
- 2 days/yr
Risk factors via First Street. Map © Google.
Why this score? — see what drove the B- grade
The composite is a weighted blend of 9 inputs, each scored 0–100. Each bar is that input's sub-score; the figure is the points it added to the 100-point composite (weight × sub-score).
- Cash flow +30.0/30.0
- DSCR +10.0/10.0
- 1% rule +8.6/10.0
- ARV discount +7.5/15.0
- Schools +4.3/10.0
- Livability +3.6/5.0
- Condition / age +2.5/5.0
- Rent growth +2.4/5.0
- Appreciation +0.0/10.0
$224,900
🖨 Deal sheet (PDF) 📄 Offer letter ✓ Due diligence
Listing remarks
The ULTIMATE PACKAGE: Tropical style, massive space, & low low fees. Stop looking- here it is. A rare gem that blends high end tropical aesthetics with the best financial profile in the area. While this house boasts just under 1700 sq ft living space, with two additions added , the energy efficient home's utility bills are on average no higher than $60 per month!!! 4 bedrooms, 2.5 baths, updated kitchen, , extra living space , wifi enabled extras indoor laundry, wireless alarm system, central and zoned A/C and heat. Beautifully landscaped and private. Patio, carport, hurricane room and PLENTY of storage space. Located in the serene 55+community of Tropical Breeze where you can enjoy
Key facts
- Wifi enabled extras
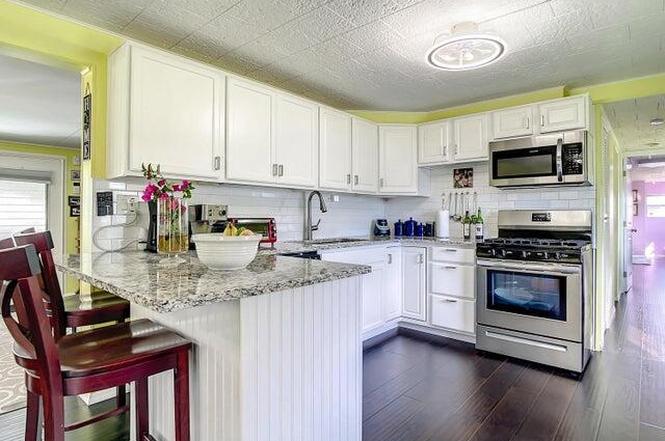
- Updated kitchen
- 6,090 sq ft lot
Tags
Property features AI
Finance
- Other: Owner-provided building area
- Financial info: Pets allowed (number limit)
- HOA & community: Has association; Monthly association fee of $115; Association maintains grounds and common areas; Community amenities include clubhouse, pool, shuffleboard court, storage, and street lights; Senior community
Exterior
- Parking: Carport with 2 covered spaces
- Security: Smoke detector(s)
- Utilities: Public water; Public sewer; Cable available; Water and sewer available
- Home design: Mobile home; Single-story; Multi/split levels; Entry level living area; Faces south; West of US-1 road frontage
- Construction: Vinyl siding and mixed construction; Aluminum roof / roof over; Other skirt; Built as resale (existing home)
- Exterior features: Shed(s); Many trees on the lot; Paved road frontage; No waterfront
Interior
- Kitchen: Dishwasher; Gas range; Microwave; Refrigerator
- Bedrooms: 4 bedrooms on the main level
- Flooring: Vinyl
- Bathrooms: 2 full bathrooms and 1 half bathroom (3 total), with 2 bathrooms on the main level
- Heating & cooling: Central heating; Central air; Ceiling fans; Wall/window AC units
- Interior features: Built-in features; Closet cabinetry; Tinted windows; Furnished
- Laundry & utility: Inside laundry; Gas water heater
Neighborhood map
What this means for you Summary
Snapshot
- This is a 4-bed/2.5-bath manufactured listed at $225k.
Deal economics
- At list price, monthly cash flow is $954 ($11k/yr) — positive.
- The deal already cash-flows at list — no discount required.
- Meets the 1% rule at list price ($3k rent vs $225k).
- Recommended offer: $198k (12.0% below list) — sets the bar for market timing.
- Cap rate 11.4% vs local median 4.3% in Boynton Beach — top-decile yield for the area; either an underpriced asset or a hidden risk that comps aren't pricing in. Stress-test before assuming the spread holds.
Location & tenants
- Location reads 72/100 on livability (#351 in FL) — a middle-class / working-renter tenant base. Strengths: housing A+, health & safety B+, cost of living B; Watch: amenities D+, crime D-, commute F.
- Palm Beach (suburban): math 46% / reading 53% proficiency, ranked #34 of 73 in FL (top 47%) — families likely to look elsewhere, expect single-tenant / working-renter base with shorter leases.
- Market conditions: Rents soft (-0.6%/yr); 457 active listings in the ZIP; 40 comparable units currently listed for rent nearby; rentals at typical pace (median 22d on market — plan ~3-4 weeks tenant-placement turnaround); solid renter incomes; 3,974 units permitted in Palm Beach County in 2024 (1,012 in 5+ unit buildings).
- At $3,066/mo this rent would consume 49% of the median local household income ($76k/yr) (locally 1813% of renters already pay >50% of income on rent) — very limited rent-growth headroom before tenants either downsize or default.
Forward outlook
- Local home prices are declining (-3.0%/yr); year-one equity from $2k of loan paydown is wiped out by about $7k of value loss. Plan a longer hold.
- Palm Beach County population projected at +30% by 2050 — long-run rental-demand tailwind backs the buy-and-hold thesis.
- At projected returns (-3.0% appreciation + 0.0% rent growth), your $63k cash investment doubles in ~9 years — after that, you're playing with house money.
Negotiation context
- It's been on market 152 days — a 12% lower offer ($198k) is reasonable based on typical stale-listing flexibility.
- 5 sale attempts since 5y ago; this cycle's ask has dropped $14k (6%) from the opening price — seller is motivated, your offer sets the floor, not the list.
- Current owner paid $92k; list at $225k implies a 143% gain — meaningful room to come down on a strong offer.
Risks & watch-outs
- Climate carrying-cost: major flood risk; severe wind risk, 99% chance of damaging wind over 30y; extreme-heat days projected 7→25/yr by 2055 (HVAC capex compounding) — expect insurance premiums to compound above CPI over the hold.
Questions for the listing agent
- It's been on market 152 days. Have you received any prior offers? Is the seller open to a 12% concession, seller financing, or rate buy-down credit?
- Built in 1969 — when were the roof, HVAC, electrical panel, plumbing, and water heater last replaced?
- What does the HOA fee cover, when was the last increase, and are there any pending special assessments or reserve-fund shortfalls?
- Why hasn't it sold? Are there any deal-killer items the seller is aware of (foundation, flood, title, zoning, code violations)?
- Is there a deadline driving the sale (1031 exchange, divorce, estate, relocation)? That informs how much negotiation room exists.
- Crime grade is D in this area — have there been break-ins, vandalism, or insurance claims at this property in the last 3 years? What carrier currently insures it and at what premium?
- What's the average days-on-market for RENTAL listings here right now (not sales)? A rising rental-DOM trend means longer vacancies and softer asking-rent achievability than the comps imply.
- What's the recent tenant-quality profile in this submarket — average credit score on applications, eviction rate, late-payment / NSF rate, and stable-employment percentage? A property-management company in the area should have these aggregated.
- How much new for-sale + rental construction is in the pipeline within 1–3 miles? Heavy new supply typically softens prices + rents 12–24 months out; constrained supply supports both.
Investment metrics
- 1% rule
- 1.36% ✓
- Cap rate
- 11.38%
- Cash-on-cash
- 18.17%
- DSCR
- 1.81
- GRM
- 6.1
CMA / ARV
No comps found within radius.
Projected returns pro-forma
-3.0% appreciation · 0.0% rent growth · sell at horizon
- IRR
- 6.5%
- Equity multiple
- 1.24×
- Total profit
- $15,295
- Equity at exit
- $33,533
- IRR
- 13.1%
- Equity multiple
- 1.90×
- Total profit
- $56,766
- Equity at exit
- $19,445
Cash invested: $62,972 (down + closing). Projections, not guarantees.
Landlord ↔ Tenant lean methodology
- Overall (STATE)
- 87 Strongly Landlord-Friendly
- State Florida
- 87 Strongly Landlord-Friendly · R+3
- County
- — inherits STATE
- City
- — inherits STATE
ZIP-level market 33436
- Home prices YoY
- -26.0%
- Rents YoY
- -0.6%
- Active inventory
- 457
- Price-to-rent
- 6.1×
Monthly cashflow live
- Estimated rent
- $3,066 high interval (Pro) →
- Mortgage (P&I)
- −$1,179
- Tax from tax record
- −$81 /mo · $970/yr
- Insurance
- −$94
- HOA
- −$115
- Vacancy / Maint / Mgmt
- −$644
- Net cashflow
- $954
Break-even live
Sensitivity live
| Price | -10% $1,081 | -5% $1,017 | +0% $954 | +5% $890 | +10% $826 |
|---|---|---|---|---|---|
| Rent | -10% $711 | -5% $832 | +0% $954 | +5% $1,075 | +10% $1,196 |
| Rate | -1.0pp $1,067 | -0.5pp $1,011 | base $954 | +0.5pp $895 | +1.0pp $836 |
UW: 25.0% down · 7.5% · 30yr · 1.5% tax · 5.0% vac · 8.0% maint · 8.0% mgmt
Financing live
Cash to close
- Down payment
- $56,225
- Closing costs
- $6,747
- Reserves months
- —
- Total cash needed
- —
Loan-product check · same deal, 3 products live
Conventional
25% down · 7.5% · 30yr
- Down + closing
- —
- Monthly P&I
- —
- Monthly cashflow
- —
- DSCR
- —
- Eligible?
- —
Personal DTI + credit; lowest rate.
DSCR
20% down · 8.5% · 30yr
- Down + closing
- —
- Monthly P&I
- —
- Monthly cashflow
- —
- DSCR
- —
- Eligible?
- —
No personal income docs; deal must DSCR.
Hard money
10% down · 12.0% · 12mo
- Down + closing
- —
- Monthly P&I
- —
- Monthly cashflow
- —
- DSCR
- —
- Eligible?
- —
Short-term bridge; refi at stabilization.
Rent comps 40 comps
| Address | Beds | Baths | Sqft | Rent | $/sqft | DOM | Units | Dist |
|---|---|---|---|---|---|---|---|---|
| 4045 White Pine Dr Boynton Beach, FL | 3.0 | 2.0 | 1566 | $1,800 | $1.15 | 2d | 1 | 0.30mi |
| 3736 Coelebs Ave Boynton Beach, FL | 3.0 | 2.0 | 1232 | $3,000 | $2.44 | 25d | 1 | 0.48mi |
| 3962 Winfield Rd Boynton Beach, FL | 4.0 | 2.0 | 1592 | $3,300 | $2.07 | 16d | 1 | 0.48mi |
| 3962 Winfield Rd Unit 3962 Boynton Beach, FL | 4.0 | 2.0 | 1592 | $3,300 | $2.07 | 15d | 1 | 0.48mi |
| 3962 Winfield Rd Boynton Beach, FL | 4.0 | 2.0 | 1592 | $3,300 | $2.07 | 0d | 1 | 0.48mi |
| 8202 White Rock Cir Boynton Beach, FL | 3.0 | 2.0 | 1738 | $3,300 | $1.90 | 9d | 1 | 0.56mi |
| 3930 Max Pl Boynton Beach, FL | 3.0 | 2.0 | 1550 | $2,825 | $1.82 | 25d | 1 | 0.63mi |
| 9766 Kamena Cir Boynton Beach, FL | 3.0 | 2.5 | 1596 | $3,300 | $2.07 | 6d | 1 | 0.76mi |
| 3561 Oberon Ave Boynton Beach, FL | 3.0 | 2.0 | 1248 | $2,850 | $2.28 | 22d | 1 | 0.82mi |
| 9498 S Military Trl #5 Boynton Beach, FL | 3.0 | 2.5 | 1317 | $2,900 | $2.20 | 25d | 1 | 0.89mi |
| 9842 Kamena Cir Boynton Beach, FL | 3.0 | 2.5 | 1596 | $2,800 | $1.75 | 25d | 1 | 0.90mi |
| 190 Temple Ave Boynton Beach, FL | 3.0 | 2.0 | 1781 | $4,200 | $2.36 | 25d | 1 | 1.05mi |
| 3665 Silver Lace Ln #77 Boynton Beach, FL | 3.0 | 2.5 | 1570 | $2,800 | $1.78 | 25d | 1 | 1.05mi |
| 5155 Europa Dr Unit J Boynton Beach, FL | 3.0 | 2.0 | 1333 | $2,750 | $2.06 | 25d | 1 | 1.12mi |
| 1620 Cetona Dr Boynton Beach, FL | 4.0 | 2.0 | 1681 | $3,200 | $1.90 | 25d | 1 | 1.13mi |
| 2305 N Congress Ave #18 Boynton Beach, FL | 3.0 | 2.0 | 1217 | $2,600 | $2.14 | 16d | 1 | 1.19mi |
| 5157 Floria Way Unit J Boynton Beach, FL | 3.0 | 2.0 | 1447 | $3,300 | $2.28 | 25d | 1 | 1.22mi |
| 5373 Mirror Lakes Blvd Boynton Beach, FL | 3.0 | 2.0 | 1310 | $2,100 | $1.60 | 25d | 1 | 1.27mi |
| 5299 Europa Dr Unit P Boynton Beach, FL | 3.0 | 2.0 | 1606 | $3,000 | $1.87 | 15d | 1 | 1.28mi |
| 4296 Grove Park Ln Boynton Beach, FL | 3.0 | 2.0 | 1696 | $3,350 | $1.98 | 25d | 1 | 1.29mi |
| 2 Renaissance Way #305 Boynton Beach, FL | 3.0 | 2.0 | 1367 | $3,200 | $2.34 | 5d | 1 | 1.29mi |
| 4220 Grove Park Ln Unit 1 Boynton Beach, FL | 3.0 | 2.0 | 1406 | $3,400 | $2.42 | 5d | 1 | 1.31mi |
| 4220 Grove Park Ln Unit 1 Boynton Beach, FL | 3.0 | 2.0 | 1406 | $3,600 | $2.56 | 25d | 1 | 1.31mi |
| 5133 Brisata Cir Unit P Boynton Beach, FL | 3.0 | 2.0 | 1374 | $2,800 | $2.04 | 25d | 1 | 1.31mi |
| 1605 Renaissance Commons Blvd Boynton Beach, FL | 1.0–3.0 | 1.0–2.0 | 1148 | $3,126 | $2.72 | 0d | 13 | 1.32mi |
| 5234 Europa Dr Unit A Boynton Beach, FL | 3.0 | 2.0 | 1578 | $2,500 | $1.58 | 21d | 1 | 1.32mi |
| 1100 Audace Ave Boynton Beach, FL | 1.0–3.0 | 1.0–2.0 | 1021 | $3,280 | $3.21 | 0d | 22 | 1.35mi |
| 1794 Banyan Creek Cir N Boynton Beach, FL | 3.0 | 2.0 | 1524 | $3,200 | $2.10 | 25d | 1 | 1.35mi |
| 7705 Forest Green Ln Boynton Beach, FL | 3.0 | 2.0 | 1379 | $3,200 | $2.32 | 25d | 1 | 1.35mi |
| 1690 Renaissance Commons Blvd Boynton Beach, FL | 2.0–3.0 | 2.0 | 940 | $3,800 | $4.04 | 0d | 3 | 1.39mi |
| 1645 Renaissance Commons Blvd Boynton Beach, FL | 3.0 | 2.0 | 1460 | $3,040 | $2.08 | 0d | 1 | 1.39mi |
| 1239 Sussex St Boynton Beach, FL | 3.0 | 2.0 | 1436 | $3,100 | $2.16 | 25d | 1 | 1.39mi |
| 1239 Sussex St Boynton Beach, FL | 3.0 | 2.0 | 1436 | $3,100 | $2.16 | 21d | 1 | 1.39mi |
| 7640 Forest Green Ln Unit 7640 Boynton Beach, FL | 3.0 | 2.0 | 1696 | $3,500 | $2.06 | 12d | 1 | 1.41mi |
| 7640 Forest Green Ln Boynton Beach, FL | 3.0 | 2.0 | 1696 | $3,500 | $2.06 | 25d | 1 | 1.41mi |
| 5275 Europa Dr Unit I Boynton Beach, FL | 3.0 | 2.0 | 1282 | $2,500 | $1.95 | 3d | 1 | 1.42mi |
| 18 Via de Casas Sur #205 Boynton Beach, FL | 3.0 | 2.0 | 1096 | $2,750 | $2.51 | 25d | 1 | 1.43mi |
| 5072 Arbor Glen Cir Lake Worth, FL | 3.0 | 2.0 | 1232 | $3,300 | $2.68 | 16d | 1 | 1.44mi |
| 1859 Via Granada Boynton Beach, FL | 3.0 | 3.0 | 1805 | $2,995 | $1.66 | 25d | 1 | 1.46mi |
| 5537 Pebble Brook Ln Boynton Beach, FL | 3.0 | 2.0 | 1166 | $2,825 | $2.42 | 16d | 1 | 1.47mi |
HOA detail
- Monthly dues
- $115 · $1,380/yr
- Likely covers
- internet
Listing history 50 events
-
2026-06-21days on market $224,900 Active 152 DOM
-
2026-06-18days on market $224,900 Active 149 DOM
-
2026-06-17days on market $224,900 Active 148 DOM
-
2026-06-16days on market $224,900 Active 147 DOM
-
2026-06-15days on market $224,900 Active 146 DOM
-
2026-06-13days on market $224,900 Active 144 DOM
-
2026-06-09days on market $224,900 Active 140 DOM
-
2026-06-07days on market $224,900 Active 138 DOM
-
2026-06-04days on market $224,900 Active 135 DOM
-
2026-06-03days on market $224,900 Active 134 DOM
-
2026-06-01days on market $224,900 Active 132 DOM
-
2026-05-31days on market $224,900 Active 131 DOM
-
2026-04-29price $224,900
-
2026-03-19price $229,999
-
2026-01-20$239,000 Active
-
2026-01-12historical
-
2025-11-30price $239,999
-
2025-09-10price $249,999
-
2025-03-12price $229,998
-
2025-03-04price $234,999
-
2025-01-29price $236,999
-
2025-01-15price $238,000
-
2024-12-20price $239,000
-
2024-12-13$339,000 Active
-
2024-11-26historical
-
2024-11-26historical
-
2024-11-17price $224,990
-
2024-11-10price $229,990
-
2024-11-10price $229,999
-
2024-11-10price $229,990
-
2024-11-10price $229,999
-
2024-11-10price $229,990
-
2024-11-10price $229,999
-
2024-11-10price $229,990
-
2024-10-20price $229,999
-
2024-10-20price $229,998
-
2024-10-20price $229,999
-
2024-10-03price $233,999
-
2024-02-27price $234,999
-
2024-02-27price $234,999
-
2024-01-02price $244,999
-
2024-01-02price $244,999
-
2023-12-26$249,999 Active
-
2023-11-26price $249,999
-
2023-11-13price $224,999
-
2023-10-25price $225,999
-
2023-07-24$229,000 Active
-
2021-10-08soldstatus $92,500 Closed
-
2021-09-09historical Active Under Contract
-
2021-09-01price $99,500
ⓘ Source: listings_history table (triggers on properties + properties_extension) + one-shot
backfill from property_details.listing_events for pre-trigger history.
Tax reassessment forecast FL · Resets to sale price
- Current annual tax
- $970 · $81/mo
- Projected year-2 tax
- $1,867 · $156/mo
- Expected delta
- +$897/yr (+$75/mo · 92.5%)
ⓘ Screening estimate from a state-policy table — verify with the county assessor before closing.
Climate risk First Street
- Flood 6/10 Major FEMA zone X (unshaded) · 68% chance over 30 yrs
- Wildfire 1/10 Low
- Heat 9/10 Extreme 7 d/yr ≥106°F today · 25 d/yr by 30 yrs out
- Wind 10/10 Extreme 99% chance of damaging wind over 30 yrs
- Air quality 2/10 Low 1 unhealthy d/yr today · 2 by 30 yrs out
Nearby sold comps map
Loading sold comps map…
Walkable amenities ~0.75 mi
Loading nearby amenities…
Taxation est. · year 1
- Rental income
- $36,796
- − Mortgage interest
- −$12,598
- − Property taxes
- −$970
- − Insurance
- −$1,124
- − Repairs & maintenance
- −$2,944
- − Management
- −$2,944
- − HOA
- −$1,380
- − Depreciation
- −$6,543
- Taxable income
- $8,295
- Est. tax owed @ 24.0%
- −$1,991
- After-tax cash flow
- $9,452/yr
For passive investors: Depreciation is non-cash, so a rental often shows a tax loss while cash-flowing — sheltering income. Rental losses are passive: they offset passive income freely, and up to $25,000/yr can offset ordinary (W-2) income if you actively participate and your MAGI is under $100k (phasing out to $0 by $150k); unused losses carry forward. On sale, claimed depreciation is recaptured at up to 25%, and gains may owe capital-gains tax (a 1031 exchange can defer both). Figures are a year-1 estimate at your 24.0% rate — not tax advice; consult a CPA.
Schools (NCES district)
- District
- Palm Beach
- NCES district ID
- 1201500
- Math proficiency
- 46% ▼ -16.00%
- Reading proficiency
- 53% ▼ -4.00%
- Median HH income
- $53,943
- Composite
- 42.72/100
- National rank
- #3160
- State rank
- #34 of 73 in FL
Livability — Boynton Beach
- Score
- 72/100
- State rank
- #351
- US rank
- #6098
Category grades
Schools grade is shown separately in the Schools card above.
Census & demographics
- County
- Palm Beach County · 1,438,312 people
- City population
- 148,060
- Metro
- Miami-Fort Lauderdale-Pompano Beach, FL
- Population (ZIP)
- 48,743
- Household income
- $75,789
- Rent vs Own
- Severe rent burden
- 1813.0
Population outlook (Palm Beach County) Hauer SSP2
- Today (2025)
- 1,637,487 people
- By 2030
- 1,743,255 · +6.5%
- By 2040
- 1,948,712 · +19.0%
- By 2050
- 2,132,979 · +30.3%
- By 2075
- 2,530,027 · +54.5%
- By 2100
- 2,706,979 · +65.3%
Race, ethnicity, and origin ACS 2023
- Neighborhood character
- Diverse neighborhood (Simpson 0.64)
- Race & ethnicity
- White 52% Black 24% Hispanic / Latino 19% Two or more races 10% Asian 2%
- Hispanic origin (detail)
- Mexican 2% Puerto Rican 4% Cuban 3% Dominican 1%
- Common ancestry
- Hispanic 12% Romanian 3% Scotch-Irish 2%
- Foreign-born
- 27% · Canada, Jamaica, Vietnam
- Languages at home
- 64% English-only · Spanish 14% French/Haitian/Cajun 13% Other Indo-European 2%
Political lean MEDSL · Palm Beach
- 2024 margin
- Toss-up / Even · D 50.0% · R 49.2%
- 2008→2024 swing
- -22.1pp toward R · 2008: 22.9pp · 2024: 0.8pp
- All cycles
- 2024: D+0.8 2020: D+12.8 2016: D+15.3 2012: D+17.0 2008: D+22.9
Not yet ingested
- Civics
- —
Market trends
- HPI YoY
- ▼ -109.59%
- Current HPI
- 311.7742
- Rent YoY
- ▼ -0.57%
- Metro
- Miami-Fort Lauderdale-Pompano Beach, FL
- State GDP YoY
- ▲ 3.28%
- F500 in state
- 36
Industry mix (Fortune 500 HQ in FL)
| Industry | F500 HQs | Revenue |
|---|---|---|
| Industrial Technology | 2 | $29B |
|
||
| Insurance | 2 | $17B |
|
||
| Retail | 1 | $60B |
|
||
| Technology Distribution | 1 | $58B |
|
||
| Homebuilding | 1 | $35B |
|
||
| Technology Manufacturing | 1 | $35B |
|
||
Price history
+799.6% since first listed42 events — show timeline
- 2026-04-29 Price Changed $224,900 Beaches MLS
- 2026-03-19 Price Changed $229,999 Beaches MLS
- 2026-01-20 Listed $239,000 Beaches MLS
- 2026-01-12 Listing Removed — Beaches MLS
- 2025-11-30 Price Changed $239,999 Beaches MLS
- 2025-09-10 Price Changed $249,999 Beaches MLS
- 2025-03-12 Price Changed $229,998 Beaches MLS
- 2025-03-04 Price Changed $234,999 Beaches MLS
- 2025-01-29 Price Changed $236,999 Beaches MLS
- 2025-01-15 Price Changed $238,000 Beaches MLS
- 2024-12-20 Price Changed $239,000 Beaches MLS
- 2024-12-13 Listed $339,000 Beaches MLS
- 2024-11-26 Listing Removed — Stellar MLS as Distributed by MLS Grid
- 2024-11-26 Listing Removed — Beaches MLS
- 2024-11-17 Price Changed $224,990 Beaches MLS
- 2024-11-10 Price Changed $229,990 Beaches MLS
- 2024-11-10 Price Changed $229,999 Beaches MLS
- 2024-11-10 Price Changed $229,990 Beaches MLS
- 2024-11-10 Price Changed $229,999 Beaches MLS
- 2024-11-10 Price Changed $229,990 Beaches MLS
- 2024-11-10 Price Changed $229,999 Beaches MLS
- 2024-11-10 Price Changed $229,990 Beaches MLS
- 2024-10-20 Price Changed $229,999 Beaches MLS
- 2024-10-20 Price Changed $229,998 Beaches MLS
- 2024-10-20 Price Changed $229,999 Beaches MLS
- 2024-10-03 Price Changed $233,999 Beaches MLS
- 2024-02-27 Price Changed $234,999 Beaches MLS
- 2024-02-27 Price Changed $234,999 Stellar MLS as Distributed by MLS Grid
- 2024-01-02 Price Changed $244,999 Beaches MLS
- 2024-01-02 Price Changed $244,999 Stellar MLS as Distributed by MLS Grid
- 2023-12-26 Listed $249,999 Stellar MLS as Distributed by MLS Grid
- 2023-11-26 Price Changed $249,999 Beaches MLS
- 2023-11-13 Price Changed $224,999 Beaches MLS
- 2023-10-25 Price Changed $225,999 Beaches MLS
- 2023-07-24 Listed $229,000 Beaches MLS
- 2021-10-08 Sold (MLS) $92,500 Beaches MLS
- 2021-09-09 Contingent — Beaches MLS
- 2021-09-01 Price Changed $99,500 Beaches MLS
- 2021-08-19 Listed $105,000 Beaches MLS
- 1989-11-27 Sold (Public Records) $47,500 Public Records
- 1986-11-01 Sold (Public Records) $39,900 Public Records
- 1982-11-01 Sold (Public Records) $25,000 Public Records
Property tax history
+1.0%/yrLatest (2025): $970 · +3.0% YoY. Source: county tax records.
Cash-flow waterfall
monthlySold comps — $/sqft
last 12 mo · ≤1 miLoading sold comps…