 Multi-family
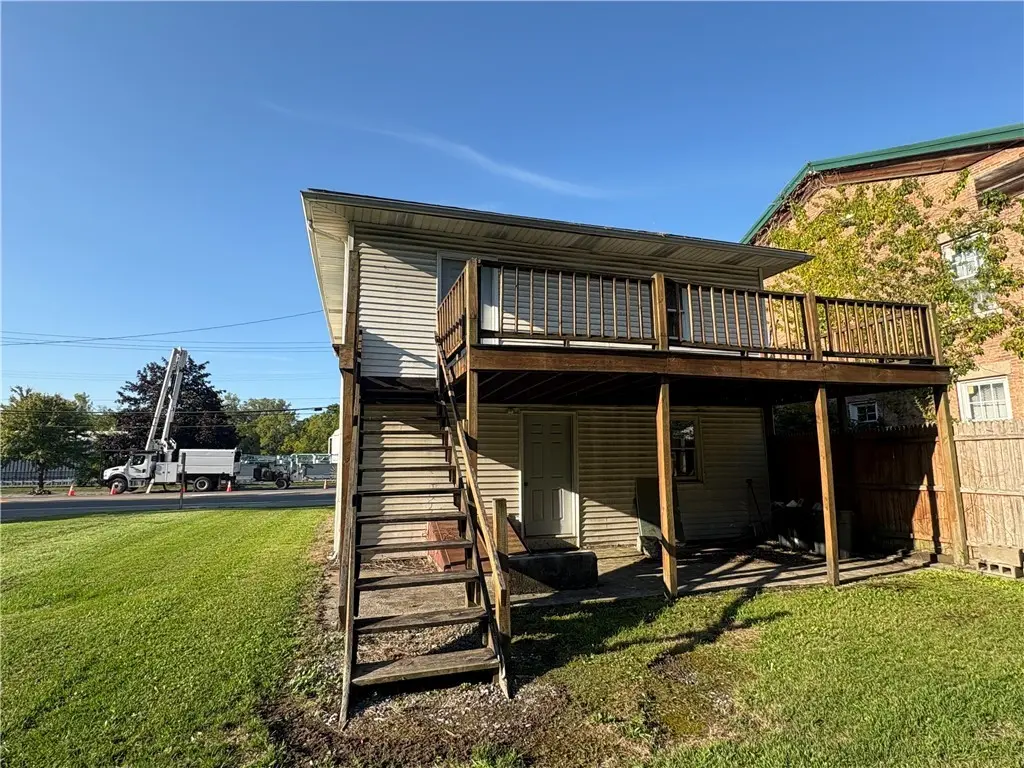
231 E Main St · Waterloo, NY
Flood risk 1/10 · Minimal
- FEMA flood zone
- X
- Chance of flooding over 30 yrs
- 0.0%
- Est. flood insurance / yr
- $473 – $860
Fire risk 1/10 · Minimal
- Est. fire insurance / yr
- $691 – $1,283
Heat risk 3/10 · Minor
- Hot days now (above 97°F)
- 7 days/yr
- Hot days in 30 yrs
- 15 days/yr
Wind risk 1/10 · Minimal
- Chance of severe wind over 30 yrs
- —
Air-quality risk 2/10 · Minimal
- Unhealthy air days now
- 0 days/yr
- Unhealthy air days in 30 yrs
- 1 days/yr
Risk factors via First Street. Map © Google.
Why this score? — see what drove the B- grade
The composite is a weighted blend of 9 inputs, each scored 0–100. Each bar is that input's sub-score; the figure is the points it added to the 100-point composite (weight × sub-score).
- Cash flow +30.0/30.0
- 1% rule +10.0/10.0
- DSCR +10.0/10.0
- ARV discount +7.5/15.0
- Livability +3.8/5.0
- Schools +3.4/10.0
- Rent growth +2.5/5.0
- Condition / age +2.5/5.0
- Appreciation +0.0/10.0
$65,000
🖨 Deal sheet (PDF) 📄 Offer letter ✓ Due diligence
Multi-family units
County records classify this as Multi-Family (2-4 Unit). Listing-text estimate: 1 unit. estimate disagrees with records
Listing remarks MLS
Welcome to 231 E. Main Street in Waterloo! This two-unit upstairs downstairs apartment building has started to take shape! Bring your vision for lots of potential for a fantastic investment property! Plumbing & electrical has been roughed in & the downstairs unit has been drywalled & ready for finishes. Inside each unit you'll find 2 bedrooms & 1 full bath with laundry hook ups & spacious closets. An open concept kitchen & living room has been designed with plumbing & electrical & areas for electric baseboard roughed in throughout! 3 new panel boxes in basement for separate utilities & an added panel for the basement! Bring your vision & don't miss out on a great opportunity!
Key facts
- 6,098 sq ft lot
- Built 1865
- Listed 72 days
Neighborhood map
What this means for you Summary
Snapshot
- This is a 4-bed/2.0-bath multifamily listed at $65k.
Deal economics
- At list price, monthly cash flow is $2k ($18k/yr) — positive.
- The deal already cash-flows at list — no discount required.
- Meets the 1% rule at list price ($3k rent vs $65k).
- Recommended offer: $61k (6.0% below list) — sets the bar for market timing.
- Cap rate 34.6% vs local median 4.8% in Waterloo — top-decile yield for the area; either an underpriced asset or a hidden risk that comps aren't pricing in. Stress-test before assuming the spread holds.
Location & tenants
- Location reads 75/100 on livability (#268 in NY, #4,240 nationally) — a middle-class / working-renter tenant base. Strengths: cost of living A+, housing A+, health & safety A+; Watch: schools C-, amenities F, commute F.
- Waterloo Central School District (town): math 37% / reading 43% proficiency, ranked #525 of 590 in NY (top 89%) — families likely to look elsewhere, expect single-tenant / working-renter base with shorter leases.
- Market conditions: 38 active listings in the ZIP; 48 units permitted in Seneca County in 2024 (0 in 5+ unit buildings).
Forward outlook
- Local home prices are declining (-3.0%/yr); year-one equity from $449 of loan paydown is wiped out by about $2k of value loss. Plan a longer hold.
- Seneca County population projected at -14% by 2050 — secular population decline; favor cash flow + early exit over multi-decade hold.
- At projected returns (-3.0% appreciation + 3.0% rent growth), your $18k cash investment doubles in ~2 years — after that, you're playing with house money.
Negotiation context
- It's been on market 72 days — a 6% lower offer ($61k) is reasonable based on typical stale-listing flexibility.
- 7 sale attempts since 4y ago with the ask held roughly flat each time — persistent listings suggest the price (not the market) is what's stuck; bring a comps-based counter.
- Current owner paid $20k; list at $65k implies a 225% gain — meaningful room to come down on a strong offer.
Risks & watch-outs
- Watch-outs: property tax is 2.8% of price; built in 1865 — expect roof / HVAC / electrical / plumbing capex.
Questions for the listing agent
- It's been on market 72 days. Have you received any prior offers? Is the seller open to a 6% concession, seller financing, or rate buy-down credit?
- Built in 1865 — when were the roof, HVAC, electrical panel, plumbing, and water heater last replaced?
- Property tax is high relative to price — has the assessment been appealed recently, and will the sale trigger a re-assessment?
- Why hasn't it sold? Are there any deal-killer items the seller is aware of (foundation, flood, title, zoning, code violations)?
- Is there a deadline driving the sale (1031 exchange, divorce, estate, relocation)? That informs how much negotiation room exists.
- What's the average days-on-market for RENTAL listings here right now (not sales)? A rising rental-DOM trend means longer vacancies and softer asking-rent achievability than the comps imply.
- What's the recent tenant-quality profile in this submarket — average credit score on applications, eviction rate, late-payment / NSF rate, and stable-employment percentage? A property-management company in the area should have these aggregated.
- How much new apartment / multifamily construction is in the pipeline within 1–3 miles? Heavy new supply (>2% of stock underway) typically softens rents 12–24 months out; light construction supports rent growth.
Investment metrics
- 1% rule
- 4.00% ✓
- Cap rate
- 34.58%
- Cash-on-cash
- 101.03%
- DSCR
- 5.50
- GRM
- 2.1
CMA / ARV
- ARV (median comp)
- $206,814
- List price
- $65,000
- Delta
- -68.57%
- Verdict
- UNDERPRICED
- Comps
- 13 within 1.0 mi
Show comp detail 1 sale within ~0.75 mi
| Address | Dist | Beds/Ba | Sqft | Sold | Price | $/sf | Match |
|---|---|---|---|---|---|---|---|
| 107 E Elizabeth St | 0.39mi | 4/2.0 | 1,989 (+1%) | 4mo | $100,000 | $50 | 77 |
Match score weights: distance 35% · size 25% · config 20% · recency 20%. Top-matched comps best support the ARV.
Projected returns pro-forma
-3.0% appreciation · 3.0% rent growth · sell at horizon
- IRR
- —
- Equity multiple
- 5.79×
- Total profit
- $87,140
- Equity at exit
- $9,692
- IRR
- —
- Equity multiple
- 12.09×
- Total profit
- $201,883
- Equity at exit
- $5,620
Cash invested: $18,200 (down + closing). Projections, not guarantees.
Landlord ↔ Tenant lean methodology
- Overall (STATE)
- 15 Strongly Tenant-Friendly
- State New York
- 15 Strongly Tenant-Friendly · D+10
- County
- — inherits STATE
- City
- — inherits STATE
ZIP-level market 13165
- Home prices YoY
- -20.7%
- Active inventory
- 38
- Price-to-rent
- 4.2×
Monthly cashflow live
- Estimated rent
- $2,600 medium interval (Pro) →
- Mortgage (P&I)
- −$341
- Tax from tax record
- −$154 /mo · $1,846/yr
- Insurance
- −$27
- HOA
- −$0
- Vacancy / Maint / Mgmt
- −$546
- Net cashflow
- $1,532
Break-even live
Sensitivity live
| Price | -10% $1,569 | -5% $1,551 | +0% $1,532 | +5% $1,514 | +10% $1,495 |
|---|---|---|---|---|---|
| Rent | -10% $1,327 | -5% $1,430 | +0% $1,532 | +5% $1,635 | +10% $1,738 |
| Rate | -1.0pp $1,565 | -0.5pp $1,549 | base $1,532 | +0.5pp $1,515 | +1.0pp $1,498 |
2-unit breakdown (identical units grouped — click to expand)
| Units | Beds | Baths | Est. rent |
|---|---|---|---|
| 2× units | 2 | 1 | $2,600 |
| #1 | 2 | 1 | $1,300 |
| #2 | 2 | 1 | $1,300 |
| Total (2 units) | $2,600 | ||
UW: 25.0% down · 7.5% · 30yr · 1.5% tax · 5.0% vac · 8.0% maint · 8.0% mgmt
Financing live
Cash to close
- Down payment
- $16,250
- Closing costs
- $1,950
- Reserves months
- —
- Total cash needed
- —
Loan-product check · same deal, 3 products live
Conventional
25% down · 7.5% · 30yr
- Down + closing
- —
- Monthly P&I
- —
- Monthly cashflow
- —
- DSCR
- —
- Eligible?
- —
Personal DTI + credit; lowest rate.
DSCR
20% down · 8.5% · 30yr
- Down + closing
- —
- Monthly P&I
- —
- Monthly cashflow
- —
- DSCR
- —
- Eligible?
- —
No personal income docs; deal must DSCR.
Hard money
10% down · 12.0% · 12mo
- Down + closing
- —
- Monthly P&I
- —
- Monthly cashflow
- —
- DSCR
- —
- Eligible?
- —
Short-term bridge; refi at stabilization.
Listing history 34 events
-
2026-06-21days on market $65,000 Active 72 DOM
-
2026-06-18days on market $65,000 Active 70 DOM
-
2026-06-17days on market $65,000 Active 69 DOM
-
2026-06-16days on market $65,000 Active 68 DOM
-
2026-06-15days on market $65,000 Active 67 DOM
-
2026-06-13days on market $65,000 Active 65 DOM
-
2026-06-12days on market $65,000 Active 64 DOM
-
2026-06-09days on market $65,000 Active 61 DOM
-
2026-06-08days on market $65,000 Active 60 DOM
-
2026-06-07days on market $65,000 Active 59 DOM
-
2026-06-07days on market $65,000 Active 58 DOM
-
2026-06-04days on market $65,000 Active 55 DOM
-
2026-06-02days on market $65,000 Active 54 DOM
-
2026-06-01days on market $65,000 Active 53 DOM
-
2026-05-31days on market $65,000 Active 52 DOM
-
2026-04-09$65,000 Active 744-char remark
Show marketing remark (744 chars)
Welcome to 231 E. Main Street in Waterloo! This two-unit upstairs downstairs apartment building has started to take shape! Bring your vision for lots of potential for a fantastic investment property! Plumbing & electrical has been roughed in & the downstairs unit has been drywalled & ready for finishes. Inside each unit you'll find 2 bedrooms & 1 full bath with laundry hook ups & spacious closets. An open concept kitchen & living room has been designed with plumbing & electrical & areas for electric baseboard roughed in throughout! 3 new panel boxes in basement for separate utilities & an added panel for the basement! Bring your vision & don't miss out on a great opportunity!
-
2026-02-10status Pending
-
2026-02-06historical
-
2026-01-22status Active
-
2026-01-22historical Active Under Contract
-
2025-11-18$65,000 Active
-
2025-11-01historical
-
2025-08-25price $65,000
-
2025-08-22price $67,000
-
2025-07-14status Active
-
2025-06-01status Pending
-
2025-03-09$70,000 Active
-
2022-06-24soldstatus $20,000
-
2022-06-23soldstatus $20,000 Closed Sale or Rented
-
2022-06-16soldstatus $20,000 Closed Sale or Rented
-
2022-04-12status Pending Sale
-
2022-04-01status Pending Sale
-
2022-02-18$35,000 Active
-
2022-02-18$35,000 Active
ⓘ Source: listings_history table (triggers on properties + properties_extension) + one-shot
backfill from property_details.listing_events for pre-trigger history.
Tax reassessment forecast NY · Partial reset (capped growth)
- Current annual tax
- $1,846 · $154/mo
- Projected year-2 tax
- $1,846 · $154/mo
- Expected delta
- $0/yr ($0/mo · 0.0%)
ⓘ Screening estimate from a state-policy table — verify with the county assessor before closing.
Climate risk First Street
- Flood 1/10 Low FEMA zone X · 0% chance over 30 yrs
- Wildfire 1/10 Low
- Heat 3/10 Moderate 7 d/yr ≥97°F today · 15 d/yr by 30 yrs out
- Wind 1/10 Low
- Air quality 2/10 Low 0 unhealthy d/yr today · 1 by 30 yrs out
Nearby sold comps map
Loading sold comps map…
Walkable amenities ~0.75 mi
Loading nearby amenities…
Taxation est. · year 1
- Rental income
- $31,200
- − Mortgage interest
- −$3,641
- − Property taxes
- −$1,846
- − Insurance
- −$325
- − Repairs & maintenance
- −$2,496
- − Management
- −$2,496
- − Depreciation
- −$1,891
- Taxable income
- $18,505
- Est. tax owed @ 24.0%
- −$4,441
- After-tax cash flow
- $13,946/yr
For passive investors: Depreciation is non-cash, so a rental often shows a tax loss while cash-flowing — sheltering income. Rental losses are passive: they offset passive income freely, and up to $25,000/yr can offset ordinary (W-2) income if you actively participate and your MAGI is under $100k (phasing out to $0 by $150k); unused losses carry forward. On sale, claimed depreciation is recaptured at up to 25%, and gains may owe capital-gains tax (a 1031 exchange can defer both). Figures are a year-1 estimate at your 24.0% rate — not tax advice; consult a CPA.
Schools (NCES district)
- District
- Waterloo Central School District
- NCES district ID
- 3600014
- Math proficiency
- 37% ▼ -9.00%
- Reading proficiency
- 43% ▲ 11.00%
- Median HH income
- $46,726
- Composite
- 34.16/100
- National rank
- #5278
- State rank
- #525 of 590 in NY
Livability — Waterloo
- Score
- 75/100
- State rank
- #268
- US rank
- #4240
Category grades
Schools grade is shown separately in the Schools card above.
Census & demographics
- Census place
- Waterloo, NY
- Population (ZIP)
- 9,429
Population outlook (Seneca County) Hauer SSP2
- Today (2025)
- 33,457 people
- By 2030
- 32,540 · -2.7%
- By 2040
- 30,680 · -8.3%
- By 2050
- 28,875 · -13.7%
- By 2075
- 24,757 · -26.0%
- By 2100
- 19,591 · -41.4%
Race, ethnicity, and origin ACS 2023
- Neighborhood character
- Predominantly White (89%)
- Race & ethnicity
- White 89% Two or more races 8% Hispanic / Latino 6% Black 1%
- Hispanic origin (detail)
- Mexican 1% Puerto Rican 2%
- Common ancestry
- Slovak 4% Iranian 3% Lithuanian 3%
- Foreign-born
- 4% · Canada, Jamaica
- Languages at home
- 93% English-only · Spanish 4% German/W. Germanic 2%
Political lean MEDSL · Seneca
- 2024 margin
- R (+11.8) · D 44.1% · R 55.9%
- 2008→2024 swing
- -14.4pp toward R · 2008: 2.6pp · 2024: -11.8pp
- All cycles
- 2024: R+11.8 2020: R+9.1 2016: R+12.1 2012: D+9.2 2008: D+2.6
Not yet ingested
- Civics
- —
Market trends
- HPI YoY
- ▼ -67.17%
- Current HPI
- 257.272
- Rent YoY
- —
- Metro
- —
- State GDP YoY
- ▲ 2.60%
- F500 in state
- 92
Industry mix (Fortune 500 HQ in NY)
| Industry | F500 HQs | Revenue |
|---|---|---|
| Financial Services | 10 | $950B |
|
||
| Consumer Goods | 9 | $162B |
|
||
| Insurance | 4 | $225B |
|
||
| Telecommunications | 2 | $144B |
|
||
| Pharmaceuticals | 2 | $112B |
|
||
| Media / Entertainment | 2 | $69B |
|
||
Price history
+85.7% since first listed19 events — show timeline
- 2026-04-09 Listed $65,000 UNYREIS
- 2026-02-10 Pending — UNYREIS
- 2026-02-06 Listing Removed — UNYREIS
- 2026-01-22 Relisted — UNYREIS
- 2026-01-22 Contingent — UNYREIS
- 2025-11-18 Listed $65,000 UNYREIS
- 2025-11-01 Listing Removed — UNYREIS
- 2025-08-25 Price Changed $65,000 UNYREIS
- 2025-08-22 Price Changed $67,000 UNYREIS
- 2025-07-14 Relisted — UNYREIS
- 2025-06-01 Pending — UNYREIS
- 2025-03-09 Listed $70,000 UNYREIS
- 2022-06-24 Sold (Public Records) $20,000 Public Records
- 2022-06-23 Sold (MLS) $20,000 UNYREIS
- 2022-06-16 Sold (MLS) $20,000 UNYREIS
- 2022-04-12 Pending — UNYREIS
- 2022-04-01 Pending — UNYREIS
- 2022-02-18 Listed $35,000 UNYREIS
- 2022-02-18 Listed $35,000 UNYREIS
Property tax history
+1.3%/yrLatest (2025): $1,846 · +5.3% YoY. Source: county tax records.
Cash-flow waterfall
monthlySold comps — $/sqft
last 12 mo · ≤1 miLoading sold comps…