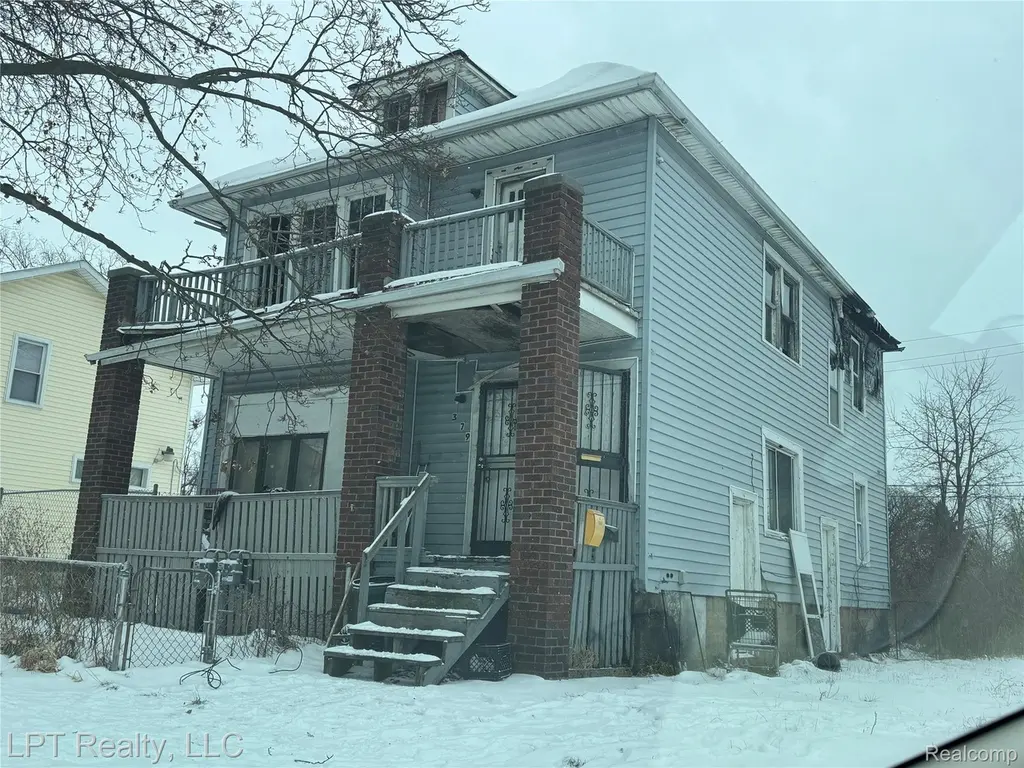
379 Florence St · Highland Park, MI
Flood risk 1/10 · Minimal
- FEMA flood zone
- X (unshaded)
- Chance of flooding over 30 yrs
- 0.0%
- Est. flood insurance / yr
- $507 – $1,088
Fire risk 1/10 · Minimal
- Est. fire insurance / yr
- $784 – $1,456
Heat risk 3/10 · Minor
- Hot days now (above 97°F)
- 7 days/yr
- Hot days in 30 yrs
- 14 days/yr
Wind risk 2/10 · Minimal
- Chance of severe wind over 30 yrs
- —
Air-quality risk 4/10 · Minor
- Unhealthy air days now
- 4 days/yr
- Unhealthy air days in 30 yrs
- 6 days/yr
Risk factors via First Street. Map © Google.
Why this score? — see what drove the D+ grade
The composite is a weighted blend of 9 inputs, each scored 0–100. Each bar is that input's sub-score; the figure is the points it added to the 100-point composite (weight × sub-score).
- Cash flow +15.0/30.0
- ARV discount +7.5/15.0
- 1% rule +5.0/10.0
- DSCR +5.0/10.0
- Schools +5.0/10.0
- Livability +3.7/5.0
- Rent growth +2.5/5.0
- Condition / age +2.5/5.0
- Appreciation +0.0/10.0
$25,000
🖨 Deal sheet 📄 Offer letter ✓ Due diligence
Listing remarks MLS
Investor special offering a value-add opportunity in Hazel Park. Sale includes 379, 381, and 383 Florence. The main structure at 379 & 381 Florence is a two-unit upper/lower duplex totaling approximately 1,932 square feet with a full basement. The property is in need of repairs and is being sold as-is, making it well-suited for investors seeking renovation, rental repositioning, or long-term investment potential. 383 Florence is a separate vacant lot located directly adjacent to the duplex and is included in the list price, offering additional flexibility subject to buyer’s due diligence and local approvals. Buyer must assume any back taxes/water at time of closing. Buyer to verify all information including square footage, lot dimensions, zoning, and future use. Cash only financing preferred.
Key facts
- Separate vacant lot
- Full basement
- Two-unit duplex
Tags
Neighborhood map
What this means for you Summary
Snapshot
- This is a 2-bed/2.0-bath single-family listed at $25k.
Deal economics
- At list price, monthly cash flow is $844 ($10k/yr) — positive.
- The deal already cash-flows at list — no discount required.
- Meets the 1% rule at list price ($1k rent vs $25k).
- Recommended offer: $22k (12.0% below list) — sets the bar for market timing.
- Cap rate 46.8% vs local median 14.2% in Highland Park — top-decile yield for the area; either an underpriced asset or a hidden risk that comps aren't pricing in. Stress-test before assuming the spread holds.
Location & tenants
- Location reads 73/100 on livability (#214 in MI) — a middle-class / working-renter tenant base. Strengths: commute A+, cost of living A+, housing A+; Watch: schools F, crime F, employment F.
- Market conditions: 216 active listings in the ZIP; 12 comparable units currently listed for rent nearby; rentals lingering (median 44d on market — plan ~5-8 weeks vacancy on turnover, expect pricing pressure); 50% of comp listings sitting > 30 days — soft ceiling on asking rent; lower-income renter base — watch delinquency; 2,639 units permitted in Wayne County in 2024 (1,216 in 5+ unit buildings).
- This rent runs 41% of the median local income ($38k/yr) — at the standard rent-burdened threshold; future hikes will face affordability resistance.
Forward outlook
- Local home prices are declining (-3.0%/yr); year-one equity from $173 of loan paydown is wiped out by about $750 of value loss. Plan a longer hold.
- Wayne County population projected at -17% by 2050 — secular population decline; favor cash flow + early exit over multi-decade hold.
- At projected returns (-3.0% appreciation + 3.0% rent growth), your $7k cash investment doubles in ~1 year — after that, you're playing with house money.
Negotiation context
- It's been on market 177 days — a 12% lower offer ($22k) is reasonable based on typical stale-listing flexibility.
- 3 sale attempts since 19y ago with the ask held roughly flat each time — persistent listings suggest the price (not the market) is what's stuck; bring a comps-based counter.
- Current owner paid $700; list at $25k implies a 3471% gain — meaningful room to come down on a strong offer.
Risks & watch-outs
- Watch-outs: built in 1932 — expect roof / HVAC / electrical / plumbing capex.
Questions for the listing agent
- It's been on market 177 days. Have you received any prior offers? Is the seller open to a 12% concession, seller financing, or rate buy-down credit?
- Built in 1932 — when were the roof, HVAC, electrical panel, plumbing, and water heater last replaced?
- Why hasn't it sold? Are there any deal-killer items the seller is aware of (foundation, flood, title, zoning, code violations)?
- Is there a deadline driving the sale (1031 exchange, divorce, estate, relocation)? That informs how much negotiation room exists.
- Schools are F-rated, which usually means shorter tenancies and higher turnover. Who's the typical renter profile here, and what's been the actual vacancy rate?
- Crime grade is F in this area — have there been break-ins, vandalism, or insurance claims at this property in the last 3 years? What carrier currently insures it and at what premium?
- The area grade is low — what's the realistic commute time and amenity access for the typical tenant pool here? Any planned neighborhood developments (good or bad) we should know about?
- What's the average days-on-market for RENTAL listings here right now (not sales)? A rising rental-DOM trend means longer vacancies and softer asking-rent achievability than the comps imply.
- What's the recent tenant-quality profile in this submarket — average credit score on applications, eviction rate, late-payment / NSF rate, and stable-employment percentage? A property-management company in the area should have these aggregated.
- How much new for-sale + rental construction is in the pipeline within 1–3 miles? Heavy new supply typically softens prices + rents 12–24 months out; constrained supply supports both.
Investment metrics
- 1% rule
- 5.23% ✓
- Cap rate
- 46.80%
- Cash-on-cash
- 144.66%
- DSCR
- 7.44
- GRM
- 1.6
CMA / ARV
- ARV (median comp)
- $151,977
- List price
- $25,000
- Delta
- -83.55%
- Verdict
- UNDERPRICED
- Comps
- 20 within 1.0 mi
Show comp detail 12 sales within ~0.75 mi
| Address | Dist | Beds/Ba | Sqft | Sold | Price | $/sf | Match |
|---|---|---|---|---|---|---|---|
| 16125 Linwood St | 0.55mi | 3/1.5 (+1) | 1,927 (-0%) | 1mo | $178,900 | $93 | 66 |
| 161 Eason St | 0.45mi | 3/2.0 (+1) | 1,848 (-4%) | 8mo | $138,000 | $75 | 60 |
| 16239 La Salle Ave | 0.42mi | 3/2.5 (+1) | 1,783 (-8%) | 2mo | $240,000 | $135 | 59 |
| 16219 Normandy St | 0.48mi | 3/1.5 (+1) | 1,860 (-4%) | 10mo | $162,000 | $87 | 56 |
| 123 Florence St | 0.49mi | 3/1.5 (+1) | 1,900 (-2%) | 14mo | $92,500 | $49 | 56 |
| 16147 Normandy St | 0.49mi | 3/1.5 (+1) | 2,082 (+8%) | 2mo | $189,000 | $91 | 55 |
| 16844 Inverness St | 0.34mi | 3/2.0 (+1) | 2,130 (+10%) | 13mo | $198,000 | $93 | 51 |
| 15745 Princeton St | 0.68mi | 3/1.0 (+1) | 1,994 (+3%) | 10mo | $52,000 | $26 | 46 |
| 16532 Parkside St | 0.69mi | 3/1.5 (+1) | 2,097 (+8%) | 3mo | $223,850 | $107 | 44 |
| 163 Moss St | 0.48mi | 3/1.0 (+1) | 1,678 (-13%) | 4mo | $191,000 | $114 | 44 |
| 83 Midland St | 0.69mi | 3/1.5 (+1) | 1,664 (-14%) | 1mo | $150,000 | $90 | 37 |
| 44 Grove St | 0.53mi | 3/1.0 (+1) | 1,646 (-15%) | 10mo | $8,000 | $5 | 34 |
Match score weights: distance 35% · size 25% · config 20% · recency 20%. Top-matched comps best support the ARV.
Projected returns pro-forma
-3.0% appreciation · 3.0% rent growth · sell at horizon
- IRR
- —
- Equity multiple
- 8.10×
- Total profit
- $49,725
- Equity at exit
- $3,728
- IRR
- —
- Equity multiple
- 17.09×
- Total profit
- $112,628
- Equity at exit
- $2,162
Cash invested: $7,000 (down + closing). Projections, not guarantees.
Landlord ↔ Tenant lean methodology
- Overall (STATE)
- 62 Landlord-Friendly
- State Michigan
- 62 Landlord-Friendly · EVEN
- County
- — inherits STATE
- City
- — inherits STATE
ZIP-level market 48203
- Home prices YoY
- -23.3%
- Active inventory
- 216
- Price-to-rent
- 1.6×
Monthly cashflow live
- Estimated rent
- $1,307 high interval (Pro) →
- Mortgage (P&I)
- −$131
- Tax from tax record
- −$47 /mo · $569/yr
- Insurance
- −$10
- HOA
- −$0
- Vacancy / Maint / Mgmt
- −$275
- Net cashflow
- $844
Break-even live
UW: 25.0% down · 7.5% · 30yr · 1.5% tax · 5.0% vac · 8.0% maint · 8.0% mgmt
Financing live
Cash to close
- Down payment
- $6,250
- Closing costs
- $750
- Reserves months
- —
- Total cash needed
- —
Loan-product check · same deal, 3 products live
Conventional
25% down · 7.5% · 30yr
- Down + closing
- —
- Monthly P&I
- —
- Monthly cashflow
- —
- DSCR
- —
- Eligible?
- —
Personal DTI + credit; lowest rate.
DSCR
20% down · 8.5% · 30yr
- Down + closing
- —
- Monthly P&I
- —
- Monthly cashflow
- —
- DSCR
- —
- Eligible?
- —
No personal income docs; deal must DSCR.
Hard money
10% down · 12.0% · 12mo
- Down + closing
- —
- Monthly P&I
- —
- Monthly cashflow
- —
- DSCR
- —
- Eligible?
- —
Short-term bridge; refi at stabilization.
Rent comps 12 comps
| Address | Beds | Baths | Sqft | Rent | $/sqft | DOM | Units | Dist |
|---|---|---|---|---|---|---|---|---|
| 326 Eason St Highland Park, MI | 3.0 | 1.0 | 1256 | $1,300 | $1.04 | 17d | 1 | 0.18mi |
| 2521 W McNichols Rd Unit B2 Detroit, MI | 2.0 | 1.0 | 1300 | $1,250 | $0.96 | 43d | 1 | 0.51mi |
| 885 Covington Dr Unit 201 Highland Park, MI | 2.0 | 2.0 | 1350 | $1,695 | $1.26 | 43d | 1 | 0.55mi |
| 17550 2nd Ave Detroit, MI | 2.0 | 1.0 | 1350 | $1,150 | $0.85 | 17d | 1 | 0.63mi |
| 16834 Fairfield St Detroit, MI | 2.0 | 1.0 | 1516 | $1,363 | $0.90 | 24d | 1 | 0.88mi |
| 2286 Kendall St Detroit, MI | 1.0 | 1.0 | 1689 | $500 | $0.30 | 43d | 1 | 0.97mi |
| 574 W Golden Gate Highland Park, MI | 3.0 | 1.0 | 1315 | $1,300 | $0.99 | 43d | 1 | 1.18mi |
| 16582 Santa Rosa Dr Detroit, MI | 3.0 | 1.0 | 1314 | $1,399 | $1.06 | 17d | 1 | 1.26mi |
| 17596 Santa Rosa Dr Detroit, MI | 2.0 | 1.0 | 1350 | $1,195 | $0.89 | 43d | 1 | 1.42mi |
| 17596 Santa Rosa Dr Unit 2 Detroit, MI | 2.0 | 1.0 | 1350 | $1,195 | $0.89 | 24d | 1 | 1.43mi |
| 17163 Prairie St Unit 1B Detroit, MI | 3.0 | 1.5 | 1317 | $1,350 | $1.03 | 43d | 1 | 1.45mi |
| 16255 Lilac St Detroit, MI | 3.0 | 1.0 | 1312 | $1,394 | $1.06 | 17d | 1 | 1.50mi |
Listing history 18 events
-
2026-06-18days on market $25,000 Active 177 DOM
-
2026-06-17days on market $25,000 Active 176 DOM
-
2026-06-16days on market $25,000 Active 175 DOM
-
2026-06-15days on market $25,000 Active 174 DOM
-
2026-06-13days on market $25,000 Active 172 DOM
-
2026-06-09days on market $25,000 Active 168 DOM
-
2026-06-08days on market $25,000 Active 167 DOM
-
2026-06-07days on market $25,000 Active 166 DOM
-
2026-06-04days on market $25,000 Active 163 DOM
-
2026-06-03days on market $25,000 Active 162 DOM
-
2026-06-02days on market $25,000 Active 161 DOM
-
2026-06-01days on market $25,000 Active 160 DOM
-
2026-05-31days on market $25,000 Active 159 DOM
-
2025-12-23$25,000 Active 815-char remark
Show marketing remark (809 chars)
Investor special offering a value-add opportunity in Hazel Park. Sale includes 379, 381, and 383 Florence. The main structure at 379 & 381 Florence is a two-unit upper/lower duplex totaling approximately 1,932 square feet with a full basement. The property is in need of repairs and is being sold as-is, making it well-suited for investors seeking renovation, rental repositioning, or long-term investment potential. 383 Florence is a separate vacant lot located directly adjacent to the duplex and is included in the list price, offering additional flexibility subject to buyer's due diligence and local approvals. Buyer must assume any back taxes/water at time of closing. Buyer to verify all information including square footage, lot dimensions, zoning, and future use. Cash only financing preferred.
-
2025-12-23$25,000 Active 809-char remark
Show marketing remark (809 chars)
Investor special offering a value-add opportunity in Hazel Park. Sale includes 379, 381, and 383 Florence. The main structure at 379 & 381 Florence is a two-unit upper/lower duplex totaling approximately 1,932 square feet with a full basement. The property is in need of repairs and is being sold as-is, making it well-suited for investors seeking renovation, rental repositioning, or long-term investment potential. 383 Florence is a separate vacant lot located directly adjacent to the duplex and is included in the list price, offering additional flexibility subject to buyer's due diligence and local approvals. Buyer must assume any back taxes/water at time of closing. Buyer to verify all information including square footage, lot dimensions, zoning, and future use. Cash only financing preferred.
-
2008-07-17soldstatus $700
-
2008-05-06historical
-
2007-10-20$1,000
ⓘ Source: listings_history table (triggers on properties + properties_extension) + one-shot
backfill from property_details.listing_events for pre-trigger history.
Tax reassessment forecast MI · Partial reset (capped growth)
- Current annual tax
- $569 · $47/mo
- Projected year-2 tax
- $569 · $47/mo
- Expected delta
- $0/yr ($0/mo · 0.0%)
ⓘ Screening estimate from a state-policy table — verify with the county assessor before closing.
Climate risk First Street
- Flood 1/10 Low FEMA zone X (unshaded) · 0% chance over 30 yrs
- Wildfire 1/10 Low
- Heat 3/10 Moderate 7 d/yr ≥97°F today · 14 d/yr by 30 yrs out
- Wind 2/10 Low
- Air quality 4/10 Moderate 4 unhealthy d/yr today · 6 by 30 yrs out
Nearby sold comps map
Loading sold comps map…
Walkable amenities ~0.75 mi
Loading nearby amenities…
Taxation est. · year 1
- Rental income
- $15,689
- − Mortgage interest
- −$1,400
- − Property taxes
- −$569
- − Insurance
- −$125
- − Repairs & maintenance
- −$1,255
- − Management
- −$1,255
- − Depreciation
- −$727
- Taxable income
- $10,357
- Est. tax owed @ 24.0%
- −$2,486
- After-tax cash flow
- $7,641/yr
For passive investors: Depreciation is non-cash, so a rental often shows a tax loss while cash-flowing — sheltering income. Rental losses are passive: they offset passive income freely, and up to $25,000/yr can offset ordinary (W-2) income if you actively participate and your MAGI is under $100k (phasing out to $0 by $150k); unused losses carry forward. On sale, claimed depreciation is recaptured at up to 25%, and gains may owe capital-gains tax (a 1031 exchange can defer both). Figures are a year-1 estimate at your 24.0% rate — not tax advice; consult a CPA.
Schools (NCES district)
No district data.
Livability — Highland Park
- Score
- 73/100
- State rank
- #214
- US rank
- #5271
Category grades
Schools grade is shown separately in the Schools card above.
Census & demographics
- Census place
- Highland Park, MI
- County
- Wayne County · 1,562,939 people
- City population
- 572,865
- Metro
- Detroit-Warren-Dearborn, MI
- Population (ZIP)
- 20,049
- Household income
- $38,404
- Rent vs Own
- Severe rent burden
- 1192.0
Population outlook (Wayne County) Hauer SSP2
- Today (2025)
- 1,675,273 people
- By 2030
- 1,620,300 · -3.3%
- By 2040
- 1,502,341 · -10.3%
- By 2050
- 1,384,039 · -17.4%
- By 2075
- 1,124,592 · -32.9%
- By 2100
- 881,193 · -47.4%
Race, ethnicity, and origin ACS 2023
- Neighborhood character
- Predominantly Black (85%)
- Race & ethnicity
- Black 85% White 8% Two or more races 5% Hispanic / Latino 2%
- Common ancestry
- Lithuanian 1%
- Foreign-born
- 2% · Canada
- Languages at home
- 95% English-only · Spanish 3% French/Haitian/Cajun 1%
Political lean MEDSL · Wayne
- 2024 margin
- Strong D (+29.0) · D 62.7% · R 33.7% · Other 3.6%
- 2008→2024 swing
- -20.5pp toward R · 2008: 49.5pp · 2024: 29.0pp
- All cycles
- 2024: D+29.0 2020: D+38.1 2016: D+37.3 2012: D+46.9 2008: D+49.5
Not yet ingested
- Civics
- —
Market trends
- HPI YoY
- ▼ -90.13%
- Current HPI
- 297.0176
- Rent YoY
- —
- Metro
- Detroit-Warren-Dearborn, MI
- State GDP YoY
- ▲ 1.37%
- F500 in state
- 28
Industry mix (Fortune 500 HQ in MI)
| Industry | F500 HQs | Revenue |
|---|---|---|
| Automotive Parts | 3 | $48B |
|
||
| Automotive | 2 | $372B |
|
||
| Chemicals | 1 | $45B |
|
||
| Automotive Retail | 1 | $29B |
|
||
| Healthcare / Medical Devices | 1 | $23B |
|
||
| Automotive Technology | 1 | $20B |
|
||
Price history
+2400.0% since first listed5 events — show timeline
- 2025-12-23 Listed $25,000 MiRealSource-MiMLS
- 2025-12-23 Listed $25,000 REALCOMP
- 2008-07-17 Sold (MLS) $700 MiRealSource-MiMLS
- 2008-05-06 Listing Removed — MiRealSource-MiMLS
- 2007-10-20 Listed $1,000 MiRealSource-MiMLS
Property tax history
-6.2%/yrLatest (2025): $569 · -21.7% YoY. Source: county tax records.
Cash-flow waterfall
monthlySold comps — $/sqft
last 12 mo · ≤1 miLoading sold comps…