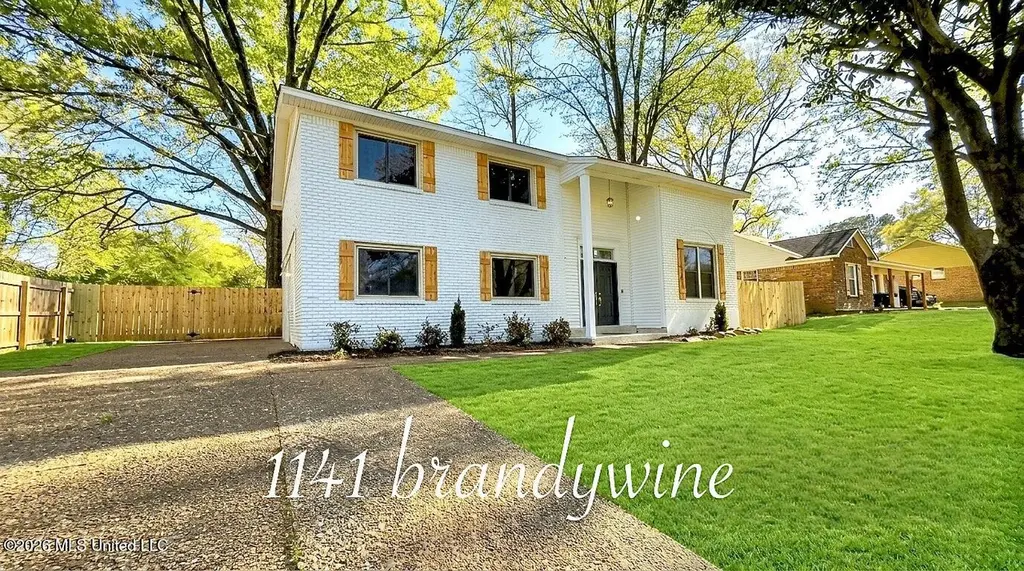
1141 Brandywine Dr · Southaven, MS
Flood risk 1/10 · Minimal
- FEMA flood zone
- X (unshaded)
- Chance of flooding over 30 yrs
- 0.0%
- Est. flood insurance / yr
- $507 – $1,088
Fire risk 1/10 · Minimal
- Est. fire insurance / yr
- $1,241 – $2,305
Heat risk 6/10 · Moderate
- Hot days now (above 109°F)
- 7 days/yr
- Hot days in 30 yrs
- 21 days/yr
Wind risk 4/10 · Minor
- Chance of severe wind over 30 yrs
- 20.0%
Air-quality risk 2/10 · Minimal
- Unhealthy air days now
- 2 days/yr
- Unhealthy air days in 30 yrs
- 2 days/yr
Risk factors via First Street. Map © Google.
Why this score? — see what drove the F grade
The composite is a weighted blend of 9 inputs, each scored 0–100. Each bar is that input's sub-score; the figure is the points it added to the 100-point composite (weight × sub-score).
- ARV discount +8.1/15.0
- Cash flow +6.8/30.0
- Schools +4.0/10.0
- Rent growth +3.3/5.0
- Livability +3.2/5.0
- Condition / age +2.5/5.0
- DSCR +1.0/10.0
- 1% rule +0.9/10.0
- Appreciation +0.0/10.0
$286,995
🖨 Deal sheet (PDF) 📄 Offer letter ✓ Due diligence
Listing remarks MLS
Move in ready beautiful renovated house with 4 beds and 2 1/2 bath~fresh paint inside out~ new floor~ updated bathrooms~ updated kitchen with new SSA and counters~ new hardware and light fixtures ~updated windows. new privacy leveled fenced backyard. Must check it out!!
Key facts
- Updated windows
- Updated bathrooms
- Updated kitchen
Tags
Neighborhood map
What this means for you Summary
Snapshot
- This is a 4-bed/2.5-bath single-family listed at $287k.
Deal economics
- At list price, monthly cash flow is $-447 ($-5k/yr) — negative.
- To cash-flow at today's rent, offer at most $208k (27.5% below list).
- To meet the 1% rule (rent ≥ 1% of price), the offer needs to be $169k (41.2% below list).
- Recommended offer: $169k (41.2% below list) — sets the bar for 1% rule.
Location & tenants
- Location reads 65/100 on livability (#107 in MS) — a middle-class / working-renter tenant base. Strengths: cost of living A+, housing A+; Watch: amenities F, commute F, health & safety F.
- Desoto County School District (suburban): math 48% / reading 42% proficiency, ranked #20 of 130 in MS (top 15%) — families likely to look elsewhere, expect single-tenant / working-renter base with shorter leases.
- Zoned schools: Southaven Intermediate School (math 24% / reading 30%, grade F, #203 of 375 statewide, top 56%, 990 students, 100% FRL); Southaven Middle School (math 33% / reading 25%, grade F, #90 of 179 statewide, top 52%, 1,456 students, 100% FRL); Southaven High School (math 26% / reading 35%, grade F, #88 of 197 statewide, top 45%, 1,850 students, 100% FRL) — zoned schools average 100% FRL vs 43% district-wide (56 pts higher); higher-poverty schools than district average — tighter screening recommended.
- Zoned-school proficiency averages 29% at this address vs 45% district-wide (-16 pts) — the specific schools serving this property underperform the Desoto County School District average; the district grade overstates school quality for this exact location.
- Market conditions: Rents rising (+3.2%/yr); 196 active listings in the ZIP; 35 comparable units currently listed for rent nearby; rentals at typical pace (median 25d on market — plan ~3-4 weeks tenant-placement turnaround); 1,155 units permitted in DeSoto County in 2024 (0 in 5+ unit buildings).
- This rent runs 33% of the median local income ($62k/yr) — at the standard rent-burdened threshold; future hikes will face affordability resistance.
Forward outlook
- Local home prices are declining (-3.0%/yr); year-one equity from $2k of loan paydown is wiped out by about $9k of value loss. Plan a longer hold.
- DeSoto County population projected at +33% by 2050 — long-run rental-demand tailwind backs the buy-and-hold thesis.
Negotiation context
- It's been on market 41 days — a 3% lower offer ($278k) is reasonable based on typical stale-listing flexibility.
- 3 sale attempts since 27y ago with the ask held roughly flat each time — persistent listings suggest the price (not the market) is what's stuck; bring a comps-based counter.
Risks & watch-outs
- Climate carrying-cost: extreme-heat days projected 7→21/yr by 2055 (HVAC capex compounding) — expect insurance premiums to compound above CPI over the hold.
Questions for the listing agent
- What do current leases actually rent for vs. the listed asking? Can we see a recent rent roll and the last 12 months of T-12 income?
- It's been on market 41 days. Have you received any prior offers? Is the seller open to a 41% concession, seller financing, or rate buy-down credit?
- Built in 1965 — when were the roof, HVAC, electrical panel, plumbing, and water heater last replaced?
- Is there a deadline driving the sale (1031 exchange, divorce, estate, relocation)? That informs how much negotiation room exists.
- Schools are D-rated, which usually means shorter tenancies and higher turnover. Who's the typical renter profile here, and what's been the actual vacancy rate?
- The area grade is low — what's the realistic commute time and amenity access for the typical tenant pool here? Any planned neighborhood developments (good or bad) we should know about?
- What's the average days-on-market for RENTAL listings here right now (not sales)? A rising rental-DOM trend means longer vacancies and softer asking-rent achievability than the comps imply.
- What's the recent tenant-quality profile in this submarket — average credit score on applications, eviction rate, late-payment / NSF rate, and stable-employment percentage? A property-management company in the area should have these aggregated.
- How much new for-sale + rental construction is in the pipeline within 1–3 miles? Heavy new supply typically softens prices + rents 12–24 months out; constrained supply supports both.
Investment metrics
- 1% rule
- 0.59% ✗
- Cap rate
- 4.42%
- Cash-on-cash
- -6.68%
- DSCR
- 0.70
- GRM
- 14.2
CMA / ARV
- ARV (median comp)
- $291,070
- List price
- $286,995
- Delta
- -1.40%
- Verdict
- FAIR
- Comps
- 20 within 1.0 mi
Show comp detail 12 sales within ~0.75 mi
| Address | Dist | Beds/Ba | Sqft | Sold | Price | $/sf | Match |
|---|---|---|---|---|---|---|---|
| 1384 Whitworth Cv | 0.35mi | 3/1.5 (-1) | 1,236 (-4%) | 8mo | $199,900 | $162 | 60 |
| 1366 Carriage View Ln | 0.73mi | 3/2.0 (-1) | 1,290 (-0%) | 1mo | $218,000 | $169 | 58 |
| 1455 Town And Country Dr | 0.63mi | 3/1.0 (-1) | 1,279 (-1%) | 9mo | $162,000 | $127 | 51 |
| 1500 Vicksburg Dr | 0.59mi | 3/1.5 (-1) | 1,169 (-10%) | 1mo | $209,000 | $179 | 47 |
| 1309 Staunton Dr | 0.51mi | 4/2.0 | 1,448 (+12%) | 10mo | $160,000 | $110 | 46 |
| 746 Halifax Cv | 0.50mi | 3/1.5 (-1) | 1,400 (+8%) | 10mo | $220,000 | $157 | 46 |
| 7887 S Chesterfield Dr | 0.73mi | 3/2.0 (-1) | 1,340 (+4%) | 10mo | $239,900 | $179 | 44 |
| 7966 S Chesterfield Dr | 0.66mi | 3/2.5 (-1) | 1,400 (+8%) | 8mo | $165,000 | $118 | 44 |
| 1818 Whitehead Dr | 0.70mi | 3/1.0 (-1) | 1,197 (-8%) | 2mo | $165,000 | $138 | 43 |
| 1518 Town And Country Dr | 0.69mi | 3/1.0 (-1) | 1,166 (-10%) | 1mo | $165,000 | $142 | 40 |
| 1135 Claiborne Dr | 0.54mi | 3/2.0 (-1) | 1,488 (+15%) | 8mo | $220,000 | $148 | 36 |
| 1582 Vicksburg Dr | 0.65mi | 3/1.5 (-1) | 1,131 (-13%) | 5mo | $150,000 | $133 | 35 |
Match score weights: distance 35% · size 25% · config 20% · recency 20%. Top-matched comps best support the ARV.
Projected returns pro-forma
-3.0% appreciation · 3.2% rent growth · sell at horizon
- IRR
- -27.7%
- Equity multiple
- 0.07×
- Total profit
- $-74,751
- Equity at exit
- $42,792
- IRR
- -25.8%
- Equity multiple
- -0.25×
- Total profit
- $-100,773
- Equity at exit
- $24,814
Cash invested: $80,359 (down + closing). Projections, not guarantees.
Landlord ↔ Tenant lean methodology
- Overall (STATE)
- 90 Strongly Landlord-Friendly
- State Mississippi
- 90 Strongly Landlord-Friendly · R+11
- County
- — inherits STATE
- City
- — inherits STATE
ZIP-level market 38671
- Home prices YoY
- -18.2%
- Rents YoY
- 3.2%
- Active inventory
- 196
- Price-to-rent
- 14.2×
Monthly cashflow live
- Estimated rent
- $1,688 high interval (Pro) →
- Mortgage (P&I)
- −$1,505
- Tax from tax record
- −$156 /mo · $1,877/yr
- Insurance
- −$120
- HOA
- −$0
- Vacancy / Maint / Mgmt
- −$355
- Net cashflow
- $-447
Break-even live
Sensitivity live
| Price | -10% $-285 | -5% $-366 | +0% $-447 | +5% $-529 | +10% $-610 |
|---|---|---|---|---|---|
| Rent | -10% $-581 | -5% $-514 | +0% $-447 | +5% $-381 | +10% $-314 |
| Rate | -1.0pp $-303 | -0.5pp $-374 | base $-447 | +0.5pp $-522 | +1.0pp $-597 |
UW: 25.0% down · 7.5% · 30yr · 1.5% tax · 5.0% vac · 8.0% maint · 8.0% mgmt
Financing live
Cash to close
- Down payment
- $71,749
- Closing costs
- $8,610
- Reserves months
- —
- Total cash needed
- —
Loan-product check · same deal, 3 products live
Conventional
25% down · 7.5% · 30yr
- Down + closing
- —
- Monthly P&I
- —
- Monthly cashflow
- —
- DSCR
- —
- Eligible?
- —
Personal DTI + credit; lowest rate.
DSCR
20% down · 8.5% · 30yr
- Down + closing
- —
- Monthly P&I
- —
- Monthly cashflow
- —
- DSCR
- —
- Eligible?
- —
No personal income docs; deal must DSCR.
Hard money
10% down · 12.0% · 12mo
- Down + closing
- —
- Monthly P&I
- —
- Monthly cashflow
- —
- DSCR
- —
- Eligible?
- —
Short-term bridge; refi at stabilization.
Rent comps 35 comps
| Address | Beds | Baths | Sqft | Rent | $/sqft | DOM | Units | Dist |
|---|---|---|---|---|---|---|---|---|
| 8694 Yorktown Dr Southaven, MS | 3.0 | 2.0 | 1556 | $1,703 | $1.09 | 45d | 1 | 0.18mi |
| 1344 Brandywine Dr Southaven, MS | 4.0 | 2.0 | 1473 | $1,595 | $1.08 | 13d | 1 | 0.22mi |
| 842 Farmington Dr N Southaven, MS | 3.0 | 2.0 | 1400 | $1,595 | $1.14 | 5d | 1 | 0.31mi |
| 1416 Moss Point Dr Southaven, MS | 3.0 | 1.0 | 1197 | $1,533 | $1.28 | 45d | 1 | 0.36mi |
| 1319 Stateline Rd W Southaven, MS | 3.0 | 1.5 | 1189 | $1,395 | $1.17 | 5d | 1 | 0.44mi |
| 1449 Ticonderoga Dr Southaven, MS | 4.0 | 1.5 | 1447 | $1,623 | $1.12 | 25d | 1 | 0.45mi |
| 8282 Fayette Cv Southaven, MS | 3.0 | 1.5 | 1297 | $1,545 | $1.19 | 16d | 1 | 0.50mi |
| 1296 Vicksburg Dr Southaven, MS | 3.0 | 1.0 | 1000 | $1,250 | $1.25 | 25d | 1 | 0.51mi |
| 1699 Whitehead Dr Southaven, MS | 3.0 | 1.0 | 1000 | $1,195 | $1.20 | 45d | 1 | 0.56mi |
| 4896 Lochinvar Dr Southaven, MS | 3.0 | 1.5 | 1112 | $1,081 | $0.97 | 22d | 1 | 0.57mi |
| 5572 Lochinvar Dr Southaven, MS | 3.0 | 1.0 | 1065 | $1,090 | $1.02 | 45d | 1 | 0.57mi |
| 8297 Baldwyn Cv Southaven, MS | 3.0 | 1.0 | 1065 | $1,323 | $1.24 | 25d | 1 | 0.58mi |
| 1210 Rasco Rd W Southaven, MS | 3.0 | 2.0 | 1638 | $1,695 | $1.03 | 5d | 1 | 0.58mi |
| 8328 Dottley Dr Southaven, MS | 3.0 | 2.0 | 1184 | $1,573 | $1.33 | 45d | 1 | 0.60mi |
| 1732 Carla Cv Southaven, MS | 4.0 | 1.5 | 1196 | $1,600 | $1.34 | 5d | 1 | 0.61mi |
| 8280 Hastings Cv Southaven, MS | 3.0 | 1.5 | 1184 | $1,350 | $1.14 | 22d | 1 | 0.75mi |
| 8254 Pinebrook Dr Southaven, MS | 3.0 | 1.0 | 1095 | $1,385 | $1.26 | 45d | 1 | 0.77mi |
| 8228 Brooksville Cv Southaven, MS | 3.0 | 2.0 | 1576 | $1,695 | $1.08 | 5d | 1 | 0.84mi |
| 1590 Custer Dr Southaven, MS | 3.0 | 1.0 | 900 | $1,295 | $1.44 | 21d | 1 | 0.85mi |
| 1842 Brookhaven Dr Southaven, MS | 3.0 | 1.0 | 1200 | $1,395 | $1.16 | 5d | 1 | 0.89mi |
| 7661 Ragland Pl Southaven, MS | 3.0 | 2.0 | 1242 | $1,793 | $1.44 | 45d | 1 | 0.96mi |
| 7658 Davis Pkwy Southaven, MS | 3.0 | 3.0 | 1513 | $1,995 | $1.32 | 18d | 1 | 0.97mi |
| 8349 Cedarbrush Dr Southaven, MS | 3.0 | 1.5 | 1200 | $1,395 | $1.16 | 45d | 1 | 1.01mi |
| 7605 Davis Pkwy Southaven, MS | 3.0 | 2.0 | 1351 | $1,710 | $1.27 | 25d | 1 | 1.03mi |
| 7560 Chesteridge Ave Southaven, MS | 1.0–3.0 | 1.0–2.0 | 887 | $1,475 | $1.66 | 3d | 7 | 1.04mi |
| 8082 Whitebrook Dr Southaven, MS | 3.0 | 1.0 | 1100 | $1,495 | $1.36 | 25d | 1 | 1.10mi |
| 98 Stonebrook Cv Southaven, MS | 4.0 | 2.0 | 1451 | $1,500 | $1.03 | 45d | 1 | 1.14mi |
| 1748 Newington Cv Southaven, MS | 3.0 | 1.5 | 1124 | $1,500 | $1.33 | 25d | 1 | 1.15mi |
| 8495 Charleston Dr Southaven, MS | 3.0 | 1.5 | 1450 | $1,345 | $0.93 | 16d | 1 | 1.15mi |
| 1984 Custer Dr Southaven, MS | 3.0 | 2.0 | 1131 | $1,523 | $1.35 | 45d | 1 | 1.16mi |
| 1766 Dorchester Dr Southaven, MS | 3.0 | 2.0 | 1200 | $1,585 | $1.32 | 25d | 1 | 1.22mi |
| 7594 Rockingham Dr Southaven, MS | 3.0 | 1.5 | 1680 | $1,665 | $0.99 | 45d | 1 | 1.23mi |
| 7087 Carrolton Dr W Southaven, MS | 3.0 | 2.0 | 1594 | $1,500 | $0.94 | 46d | 1 | 1.37mi |
| 7757 Charleston Dr Southaven, MS | 4.0 | 2.0 | 1325 | $1,650 | $1.25 | 25d | 1 | 1.43mi |
| 2179 Coral Hills Dr Southaven, MS | 4.0 | 1.5 | 1451 | $1,395 | $0.96 | 22d | 1 | 1.45mi |
Listing history 8 events
-
2026-05-11status Pending 270-char remark
Show marketing remark (270 chars)
Move in ready beautiful renovated house with 4 beds and 2 1/2 bath~fresh paint inside out~ new floor~ updated bathrooms~ updated kitchen with new SSA and counters~ new hardware and light fixtures ~updated windows. new privacy leveled fenced backyard. Must check it out!!
-
2026-04-29price $286,995 270-char remark
Show marketing remark (270 chars)
Move in ready beautiful renovated house with 4 beds and 2 1/2 bath~fresh paint inside out~ new floor~ updated bathrooms~ updated kitchen with new SSA and counters~ new hardware and light fixtures ~updated windows. new privacy leveled fenced backyard. Must check it out!!
-
2026-04-21price $286,990 270-char remark
Show marketing remark (270 chars)
Move in ready beautiful renovated house with 4 beds and 2 1/2 bath~fresh paint inside out~ new floor~ updated bathrooms~ updated kitchen with new SSA and counters~ new hardware and light fixtures ~updated windows. new privacy leveled fenced backyard. Must check it out!!
-
2026-03-31$287,990 Active 270-char remark
Show marketing remark (270 chars)
Move in ready beautiful renovated house with 4 beds and 2 1/2 bath~fresh paint inside out~ new floor~ updated bathrooms~ updated kitchen with new SSA and counters~ new hardware and light fixtures ~updated windows. new privacy leveled fenced backyard. Must check it out!!
-
2021-10-03historical
-
2001-11-21soldstatus
-
2001-04-06$117,500
-
1999-10-07$124,900
ⓘ Source: listings_history table (triggers on properties + properties_extension) + one-shot
backfill from property_details.listing_events for pre-trigger history.
Tax reassessment forecast MS · Resets to sale price
- Current annual tax
- $1,877 · $156/mo
- Projected year-2 tax
- $2,267 · $189/mo
- Expected delta
- +$390/yr (+$33/mo · 20.8%)
ⓘ Screening estimate from a state-policy table — verify with the county assessor before closing.
Climate risk First Street
- Flood 1/10 Low FEMA zone X (unshaded) · 0% chance over 30 yrs
- Wildfire 1/10 Low
- Heat 6/10 Major 7 d/yr ≥109°F today · 21 d/yr by 30 yrs out
- Wind 4/10 Moderate 20% chance of damaging wind over 30 yrs
- Air quality 2/10 Low 2 unhealthy d/yr today · 2 by 30 yrs out
Nearby sold comps map
Loading sold comps map…
Walkable amenities ~0.75 mi
Loading nearby amenities…
Taxation est. · year 1
- Rental income
- $20,260
- − Mortgage interest
- −$16,076
- − Property taxes
- −$1,877
- − Insurance
- −$1,435
- − Repairs & maintenance
- −$1,621
- − Management
- −$1,621
- − Depreciation
- −$8,349
- Taxable loss
- −$10,719
- Est. tax savings @ 24.0%
- +$2,573
- After-tax cash flow
- $-2,795/yr
For passive investors: Depreciation is non-cash, so a rental often shows a tax loss while cash-flowing — sheltering income. Rental losses are passive: they offset passive income freely, and up to $25,000/yr can offset ordinary (W-2) income if you actively participate and your MAGI is under $100k (phasing out to $0 by $150k); unused losses carry forward. On sale, claimed depreciation is recaptured at up to 25%, and gains may owe capital-gains tax (a 1031 exchange can defer both). Figures are a year-1 estimate at your 24.0% rate — not tax advice; consult a CPA.
Schools (NCES district)
- District
- Desoto County School District
- NCES district ID
- 2801320
- Math proficiency
- 48% ▼ -13.00%
- Reading proficiency
- 42% ▼ -6.00%
- Median HH income
- $59,272
- Composite
- 39.56/100
- National rank
- #3933
- State rank
- #20 of 130 in MS
Livability — Southaven
- Score
- 65/100
- State rank
- #107
- US rank
- #12584
Category grades
Schools grade is shown separately in the Schools card above.
Census & demographics
- Census place
- Southaven, MS
- County
- DeSoto County · 176,513 people
- City population
- 53,755
- Metro
- Memphis, TN-MS-AR
- Population (ZIP)
- 37,319
- Household income
- $61,843
- Rent vs Own
- Severe rent burden
- 1583.0
Population outlook (DeSoto County) Hauer SSP2
- Today (2025)
- 203,338 people
- By 2030
- 217,692 · +7.1%
- By 2040
- 245,320 · +20.6%
- By 2050
- 270,133 · +32.8%
- By 2075
- 323,341 · +59.0%
- By 2100
- 348,742 · +71.5%
Race, ethnicity, and origin ACS 2023
- Neighborhood character
- Diverse neighborhood (Simpson 0.58)
- Race & ethnicity
- White 49% Black 42% Hispanic / Latino 6% Two or more races 4%
- Hispanic origin (detail)
- Mexican 3%
- Common ancestry
- Italian 1% Lithuanian 1% Serbian 1%
- Foreign-born
- 3% · Canada
- Languages at home
- 95% English-only · Spanish 4%
Political lean MEDSL · DeSoto
- 2024 margin
- Strong R (+24.1) · D 36.7% · R 60.8% · Other 2.5%
- 2008→2024 swing
- +14.2pp toward D · 2008: -38.2pp · 2024: -24.1pp
- All cycles
- 2024: R+24.1 2020: R+23.9 2016: R+34.8 2012: R+33.5 2008: R+38.2
Not yet ingested
- Civics
- —
Market trends
- HPI YoY
- ▼ -49.08%
- Current HPI
- 220.7875
- Rent YoY
- ▲ 3.20%
- Metro
- Memphis, TN-MS-AR
- State GDP YoY
- —
- F500 in state
- 0
Price history
+129.8% since first listed8 events — show timeline
- 2026-05-11 Pending — MLSU
- 2026-04-29 Price Changed $286,995 MLSU
- 2026-04-21 Price Changed $286,990 MLSU
- 2026-03-31 Listed $287,990 MLSU
- 2021-10-03 Listing Removed — MLSU
- 2001-11-21 Sold (MLS) — MLSU
- 2001-04-06 Listed $117,500 MLSU
- 1999-10-07 Listed $124,900 MLSU
Property tax history
+4.1%/yrLatest (2025): $1,877 · +15.0% YoY. Source: county tax records.
Cash-flow waterfall
monthlySold comps — $/sqft
last 12 mo · ≤1 miLoading sold comps…