 Multi-family
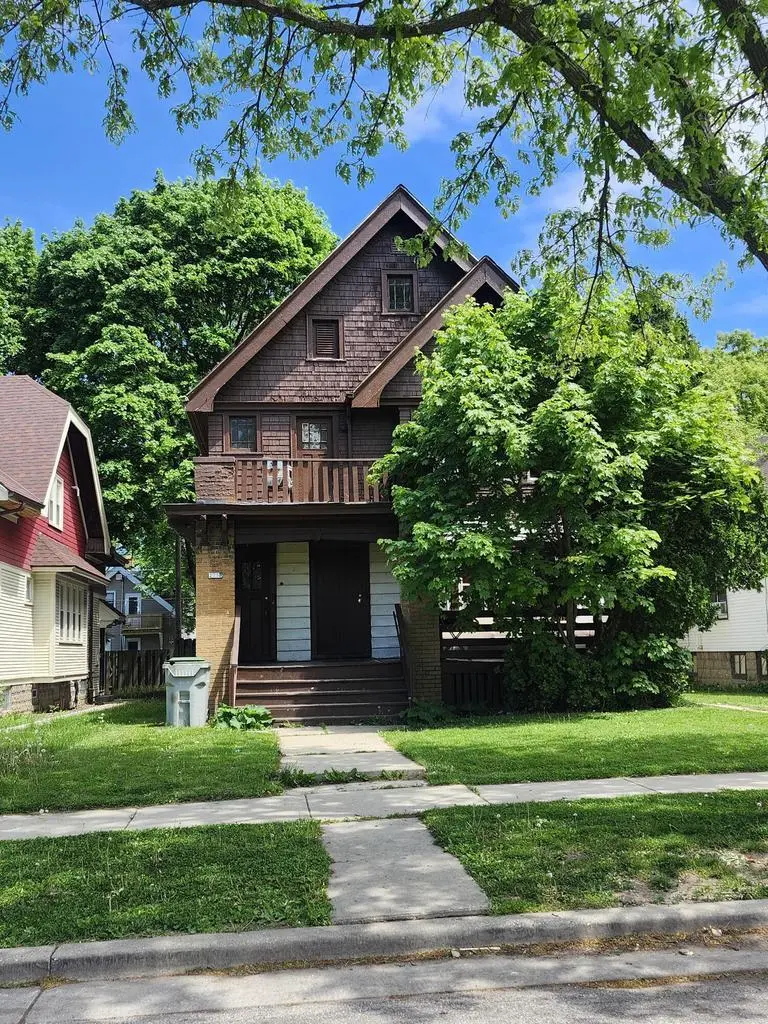
2754 N 49th St #2756 · Milwaukee, WI
Flood risk 1/10 · Minimal
- FEMA flood zone
- X (unshaded)
- Chance of flooding over 30 yrs
- 0.0%
- Est. flood insurance / yr
- $473 – $860
Fire risk 1/10 · Minimal
- Est. fire insurance / yr
- $636 – $1,182
Heat risk 2/10 · Minimal
- Hot days now (above 98°F)
- 7 days/yr
- Hot days in 30 yrs
- 13 days/yr
Wind risk 2/10 · Minimal
- Chance of severe wind over 30 yrs
- —
Air-quality risk 2/10 · Minimal
- Unhealthy air days now
- 2 days/yr
- Unhealthy air days in 30 yrs
- 2 days/yr
Risk factors via First Street. Map © Google.
Why this score? — see what drove the B+ grade
The composite is a weighted blend of 9 inputs, each scored 0–100. Each bar is that input's sub-score; the figure is the points it added to the 100-point composite (weight × sub-score).
- Cash flow +30.0/30.0
- ARV discount +15.0/15.0
- 1% rule +10.0/10.0
- DSCR +10.0/10.0
- Livability +4.0/5.0
- Rent growth +3.5/5.0
- Condition / age +2.2/5.0
- Schools +1.2/10.0
- Appreciation +0.0/10.0
$149,900
🖨 Deal sheet 📄 Offer letter ✓ Due diligence
Multi-family units
County records classify this as Multi-Family (2-4 Unit). Listing-text estimate: 1 unit. estimate disagrees with records
Listing remarks
This property is ready for you to live in one unit and rent out the other unit or to purchase as an investor eager to make some minor renovations in order to collect monthly income or to sell for a great profit! We can't wait for you to see this property and make it your own.
Key facts
- 5,227 sq ft lot
- Parking
- Built 1922
Property features AI
Finance
- Other: 2 total units
Exterior
- Parking: 1 parking space
- Utilities: Municipal water; Municipal sewer; 2 electric meters; 2 gas meters
- Home design: 2-story duplex; Property type: Multi-family; Zoning: RT2
- Construction: Less than 1/2 acre lot
- Exterior features: Vinyl exterior; Other exterior materials
Interior
- Kitchen: Unit 2 kitchen on lower level
- Bedrooms: Unit 1: 2 bedrooms; Unit 2: 2 bedrooms (master on lower level)
- Bathrooms: Unit 1: 1 full bathroom; Unit 2: 1 full bathroom
- Interior features: Full basement
Neighborhood map
What this means for you Summary
Snapshot
- This is a 4-bed/2.0-bath multifamily listed at $150k. Condition is rated fair.
Deal economics
- At list price, monthly cash flow is $862 ($10k/yr) — positive.
- The deal already cash-flows at list — no discount required.
- Meets the 1% rule at list price ($2k rent vs $150k).
- Recommended offer: $148k (1.5% below list) — sets the bar for market timing.
- Cap rate 13.2% vs local median 5.1% in Milwaukee — top-decile yield for the area; either an underpriced asset or a hidden risk that comps aren't pricing in. Stress-test before assuming the spread holds.
Location & tenants
- Location reads 81/100 on livability (#55 in WI, #1,534 nationally) — a professional / high-income tenant draw. Strengths: amenities A+, commute A+, cost of living A+; Watch: employment D+, schools F, crime F.
- Milwaukee School District (urban): math 10% / reading 18% proficiency, ranked #337 of 342 in WI (top 98%) — low school quality limits family demand, transient renter base, plan for 1-2y turnover; 77% free/reduced lunch — lower-income household profile, screen leases tightly.
- Market conditions: Rents rising (+3.8%/yr); 142 active listings in the ZIP; 1 comparable units currently listed for rent nearby; 1,017 units permitted in Milwaukee County in 2024 (803 in 5+ unit buildings).
- At $2,402/mo this rent would consume 60% of the median local household income ($48k/yr) (locally 1730% of renters already pay >50% of income on rent) — very limited rent-growth headroom before tenants either downsize or default.
Forward outlook
- Local home prices are declining (-3.0%/yr); year-one equity from $1k of loan paydown is wiped out by about $4k of value loss. Plan a longer hold.
- Milwaukee County population projected at +4% by 2050 — modest demand growth; plan on rents tracking national, not racing it.
- At projected returns (-3.0% appreciation + 3.8% rent growth), your $42k cash investment doubles in ~5 years — after that, you're playing with house money.
Negotiation context
- It's been on market 27 days — a 2% lower offer ($148k) is reasonable based on typical stale-listing flexibility.
Risks & watch-outs
- Watch-outs: built in 1922 — expect roof / HVAC / electrical / plumbing capex.
Questions for the listing agent
- Have any recent inspections been done? Can we get a copy of the seller's disclosures and any deferred-maintenance estimates?
- Built in 1922 — when were the roof, HVAC, electrical panel, plumbing, and water heater last replaced?
- Is there a deadline driving the sale (1031 exchange, divorce, estate, relocation)? That informs how much negotiation room exists.
- Schools are F-rated, which usually means shorter tenancies and higher turnover. Who's the typical renter profile here, and what's been the actual vacancy rate?
- Crime grade is F in this area — have there been break-ins, vandalism, or insurance claims at this property in the last 3 years? What carrier currently insures it and at what premium?
- What's the average days-on-market for RENTAL listings here right now (not sales)? A rising rental-DOM trend means longer vacancies and softer asking-rent achievability than the comps imply.
- What's the recent tenant-quality profile in this submarket — average credit score on applications, eviction rate, late-payment / NSF rate, and stable-employment percentage? A property-management company in the area should have these aggregated.
- How much new apartment / multifamily construction is in the pipeline within 1–3 miles? Heavy new supply (>2% of stock underway) typically softens rents 12–24 months out; light construction supports rent growth.
Investment metrics
- 1% rule
- 1.60% ✓
- Cap rate
- 13.19%
- Cash-on-cash
- 24.64%
- DSCR
- 2.10
- GRM
- 5.2
CMA / ARV
- ARV (on-the-fly)
- $208,165
- Comps found
- 12
Show comp detail 12 sales within ~0.75 mi
| Address | Dist | Beds/Ba | Sqft | Sold | Price | $/sf | Match |
|---|---|---|---|---|---|---|---|
| 2642 N 51st St #2644 | 0.20mi | 4/2.0 | 2,294 (-13%) | 1mo | $122,500 | $53 | 69 |
| 2808 N 52nd St #2810 | 0.20mi | 4/2.0 | 2,292 (-13%) | 1mo | $153,000 | $67 | 68 |
| 2342 N 45th St #2344 | 0.58mi | 4/2.0 | 2,577 (-2%) | 3mo | $125,000 | $49 | 67 |
| 3023 N 52nd St #3025 | 0.40mi | 4/2.0 | 2,408 (-9%) | 2mo | $139,900 | $58 | 66 |
| 3128 N 52nd St #3130 | 0.50mi | 4/2.0 | 2,400 (-9%) | 0mo | $283,000 | $118 | 62 |
| 2661 N 39th St #2663 | 0.62mi | 4/2.0 | 2,469 (-6%) | 2mo | $145,000 | $59 | 59 |
| 3280 N 54th St #3282 | 0.73mi | 4/2.0 | 2,494 (-5%) | 2mo | $340,000 | $136 | 56 |
| 3044 N 54th St #3046 | 0.47mi | 4/2.0 | 2,279 (-14%) | 0mo | $200,000 | $88 | 55 |
| 3037 N 53rd St | 0.45mi | 4/2.0 | 2,257 (-14%) | 2mo | $161,000 | $71 | 54 |
| 2400 N 56th St #2402 | 0.61mi | 4/2.0 | 2,291 (-13%) | 2mo | $278,000 | $121 | 48 |
| 3013 N 60th St #3015 | 0.74mi | 4/2.0 | 2,300 (-13%) | 2mo | $215,000 | $93 | 42 |
| 2977 N 60th St #2979 | 0.73mi | 5/2.0 (+1) | 2,273 (-14%) | 0mo | $179,900 | $79 | 38 |
Match score weights: distance 35% · size 25% · config 20% · recency 20%. Top-matched comps best support the ARV.
Projected returns pro-forma
-3.0% appreciation · 3.82% rent growth · sell at horizon
- IRR
- 19.0%
- Equity multiple
- 1.78×
- Total profit
- $32,623
- Equity at exit
- $22,351
- IRR
- 27.9%
- Equity multiple
- 3.56×
- Total profit
- $107,557
- Equity at exit
- $12,961
Cash invested: $41,972 (down + closing). Projections, not guarantees.
Landlord ↔ Tenant lean methodology
- Overall (STATE)
- 73 Landlord-Friendly
- State Wisconsin
- 73 Landlord-Friendly · R+2
- County
- — inherits STATE
- City
- — inherits STATE
ZIP-level market 53210
- Home prices YoY
- -21.5%
- Rents YoY
- 3.8%
- Active inventory
- 142
- Price-to-rent
- 10.4×
Monthly cashflow live
- Estimated rent
- $2,402 high interval (Pro) →
- Mortgage (P&I)
- −$786
- Tax est. 1.5%
- −$187 /mo · $2,248/yr
- Insurance
- −$62
- HOA
- −$0
- Vacancy / Maint / Mgmt
- −$504
- Net cashflow
- $862
Break-even live
2-unit breakdown (identical units grouped — click to expand)
| Units | Beds | Baths | Est. rent |
|---|---|---|---|
| 2× units | 2 | 1 | $2,402 |
| #1 | 2 | 1 | $1,201 |
| #2 | 2 | 1 | $1,201 |
| Total (2 units) | $2,402 | ||
UW: 25.0% down · 7.5% · 30yr · 1.5% tax · 5.0% vac · 8.0% maint · 8.0% mgmt
Financing live
Cash to close
- Down payment
- $37,475
- Closing costs
- $4,497
- Reserves months
- —
- Total cash needed
- —
Loan-product check · same deal, 3 products live
Conventional
25% down · 7.5% · 30yr
- Down + closing
- —
- Monthly P&I
- —
- Monthly cashflow
- —
- DSCR
- —
- Eligible?
- —
Personal DTI + credit; lowest rate.
DSCR
20% down · 8.5% · 30yr
- Down + closing
- —
- Monthly P&I
- —
- Monthly cashflow
- —
- DSCR
- —
- Eligible?
- —
No personal income docs; deal must DSCR.
Hard money
10% down · 12.0% · 12mo
- Down + closing
- —
- Monthly P&I
- —
- Monthly cashflow
- —
- DSCR
- —
- Eligible?
- —
Short-term bridge; refi at stabilization.
Rent comps 1 comps
| Address | Beds | Baths | Sqft | Rent | $/sqft | DOM | Units | Dist |
|---|---|---|---|---|---|---|---|---|
| 2432 N 28th St Milwaukee, WI | 5.0 | 1.5 | 1876 | $1,600 | $0.85 | 43d | 1 | 1.40mi |
Listing history 15 events
-
2026-06-18days on market $149,900 Active 27 DOM
-
2026-06-17days on market $149,900 Active 26 DOM
-
2026-06-16days on market $149,900 Active 25 DOM
-
2026-06-15days on market $149,900 Active 24 DOM
-
2026-06-13days on market $149,900 Active 22 DOM
-
2026-06-13days on market $149,900 Active 21 DOM
-
2026-06-09days on market $149,900 Active 18 DOM
-
2026-06-08days on market $149,900 Active 17 DOM
-
2026-06-07days on market $149,900 Active 16 DOM
-
2026-06-05days on market $149,900 Active 13 DOM
-
2026-06-03days on market $149,900 Active 12 DOM
-
2026-06-02pricedays on market $149,900 Active 11 DOM
-
2026-06-01days on market $159,900 Active 10 DOM
-
2026-05-31days on market $159,900 Active 9 DOM
-
2026-05-22$159,900 Active
ⓘ Source: listings_history table (triggers on properties + properties_extension) + one-shot
backfill from property_details.listing_events for pre-trigger history.
Climate risk First Street
- Flood 1/10 Low FEMA zone X (unshaded) · 0% chance over 30 yrs
- Wildfire 1/10 Low
- Heat 2/10 Low 7 d/yr ≥98°F today · 13 d/yr by 30 yrs out
- Wind 2/10 Low
- Air quality 2/10 Low 2 unhealthy d/yr today · 2 by 30 yrs out
Nearby sold comps map
Loading sold comps map…
Walkable amenities ~0.75 mi
Loading nearby amenities…
Taxation est. · year 1
- Rental income
- $28,824
- − Mortgage interest
- −$8,397
- − Property taxes
- −$2,248
- − Insurance
- −$750
- − Repairs & maintenance
- −$2,306
- − Management
- −$2,306
- − Depreciation
- −$4,361
- Taxable income
- $8,457
- Est. tax owed @ 24.0%
- −$2,030
- After-tax cash flow
- $8,310/yr
For passive investors: Depreciation is non-cash, so a rental often shows a tax loss while cash-flowing — sheltering income. Rental losses are passive: they offset passive income freely, and up to $25,000/yr can offset ordinary (W-2) income if you actively participate and your MAGI is under $100k (phasing out to $0 by $150k); unused losses carry forward. On sale, claimed depreciation is recaptured at up to 25%, and gains may owe capital-gains tax (a 1031 exchange can defer both). Figures are a year-1 estimate at your 24.0% rate — not tax advice; consult a CPA.
Condition & rehab AI · 3 photos
This property requires moderate renovations to improve its curb appeal and value. Fresh paint and new shingles are key updates for both resale and rental value.
Repairs flagged
- Minor Shingles — Aging but not damaged
- Minor Siding — Shows some wear
Value-add opportunities
- Both Paint exterior — Fresh paint enhances curb appeal and value
- Both Replace shingles — New shingles improve appearance and reduce maintenance costs
- Both Clean and maintain windows — Clean windows improve natural light and reduce energy costs
Renovation cost estimate screening
| Repair item | Severity | Est. cost |
|---|---|---|
| Shingles · Aging but not damaged | Minor | $500–3,000 |
| Siding · Shows some wear | Minor | $500–3,000 |
| Total estimated repair cost · 2 items | $1,000–6,000 |
Value-add ROI direction
- Both Paint exterior — Fresh paint enhances curb appeal and value ↑
- Both Replace shingles — New shingles improve appearance and reduce maintenance costs ↑
- Both Clean and maintain windows — Clean windows improve natural light and reduce energy costs ↑
ⓘ Cost ranges are severity-bucket heuristics (US national rule-of-thumb). Get contractor quotes + a written scope before underwriting a rehab budget.
Schools (NCES district)
- District
- Milwaukee School District
- NCES district ID
- 5509600
- Math proficiency
- 10% ▼ -5.00%
- Reading proficiency
- 18% ▬ 0.00%
- Median HH income
- $36,339
- Composite
- 11.61/100
- National rank
- #9696
- State rank
- #337 of 342 in WI
Livability — Milwaukee
- Score
- 81/100
- State rank
- #55
- US rank
- #1534
Category grades
Schools grade is shown separately in the Schools card above.
Census & demographics
- Census place
- Milwaukee, WI
- County
- Milwaukee County · 926,379 people
- City population
- 573,768
- Metro
- Milwaukee-Waukesha, WI
- Population (ZIP)
- 23,922
- Household income
- $48,217
- Rent vs Own
- Severe rent burden
- 1730.0
Population outlook (Milwaukee County) Hauer SSP2
- Today (2025)
- 995,758 people
- By 2030
- 1,009,124 · +1.3%
- By 2040
- 1,028,128 · +3.3%
- By 2050
- 1,040,066 · +4.4%
- By 2075
- 1,057,849 · +6.2%
- By 2100
- 1,039,774 · +4.4%
Race, ethnicity, and origin ACS 2023
- Neighborhood character
- Predominantly Black (71%)
- Race & ethnicity
- Black 71% White 17% Hispanic / Latino 6% Two or more races 6% Asian 2%
- Hispanic origin (detail)
- Mexican 3% Puerto Rican 1%
- Common ancestry
- Romanian 2% Portuguese 1% Italian 1%
- Foreign-born
- 3% · Canada, Philippines
- Languages at home
- 94% English-only · Spanish 3% Other Asian/Pacific 2%
Political lean MEDSL · Milwaukee
- 2024 margin
- Solid D (+38.5) · D 68.3% · R 29.8% · Other 1.8%
- 2008→2024 swing
- +2.7pp toward D · 2008: 35.9pp · 2024: 38.5pp
- All cycles
- 2024: D+38.5 2020: D+39.9 2016: D+37.5 2012: D+34.6 2008: D+35.9
Not yet ingested
- Civics
- —
Market trends
- HPI YoY
- ▼ -76.77%
- Current HPI
- 280.0133
- Rent YoY
- ▲ 3.82%
- Metro
- Milwaukee-Waukesha, WI
- State GDP YoY
- ▲ 2.10%
- F500 in state
- 20
Industry mix (Fortune 500 HQ in WI)
| Industry | F500 HQs | Revenue |
|---|---|---|
| Industrial Machinery | 4 | $23B |
|
||
| Industrial Technology | 2 | $36B |
|
||
| Insurance | 1 | $36B |
|
||
| Professional Services | 1 | $19B |
|
||
| Utilities | 1 | $9B |
|
||
| Consumer Goods | 1 | $3B |
|
||
Price history
1 event — show timeline
- 2026-05-22 Listed $159,900 METROMLS
Cash-flow waterfall
monthlySold comps — $/sqft
last 12 mo · ≤1 miLoading sold comps…