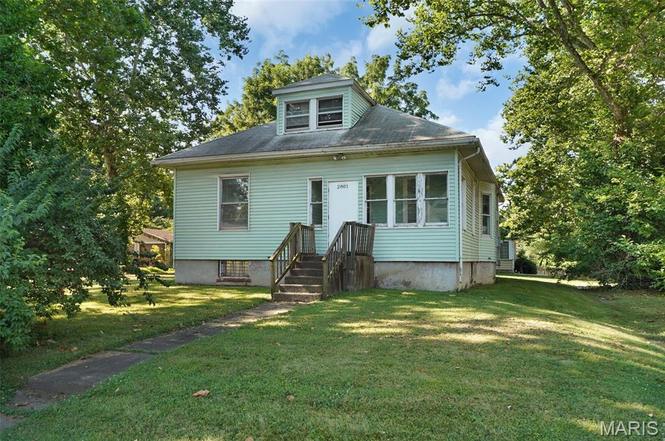
2801 Brown St · Alton, IL
Flood risk 1/10 · Minimal
- FEMA flood zone
- X
- Chance of flooding over 30 yrs
- 0.0%
- Est. flood insurance / yr
- $473 – $860
Fire risk 1/10 · Minimal
- Est. fire insurance / yr
- $804 – $1,492
Heat risk 5/10 · Moderate
- Hot days now (above 106°F)
- 7 days/yr
- Hot days in 30 yrs
- 20 days/yr
Wind risk 2/10 · Minimal
- Chance of severe wind over 30 yrs
- 1.0%
Air-quality risk 3/10 · Minor
- Unhealthy air days now
- 2 days/yr
- Unhealthy air days in 30 yrs
- 4 days/yr
Risk factors via First Street. Map © Google.
Why this score? — see what drove the B- grade
The composite is a weighted blend of 9 inputs, each scored 0–100. Each bar is that input's sub-score; the figure is the points it added to the 100-point composite (weight × sub-score).
- Cash flow +30.0/30.0
- 1% rule +10.0/10.0
- DSCR +10.0/10.0
- ARV discount +7.5/15.0
- Rent growth +4.6/5.0
- Livability +3.2/5.0
- Condition / age +2.5/5.0
- Schools +1.1/10.0
- Appreciation +0.0/10.0
$55,000
🖨 Deal sheet (PDF) 📄 Offer letter ✓ Due diligence
Listing remarks
Are you looking for a home to renovate with a lot of charm, space & an open floorplan in the booming City of Alton? This beauty has its original pocket doors, tall ceilings, hardwood floors & wood door casing! This gem was converted into and used as a doctor's office most recently but is also zoned as a single-family residence. There is a wall currently dividing the Living & Dining Rooms, but it was just created to partition the waiting room from the reception area of the doctor's office & could easily be removed as it's not load-bearing. The Dining Room once featured a Bay Window that could easily be brought back to life by adding the middle window and re-working so
Key facts
- Tall ceilings
- Butler's pantry
- Wood door casing
Tags
Neighborhood map
What this means for you Summary
Snapshot
- This is a 5-bed/1.5-bath single-family listed at $55k.
Deal economics
- At list price, monthly cash flow is $989 ($12k/yr) — positive.
- The deal already cash-flows at list — no discount required.
- Meets the 1% rule at list price ($2k rent vs $55k).
- Recommended offer: $52k (6.0% below list) — sets the bar for market timing.
- Cap rate 27.9% vs local median 6.4% in Alton — top-decile yield for the area; either an underpriced asset or a hidden risk that comps aren't pricing in. Stress-test before assuming the spread holds.
Location & tenants
- Location reads 64/100 on livability (#701 in IL) — a middle-class / working-renter tenant base. Strengths: cost of living A+, housing A; Watch: health & safety C-, crime F, amenities D-.
- Alton CUSD 11 (suburban): math 12% / reading 13% proficiency, ranked #544 of 620 in IL (top 88%) — low school quality limits family demand, transient renter base, plan for 1-2y turnover; 60% free/reduced lunch — lower-income household profile, screen leases tightly.
- Zoned schools: Alton High School (math 20% / reading 25%, grade F, #317 of 693 statewide, top 46%, 1,990 students, 0% FRL) — zoned schools average 0% FRL vs 60% district-wide (60 pts lower); this property's tenant base skews higher-income than the district average.
- Market conditions: Rents rising fast (+8.2%/yr); 169 active listings in the ZIP; 336 units permitted in Madison County in 2024 (0 in 5+ unit buildings).
- This rent runs 34% of the median local income ($61k/yr) — at the standard rent-burdened threshold; future hikes will face affordability resistance.
Forward outlook
- Local home prices are declining (-3.0%/yr); year-one equity from $380 of loan paydown is wiped out by about $2k of value loss. Plan a longer hold.
- Madison County population projected at -18% by 2050 — secular population decline; favor cash flow + early exit over multi-decade hold.
- At projected returns (-3.0% appreciation + 8.0% rent growth), your $15k cash investment doubles in ~2 years — after that, you're playing with house money.
Negotiation context
- It's been on market 89 days — a 6% lower offer ($52k) is reasonable based on typical stale-listing flexibility.
- 5 sale attempts since 2y ago with the ask held roughly flat each time — persistent listings suggest the price (not the market) is what's stuck; bring a comps-based counter.
Risks & watch-outs
- Watch-outs: built in 1930 — expect roof / HVAC / electrical / plumbing capex.
- Climate carrying-cost: extreme-heat days projected 7→20/yr by 2055 (HVAC capex compounding) — expect insurance premiums to compound above CPI over the hold.
Questions for the listing agent
- It's been on market 89 days. Have you received any prior offers? Is the seller open to a 6% concession, seller financing, or rate buy-down credit?
- Built in 1930 — when were the roof, HVAC, electrical panel, plumbing, and water heater last replaced?
- Why hasn't it sold? Are there any deal-killer items the seller is aware of (foundation, flood, title, zoning, code violations)?
- Is there a deadline driving the sale (1031 exchange, divorce, estate, relocation)? That informs how much negotiation room exists.
- Schools are F-rated, which usually means shorter tenancies and higher turnover. Who's the typical renter profile here, and what's been the actual vacancy rate?
- Crime grade is F in this area — have there been break-ins, vandalism, or insurance claims at this property in the last 3 years? What carrier currently insures it and at what premium?
- What's the average days-on-market for RENTAL listings here right now (not sales)? A rising rental-DOM trend means longer vacancies and softer asking-rent achievability than the comps imply.
- What's the recent tenant-quality profile in this submarket — average credit score on applications, eviction rate, late-payment / NSF rate, and stable-employment percentage? A property-management company in the area should have these aggregated.
- How much new for-sale + rental construction is in the pipeline within 1–3 miles? Heavy new supply typically softens prices + rents 12–24 months out; constrained supply supports both.
Investment metrics
- 1% rule
- 3.15% ✓
- Cap rate
- 27.87%
- Cash-on-cash
- 77.07%
- DSCR
- 4.43
- GRM
- 2.6
CMA / ARV
- ARV (on-the-fly)
- $191,100
- Comps found
- 8
Show comp detail 8 sales within ~0.75 mi
| Address | Dist | Beds/Ba | Sqft | Sold | Price | $/sf | Match |
|---|---|---|---|---|---|---|---|
| 2801 Brown St | 0.00mi | 5/1.5 | 2,100 (0%) | 1mo | $55,000 | $26 | 99 |
| 1320 Washington Ave | 0.27mi | 4/2.0 (-1) | 2,023 (-4%) | 1mo | $214,000 | $106 | 73 |
| 2701 Watalee St | 0.29mi | 4/1.5 (-1) | 2,322 (+11%) | 3mo | $165,000 | $71 | 61 |
| 1854 Evergreen | 0.44mi | 4/2.0 (-1) | 2,092 (-0%) | 17mo | $190,000 | $91 | 58 |
| 1106 Washington Ave | 0.36mi | 4/2.5 (-1) | 2,312 (+10%) | 4mo | $209,900 | $91 | 54 |
| 1201 Milton Rd | 0.72mi | 4/2.0 (-1) | 2,026 (-4%) | 4mo | $169,900 | $84 | 50 |
| 2025 Park Ave | 0.60mi | 4/1.5 (-1) | 1,974 (-6%) | 23mo | $219,900 | $111 | 38 |
| 863 Washington Ave | 0.63mi | 5/3.0 | 2,400 (+14%) | 10mo | $179,900 | $75 | 32 |
Match score weights: distance 35% · size 25% · config 20% · recency 20%. Top-matched comps best support the ARV.
Projected returns pro-forma
-3.0% appreciation · 8.0% rent growth · sell at horizon
- IRR
- 82.7%
- Equity multiple
- 5.11×
- Total profit
- $63,266
- Equity at exit
- $8,201
- IRR
- 87.2%
- Equity multiple
- 12.56×
- Total profit
- $177,998
- Equity at exit
- $4,755
Cash invested: $15,400 (down + closing). Projections, not guarantees.
Landlord ↔ Tenant lean methodology
- Overall (STATE)
- 43 Moderately Tenant-Leaning
- State Illinois
- 43 Moderately Tenant-Leaning · D+7
- County
- — inherits STATE
- City
- — inherits STATE
ZIP-level market 62002
- Home prices YoY
- -33.6%
- Rents YoY
- 8.2%
- Active inventory
- 169
- Price-to-rent
- 2.6×
Monthly cashflow live
- Estimated rent
- $1,733 medium interval (Pro) →
- Mortgage (P&I)
- −$288
- Tax est. 1.5%
- −$69 /mo · $825/yr
- Insurance
- −$23
- HOA
- −$0
- Vacancy / Maint / Mgmt
- −$364
- Net cashflow
- $989
Break-even live
Sensitivity live
| Price | -10% $1,027 | -5% $1,008 | +0% $989 | +5% $970 | +10% $951 |
|---|---|---|---|---|---|
| Rent | -10% $852 | -5% $921 | +0% $989 | +5% $1,058 | +10% $1,126 |
| Rate | -1.0pp $1,017 | -0.5pp $1,003 | base $989 | +0.5pp $975 | +1.0pp $960 |
UW: 25.0% down · 7.5% · 30yr · 1.5% tax · 5.0% vac · 8.0% maint · 8.0% mgmt
Financing live
Cash to close
- Down payment
- $13,750
- Closing costs
- $1,650
- Reserves months
- —
- Total cash needed
- —
Loan-product check · same deal, 3 products live
Conventional
25% down · 7.5% · 30yr
- Down + closing
- —
- Monthly P&I
- —
- Monthly cashflow
- —
- DSCR
- —
- Eligible?
- —
Personal DTI + credit; lowest rate.
DSCR
20% down · 8.5% · 30yr
- Down + closing
- —
- Monthly P&I
- —
- Monthly cashflow
- —
- DSCR
- —
- Eligible?
- —
No personal income docs; deal must DSCR.
Hard money
10% down · 12.0% · 12mo
- Down + closing
- —
- Monthly P&I
- —
- Monthly cashflow
- —
- DSCR
- —
- Eligible?
- —
Short-term bridge; refi at stabilization.
Listing history 11 events
-
2026-04-21status Pending
-
2026-01-21$55,000 Active
-
2025-07-18$60,000 Active
-
2025-03-09status Active
-
2025-03-09price $52,900
-
2025-03-04status Pending
-
2025-01-08status Active
-
2025-01-08price $69,900
-
2024-10-18price $71,900
-
2024-08-28price $74,900
-
2024-08-12$87,900 Active
ⓘ Source: listings_history table (triggers on properties + properties_extension) + one-shot
backfill from property_details.listing_events for pre-trigger history.
Climate risk First Street
- Flood 1/10 Low FEMA zone X · 0% chance over 30 yrs
- Wildfire 1/10 Low
- Heat 5/10 Major 7 d/yr ≥106°F today · 20 d/yr by 30 yrs out
- Wind 2/10 Low 100% chance of damaging wind over 30 yrs
- Air quality 3/10 Moderate 2 unhealthy d/yr today · 4 by 30 yrs out
Nearby sold comps map
Loading sold comps map…
Walkable amenities ~0.75 mi
Loading nearby amenities…
Taxation est. · year 1
- Rental income
- $20,797
- − Mortgage interest
- −$3,081
- − Property taxes
- −$825
- − Insurance
- −$275
- − Repairs & maintenance
- −$1,664
- − Management
- −$1,664
- − Depreciation
- −$1,600
- Taxable income
- $11,689
- Est. tax owed @ 24.0%
- −$2,805
- After-tax cash flow
- $9,063/yr
For passive investors: Depreciation is non-cash, so a rental often shows a tax loss while cash-flowing — sheltering income. Rental losses are passive: they offset passive income freely, and up to $25,000/yr can offset ordinary (W-2) income if you actively participate and your MAGI is under $100k (phasing out to $0 by $150k); unused losses carry forward. On sale, claimed depreciation is recaptured at up to 25%, and gains may owe capital-gains tax (a 1031 exchange can defer both). Figures are a year-1 estimate at your 24.0% rate — not tax advice; consult a CPA.
Schools (NCES district)
- District
- Alton CUSD 11
- NCES district ID
- 1703600
- Math proficiency
- 12% ▼ -10.00%
- Reading proficiency
- 13% ▼ -10.00%
- Median HH income
- $46,257
- Composite
- 11.34/100
- National rank
- #9710
- State rank
- #544 of 620 in IL
Livability — Alton
- Score
- 64/100
- State rank
- #701
- US rank
- #14289
Category grades
Schools grade is shown separately in the Schools card above.
Census & demographics
- Census place
- Alton, IL
- County
- Madison County · 189,064 people
- City population
- 29,543
- Metro
- St. Louis, MO-IL
- Population (ZIP)
- 29,543
- Household income
- $61,414
- Rent vs Own
- Severe rent burden
- 960.0
Population outlook (Madison County) Hauer SSP2
- Today (2025)
- 258,371 people
- By 2030
- 251,523 · -2.7%
- By 2040
- 233,640 · -9.6%
- By 2050
- 213,042 · -17.5%
- By 2075
- 165,255 · -36.0%
- By 2100
- 123,953 · -52.0%
Race, ethnicity, and origin ACS 2023
- Neighborhood character
- Predominantly White (71%)
- Race & ethnicity
- White 71% Black 20% Two or more races 6% Hispanic / Latino 2% Asian 1%
- Common ancestry
- Romanian 2% Lithuanian 2% Slovak 1%
- Foreign-born
- 2% · Canada
- Languages at home
- 97% English-only · Spanish 1% Other Indo-European 1%
Political lean MEDSL · Madison
- 2024 margin
- R (+13.3) · D 42.5% · R 55.8% · Other 1.8%
- 2008→2024 swing
- -22.5pp toward R · 2008: 9.2pp · 2024: -13.3pp
- All cycles
- 2024: R+13.3 2020: R+13.2 2016: R+15.6 2012: R+1.4 2008: D+9.2
Not yet ingested
- Civics
- —
Market trends
- HPI YoY
- ▼ -98.43%
- Current HPI
- 194.7313
- Rent YoY
- ▲ 8.24%
- Metro
- St. Louis, MO-IL
- State GDP YoY
- ▲ 1.59%
- F500 in state
- 60
Industry mix (Fortune 500 HQ in IL)
| Industry | F500 HQs | Revenue |
|---|---|---|
| Insurance | 4 | $201B |
|
||
| Consumer Goods | 4 | $87B |
|
||
| Industrial Machinery | 3 | $64B |
|
||
| Healthcare | 2 | $55B |
|
||
| Retail / Pharmacy | 1 | $148B |
|
||
| Agriculture / Food | 1 | $86B |
|
||
Price history
-37.4% since first listed11 events — show timeline
- 2026-04-21 Pending — MARIS as Distributed by MLS Grid
- 2026-01-21 Listed $55,000 MARIS as Distributed by MLS Grid
- 2025-07-18 Listed $60,000 MARIS as Distributed by MLS Grid
- 2025-03-09 Relisted — MARIS as Distributed by MLS Grid
- 2025-03-09 Price Changed $52,900 MARIS as Distributed by MLS Grid
- 2025-03-04 Pending — MARIS as Distributed by MLS Grid
- 2025-01-08 Relisted — MARIS as Distributed by MLS Grid
- 2025-01-08 Price Changed $69,900 MARIS as Distributed by MLS Grid
- 2024-10-18 Price Changed $71,900 MARIS as Distributed by MLS Grid
- 2024-08-28 Price Changed $74,900 MARIS as Distributed by MLS Grid
- 2024-08-12 Listed $87,900 MARIS as Distributed by MLS Grid
Property tax history
+2.3%/yrLatest (2024): $2,813 · +6.4% YoY. Source: county tax records.
Cash-flow waterfall
monthlySold comps — $/sqft
last 12 mo · ≤1 miLoading sold comps…