 Triplex
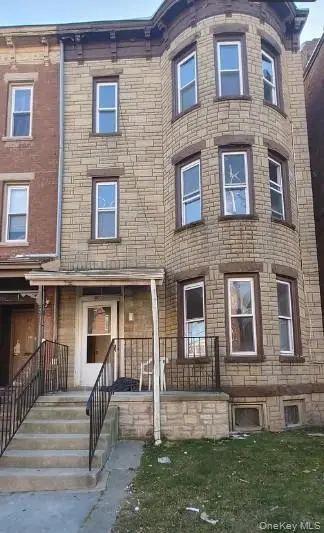
99 Overlook Pl · Newburgh, NY
Flood risk No data
- FEMA flood zone
- —
- Chance of flooding over 30 yrs
- —
- Est. flood insurance / yr
- —
Fire risk No data
- Est. fire insurance / yr
- —
Heat risk No data
- Hot days now (above threshold)
- —
- Hot days in 30 yrs
- —
Wind risk No data
- Chance of severe wind over 30 yrs
- —
Air-quality risk No data
- Unhealthy air days now
- —
- Unhealthy air days in 30 yrs
- —
Risk factors via First Street. Map © Google.
Why this score? — see what drove the B grade
The composite is a weighted blend of 9 inputs, each scored 0–100. Each bar is that input's sub-score; the figure is the points it added to the 100-point composite (weight × sub-score).
- Cash flow +28.3/30.0
- ARV discount +15.0/15.0
- DSCR +10.0/10.0
- 1% rule +8.7/10.0
- Schools +3.5/10.0
- Livability +3.1/5.0
- Rent growth +2.7/5.0
- Condition / age +2.5/5.0
- Appreciation +0.0/10.0
$420,000
🖨 Deal sheet 📄 Offer letter ✓ Due diligence
Multi-family units
County records classify this as Multi-Family (2-4 Unit). Listing-text estimate: 3 units. confirmed
Listing remarks MLS
Updated 3 Family Triplex consisting of two 2 Bedroom 1 Bath units and one 3 Bedroom 1 Bath unit. Located close to stores, restaurants, new cafes, and parks. Walking distance to stores and restaurants on Broadway, Liberty St, Washington's Headquarters, the waterfront, and the Newburgh-Beacon Ferry. Close to Dawning Park, Mount Saint Mary College, and Montefiore St. Luke's Hospital. Five min drive to I-84, 15 min to Beacon Metro-North train station & Stewart Airport, 75 min to NYC. Tenants pay for electricity and gas. Landlord pays for water, sewer, and sanitation.
Key facts
- Close to parks
- Close to restaurants
- Close to stores
Tags
Neighborhood map
What this means for you Summary
Snapshot
- This is a 2×2bd/1.0ba + 1×3bd/1.0ba units multifamily listed at $420k.
Deal economics
- At list price, monthly cash flow is $1k ($16k/yr) — positive. Per door: $450/mo.
- The deal already cash-flows at list — no discount required.
- Meets the 1% rule at list price ($6k rent vs $420k).
- Recommended offer: $370k (12.0% below list) — sets the bar for market timing.
- Cap rate 10.2% vs local median 4.4% in Newburgh — top-decile yield for the area; either an underpriced asset or a hidden risk that comps aren't pricing in. Stress-test before assuming the spread holds.
Location & tenants
- Location reads 62/100 on livability (#878 in NY) — a middle-class / working-renter tenant base. Strengths: health & safety A+, housing B+, cost of living B; Watch: employment D+, schools D, crime F.
- Newburgh City School District (suburban): math 33% / reading 48% proficiency, ranked #500 of 590 in NY (top 85%) — families likely to look elsewhere, expect single-tenant / working-renter base with shorter leases; 61% free/reduced lunch — lower-income household profile, screen leases tightly.
- Market conditions: Rents flat; 383 active listings in the ZIP; solid renter incomes; 1,746 units permitted in Orange County in 2024 (1,265 in 5+ unit buildings).
- At $5,758/mo this rent would consume 81% of the median local household income ($86k/yr) (locally 2412% of renters already pay >50% of income on rent) — very limited rent-growth headroom before tenants either downsize or default.
Forward outlook
- Local home prices are declining (-3.0%/yr); year-one equity from $3k of loan paydown is wiped out by about $13k of value loss. Plan a longer hold.
Negotiation context
- It's been on market 156 days — a 12% lower offer ($370k) is reasonable based on typical stale-listing flexibility.
- 2 sale attempts since 12y ago with the ask held roughly flat each time — persistent listings suggest the price (not the market) is what's stuck; bring a comps-based counter.
- Current owner paid $56k; list at $420k implies a 650% gain — meaningful room to come down on a strong offer.
Risks & watch-outs
- Watch-outs: built in 1900 — expect roof / HVAC / electrical / plumbing capex.
Questions for the listing agent
- It's been on market 156 days. Have you received any prior offers? Is the seller open to a 12% concession, seller financing, or rate buy-down credit?
- Can we see the unit-by-unit rent roll, current vacancy, and any below-market leases? What's the average tenancy length?
- What capital expenditures (roof, boiler, parking lot, exteriors) have been made in the last 5 years, and what's planned in the next 2?
- Built in 1900 — when were the roof, HVAC, electrical panel, plumbing, and water heater last replaced?
- Why hasn't it sold? Are there any deal-killer items the seller is aware of (foundation, flood, title, zoning, code violations)?
- Is there a deadline driving the sale (1031 exchange, divorce, estate, relocation)? That informs how much negotiation room exists.
- Schools are D-rated, which usually means shorter tenancies and higher turnover. Who's the typical renter profile here, and what's been the actual vacancy rate?
- Crime grade is F in this area — have there been break-ins, vandalism, or insurance claims at this property in the last 3 years? What carrier currently insures it and at what premium?
- What's the average days-on-market for RENTAL listings here right now (not sales)? A rising rental-DOM trend means longer vacancies and softer asking-rent achievability than the comps imply.
- What's the recent tenant-quality profile in this submarket — average credit score on applications, eviction rate, late-payment / NSF rate, and stable-employment percentage? A property-management company in the area should have these aggregated.
- How much new apartment / multifamily construction is in the pipeline within 1–3 miles? Heavy new supply (>2% of stock underway) typically softens rents 12–24 months out; light construction supports rent growth.
Investment metrics
- 1% rule
- 1.37% ✓
- Cap rate
- 10.15%
- Cash-on-cash
- 13.78%
- DSCR
- 1.61
- GRM
- 6.1
CMA / ARV
- ARV (median comp)
- $656,817
- List price
- $420,000
- Delta
- -36.06%
- Verdict
- UNDERPRICED
- Comps
- 20 within 1.0 mi
Show comp detail 11 sales within ~0.75 mi
| Address | Dist | Beds/Ba | Sqft | Sold | Price | $/sf | Match |
|---|---|---|---|---|---|---|---|
| 87 Overlook Pl | 0.03mi | 8/3.0 | 3,159 (+9%) | 11mo | $510,000 | $161 | 74 |
| 103 Overlook Pl | 0.01mi | 9/3.0 (+1) | 3,185 (+10%) | 12mo | $580,000 | $182 | 68 |
| 11 Liberty St | 0.20mi | 7/3.0 (-1) | 3,024 (+5%) | 17mo | $525,000 | $174 | 64 |
| 105 Renwick St | 0.15mi | 9/3.0 (+1) | 3,132 (+8%) | 16mo | $435,000 | $139 | 61 |
| 103 Carson Ave | 0.05mi | 9/3.0 (+1) | 3,162 (+9%) | 23mo | $460,000 | $145 | 58 |
| 27 Clark St | 0.41mi | 8/3.0 | 2,724 (-6%) | 19mo | $410,000 | $151 | 55 |
| 67 William St | 0.30mi | 9/3.0 (+1) | 2,640 (-9%) | 19mo | $420,000 | $159 | 51 |
| 55 Carpenter Ave | 0.69mi | 8/4.0 | 3,000 (+4%) | 9mo | $435,000 | $145 | 50 |
| 57 Carpenter Ave | 0.69mi | 7/3.0 (-1) | 3,000 (+4%) | 8mo | $460,000 | $153 | 50 |
| 189 Liberty St | 0.65mi | 7/5.0 (-1) | 2,927 (+1%) | 16mo | $565,000 | $193 | 41 |
| 47 Carpenter Ave | 0.67mi | 8/3.0 | 3,234 (+12%) | 23mo | $460,000 | $142 | 30 |
Match score weights: distance 35% · size 25% · config 20% · recency 20%. Top-matched comps best support the ARV.
Projected returns pro-forma
-3.0% appreciation · 0.63% rent growth · sell at horizon
- IRR
- 1.1%
- Equity multiple
- 1.04×
- Total profit
- $4,780
- Equity at exit
- $62,623
- IRR
- 8.0%
- Equity multiple
- 1.54×
- Total profit
- $63,484
- Equity at exit
- $36,314
Cash invested: $117,600 (down + closing). Projections, not guarantees.
Landlord ↔ Tenant lean methodology
- Overall (STATE)
- 15 Strongly Tenant-Friendly
- State New York
- 15 Strongly Tenant-Friendly · D+10
- County
- — inherits STATE
- City
- — inherits STATE
ZIP-level market 12550
- Home prices YoY
- -33.3%
- Rents YoY
- 0.6%
- Active inventory
- 383
- Price-to-rent
- 18.9×
Monthly cashflow live
- Estimated rent
- $5,758 high interval (Pro) →
- Mortgage (P&I)
- −$2,203
- Tax from tax record
- −$821 /mo · $9,855/yr
- Insurance
- −$175
- HOA
- −$0
- Vacancy / Maint / Mgmt
- −$1,209
- Net cashflow
- $1,350
Break-even live
3-unit breakdown (identical units grouped — click to expand)
| Units | Beds | Baths | Est. rent |
|---|---|---|---|
| 2× units | 2 | 1 | $3,710 |
| #1 | 2 | 1 | $1,855 |
| #2 | 2 | 1 | $1,855 |
| 1× unit | 3 | 1 | $2,047 |
| Total (3 units) | $5,758 | ||
UW: 25.0% down · 7.5% · 30yr · 1.5% tax · 5.0% vac · 8.0% maint · 8.0% mgmt
Financing live
Cash to close
- Down payment
- $105,000
- Closing costs
- $12,600
- Reserves months
- —
- Total cash needed
- —
Loan-product check · same deal, 3 products live
Conventional
25% down · 7.5% · 30yr
- Down + closing
- —
- Monthly P&I
- —
- Monthly cashflow
- —
- DSCR
- —
- Eligible?
- —
Personal DTI + credit; lowest rate.
DSCR
20% down · 8.5% · 30yr
- Down + closing
- —
- Monthly P&I
- —
- Monthly cashflow
- —
- DSCR
- —
- Eligible?
- —
No personal income docs; deal must DSCR.
Hard money
10% down · 12.0% · 12mo
- Down + closing
- —
- Monthly P&I
- —
- Monthly cashflow
- —
- DSCR
- —
- Eligible?
- —
Short-term bridge; refi at stabilization.
Listing history 19 events
-
2026-06-18days on market $420,000 Active 156 DOM
-
2026-06-17days on market $420,000 Active 155 DOM
-
2026-06-16days on market $420,000 Active 154 DOM
-
2026-06-15days on market $420,000 Active 153 DOM
-
2026-06-14days on market $420,000 Active 151 DOM
-
2026-06-13days on market $420,000 Active 150 DOM
-
2026-06-10days on market $420,000 Active 148 DOM
-
2026-06-09days on market $420,000 Active 147 DOM
-
2026-06-08days on market $420,000 Active 146 DOM
-
2026-06-07days on market $420,000 Active 145 DOM
-
2026-06-03days on market $420,000 Active 141 DOM
-
2026-06-02days on market $420,000 Active 140 DOM
-
2026-06-01days on market $420,000 Active 139 DOM
-
2026-05-31days on market $420,000 Active 138 DOM
-
2026-05-30days on market $420,000 Active 137 DOM
-
2026-01-12$420,000 Active 574-char remark
Show marketing remark (574 chars)
Updated 3 Family Triplex consisting of two 2 Bedroom 1 Bath units and one 3 Bedroom 1 Bath unit. Located close to stores, restaurants, new cafes, and parks. Walking distance to stores and restaurants on Broadway, Liberty St, Washington's Headquarters, the waterfront, and the Newburgh-Beacon Ferry. Close to Dawning Park, Mount Saint Mary College, and Montefiore St. Luke's Hospital. Five min drive to I-84, 15 min to Beacon Metro-North train station & Stewart Airport, 75 min to NYC. Tenants pay for electricity and gas. Landlord pays for water, sewer, and sanitation.
-
2014-07-07historical Withdrawn
-
2014-04-05Pending
-
2000-04-12soldstatus $56,000
ⓘ Source: listings_history table (triggers on properties + properties_extension) + one-shot
backfill from property_details.listing_events for pre-trigger history.
Tax reassessment forecast NY · Partial reset (capped growth)
- Current annual tax
- $9,855 · $821/mo
- Projected year-2 tax
- $9,855 · $821/mo
- Expected delta
- $0/yr ($0/mo · 0.0%)
ⓘ Screening estimate from a state-policy table — verify with the county assessor before closing.
Nearby sold comps map
Loading sold comps map…
Walkable amenities ~0.75 mi
Loading nearby amenities…
Taxation est. · year 1
- Rental income
- $69,096
- − Mortgage interest
- −$23,527
- − Property taxes
- −$9,855
- − Insurance
- −$2,100
- − Repairs & maintenance
- −$5,528
- − Management
- −$5,528
- − Depreciation
- −$12,218
- Taxable income
- $10,341
- Est. tax owed @ 24.0%
- −$2,482
- After-tax cash flow
- $13,718/yr
For passive investors: Depreciation is non-cash, so a rental often shows a tax loss while cash-flowing — sheltering income. Rental losses are passive: they offset passive income freely, and up to $25,000/yr can offset ordinary (W-2) income if you actively participate and your MAGI is under $100k (phasing out to $0 by $150k); unused losses carry forward. On sale, claimed depreciation is recaptured at up to 25%, and gains may owe capital-gains tax (a 1031 exchange can defer both). Figures are a year-1 estimate at your 24.0% rate — not tax advice; consult a CPA.
Schools (NCES district)
- District
- Newburgh City School District
- NCES district ID
- 3620700
- Math proficiency
- 33% ▼ -8.00%
- Reading proficiency
- 48% ▲ 10.00%
- Median HH income
- $56,387
- Composite
- 35.46/100
- National rank
- #4927
- State rank
- #500 of 590 in NY
Livability — Newburgh
- Score
- 62/100
- State rank
- #878
- US rank
- #17021
Category grades
Schools grade is shown separately in the Schools card above.
Census & demographics
- Census place
- Newburgh, NY
- County
- Orange County · 267,004 people
- City population
- 55,152
- Metro
- Poughkeepsie-Newburgh-Middletown, NY
- Population (ZIP)
- 55,152
- Household income
- $85,697
- Rent vs Own
- Severe rent burden
- 2412.0
Population outlook (Orange County) Hauer SSP2
- Today (2025)
- 379,830 people
- By 2030
- 378,955 · -0.2%
- By 2040
- 375,444 · -1.2%
- By 2050
- 369,311 · -2.8%
- By 2075
- 354,233 · -6.7%
- By 2100
- 318,150 · -16.2%
Race, ethnicity, and origin ACS 2023
- Neighborhood character
- Diverse neighborhood (Simpson 0.68)
- Race & ethnicity
- Hispanic / Latino 39% White 36% Black 20% Two or more races 12% Asian 2%
- Hispanic origin (detail)
- Mexican 14% Puerto Rican 10% Dominican 2%
- Common ancestry
- Romanian 2% Hispanic 1% Lithuanian 1%
- Foreign-born
- 18% · Canada, Dominican Republic
- Languages at home
- 64% English-only · Spanish 30% French/Haitian/Cajun 1% Other Indo-European 1%
Political lean MEDSL · Orange
- 2024 margin
- Lean R (+8.4) · D 45.8% · R 54.2%
- 2008→2024 swing
- -12.5pp toward R · 2008: 4.1pp · 2024: -8.4pp
- All cycles
- 2024: R+8.4 2020: R+0.2 2016: R+6.5 2012: D+5.2 2008: D+4.1
Not yet ingested
- Civics
- —
Market trends
- HPI YoY
- ▼ -151.93%
- Current HPI
- 304.1046
- Rent YoY
- ▲ 0.63%
- Metro
- Poughkeepsie-Newburgh-Middletown, NY
- State GDP YoY
- ▲ 2.60%
- F500 in state
- 92
Industry mix (Fortune 500 HQ in NY)
| Industry | F500 HQs | Revenue |
|---|---|---|
| Financial Services | 10 | $950B |
|
||
| Consumer Goods | 9 | $162B |
|
||
| Insurance | 4 | $225B |
|
||
| Telecommunications | 2 | $144B |
|
||
| Pharmaceuticals | 2 | $112B |
|
||
| Media / Entertainment | 2 | $69B |
|
||
Price history
+650.0% since first listed4 events — show timeline
- 2026-01-12 Listed $420,000 OneKey® MLS as Distributed by MLS Grid
- 2014-07-07 Delisted — HGMLS
- 2014-04-05 Listed — HGMLS
- 2000-04-12 Sold (Public Records) $56,000 Public Records
Property tax history
+6.1%/yrLatest (2025): $9,855 · -2.7% YoY. Source: county tax records.
Cash-flow waterfall
monthlySold comps — $/sqft
last 12 mo · ≤1 miLoading sold comps…