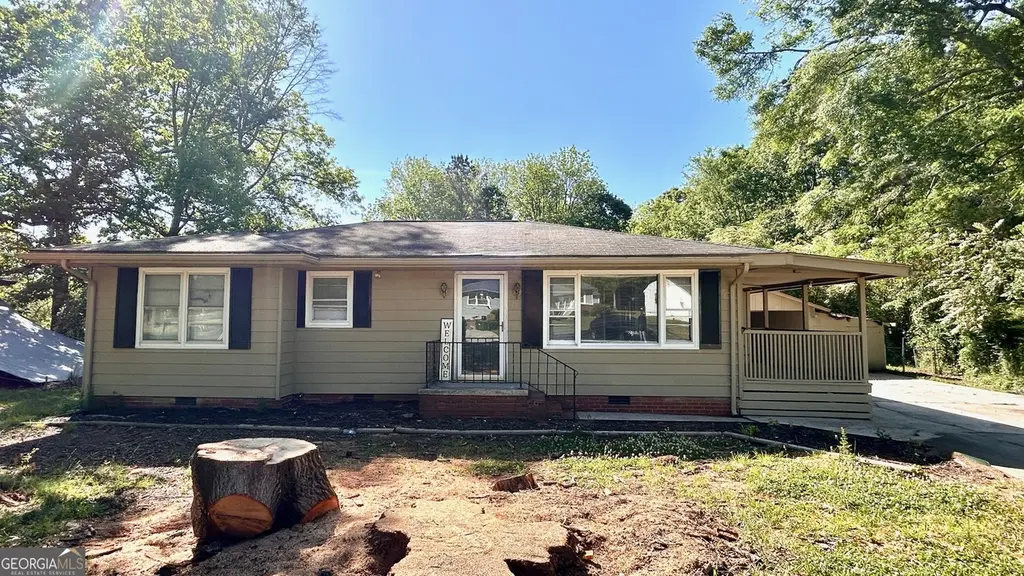
7 Sandy Beach Ter NW · Rome, GA
Flood risk 5/10 · Moderate
- FEMA flood zone
- X (unshaded)
- Chance of flooding over 30 yrs
- 0.67%
- Est. flood insurance / yr
- $507 – $1,088
Fire risk 3/10 · Minor
- Est. fire insurance / yr
- $963 – $1,789
Heat risk 6/10 · Moderate
- Hot days now (above 104°F)
- 7 days/yr
- Hot days in 30 yrs
- 19 days/yr
Wind risk 4/10 · Minor
- Chance of severe wind over 30 yrs
- 18.0%
Air-quality risk 3/10 · Minor
- Unhealthy air days now
- 3 days/yr
- Unhealthy air days in 30 yrs
- 3 days/yr
Risk factors via First Street. Map © Google.
Why this score? — see what drove the C- grade
The composite is a weighted blend of 9 inputs, each scored 0–100. Each bar is that input's sub-score; the figure is the points it added to the 100-point composite (weight × sub-score).
- Cash flow +22.4/30.0
- DSCR +7.2/10.0
- ARV discount +6.7/15.0
- 1% rule +5.4/10.0
- Livability +3.2/5.0
- Rent growth +2.9/5.0
- Condition / age +2.5/5.0
- Schools +2.3/10.0
- Appreciation +0.0/10.0
$170,000
🖨 Deal sheet 📄 Offer letter ✓ Due diligence
Listing remarks
Great house in Garden Lakes. This 3 bedroom, one bath home has updated flooring, fresh paint, new lights and several other updates. Brand new HVAC unit! Sitting on a great lot with a detached garage with workshop + storage. Above ground pool with nice deck. Easy to show!
Key facts
- Fresh paint
- Storage
- Updated flooring
Tags
Neighborhood map
What this means for you Summary
Snapshot
- This is a 3-bed/1.0-bath single-family listed at $170k.
Deal economics
- At list price, monthly cash flow is $284 ($3k/yr) — positive.
- The deal already cash-flows at list — no discount required.
- Meets the 1% rule at list price ($2k rent vs $170k).
- Cap rate 8.3% vs local median 3.3% in Rome — top-decile yield for the area; either an underpriced asset or a hidden risk that comps aren't pricing in. Stress-test before assuming the spread holds.
Location & tenants
- Location reads 64/100 on livability (#266 in GA) — a middle-class / working-renter tenant base. Strengths: cost of living A+, housing A+, health & safety A+; Watch: crime F, amenities F, commute F.
- Rome City (urban): math 27% / reading 29% proficiency, ranked #112 of 174 in GA (top 64%) — low school quality limits family demand, transient renter base, plan for 1-2y turnover; 71% free/reduced lunch — lower-income household profile, screen leases tightly.
- Zoned schools: West End Elementary School (math 47% / reading 39%, grade F, #370 of 1,228 statewide, top 30%, 983 students, 65% FRL); Rome Middle School (math 32% / reading 35%, grade F, #206 of 470 statewide, top 45%, 966 students, 55% FRL); Rome High School (math 12% / reading 15%, grade F, #325 of 424 statewide, top 78%, 2,095 students, 66% FRL).
- Market conditions: Rents rising (+1.7%/yr); 369 active listings in the ZIP; 5 comparable units currently listed for rent nearby; rentals lingering (median 44d on market — plan ~5-8 weeks vacancy on turnover, expect pricing pressure); 100% of comp listings sitting > 30 days — soft ceiling on asking rent; 355 units permitted in Floyd County in 2024 (0 in 5+ unit buildings).
- This rent runs 31% of the median local income ($68k/yr) — at the standard rent-burdened threshold; future hikes will face affordability resistance.
Forward outlook
- Local home prices are declining (-3.0%/yr); year-one equity from $1k of loan paydown is wiped out by about $5k of value loss. Plan a longer hold.
- Floyd County population projected to shrink 6% by 2050 — rents likely to lag national; underwrite the cash flow, not the appreciation.
Negotiation context
- Only 2 days on market — expect competitive offers; lowballing is unlikely to land.
Risks & watch-outs
- Watch-outs: built in 1957 — expect roof / HVAC / electrical / plumbing capex.
- Climate carrying-cost: moderate flood risk; extreme-heat days projected 7→19/yr by 2055 (HVAC capex compounding) — expect insurance premiums to compound above CPI over the hold.
Questions for the listing agent
- Built in 1957 — when were the roof, HVAC, electrical panel, plumbing, and water heater last replaced?
- Is there a deadline driving the sale (1031 exchange, divorce, estate, relocation)? That informs how much negotiation room exists.
- Schools are F-rated, which usually means shorter tenancies and higher turnover. Who's the typical renter profile here, and what's been the actual vacancy rate?
- Crime grade is F in this area — have there been break-ins, vandalism, or insurance claims at this property in the last 3 years? What carrier currently insures it and at what premium?
- What's the average days-on-market for RENTAL listings here right now (not sales)? A rising rental-DOM trend means longer vacancies and softer asking-rent achievability than the comps imply.
- What's the recent tenant-quality profile in this submarket — average credit score on applications, eviction rate, late-payment / NSF rate, and stable-employment percentage? A property-management company in the area should have these aggregated.
- How much new for-sale + rental construction is in the pipeline within 1–3 miles? Heavy new supply typically softens prices + rents 12–24 months out; constrained supply supports both.
Investment metrics
- 1% rule
- 1.04% ✓
- Cap rate
- 8.30%
- Cash-on-cash
- 7.17%
- DSCR
- 1.32
- GRM
- 8.0
CMA / ARV
- ARV (on-the-fly)
- $167,048
- Comps found
- 12
Show comp detail 12 sales within ~0.75 mi
| Address | Dist | Beds/Ba | Sqft | Sold | Price | $/sf | Match |
|---|---|---|---|---|---|---|---|
| 7 Sandy Beach Ter NW | 0.00mi | 3/1.0 | 1,064 (0%) | 1mo | $170,000 | $160 | 99 |
| 107 Harrison Rd NW | 0.23mi | 3/2.0 | 1,052 (-1%) | 12mo | $165,000 | $157 | 74 |
| 119 Plymouth Rd NW | 0.20mi | 3/1.0 | 954 (-10%) | 1mo | $139,900 | $147 | 73 |
| 29 Conway Pl NW | 0.39mi | 3/1.0 | 1,135 (+7%) | 3mo | $175,000 | $154 | 68 |
| 24 Oxford Pl | 0.54mi | 3/1.0 | 1,022 (-4%) | 3mo | $180,000 | $176 | 66 |
| 1 Lindsey Ter NW | 0.39mi | 2/1.5 (-1) | 1,018 (-4%) | 3mo | $150,000 | $147 | 65 |
| 128 Malone Dr NW | 0.53mi | 3/1.0 | 1,000 (-6%) | 3mo | $206,150 | $206 | 62 |
| 20 Tyler St NW | 0.31mi | 3/1.0 | 924 (-13%) | 10mo | $140,000 | $152 | 56 |
| 212 Longmeadow Dr NW | 0.42mi | 3/1.5 | 957 (-10%) | 10mo | $189,900 | $198 | 54 |
| 2628 Lakeridge Cir | 0.52mi | 2/1.0 (-1) | 1,127 (+6%) | 10mo | $160,000 | $142 | 52 |
| 8 Wakefield Pl NW | 0.69mi | 3/1.0 | 988 (-7%) | 11mo | $192,500 | $195 | 47 |
| 3 Conway Pl NW | 0.58mi | 3/1.0 | 1,200 (+13%) | 10mo | $185,000 | $154 | 43 |
Match score weights: distance 35% · size 25% · config 20% · recency 20%. Top-matched comps best support the ARV.
Projected returns pro-forma
-3.0% appreciation · 1.71% rent growth · sell at horizon
- IRR
- -6.7%
- Equity multiple
- 0.75×
- Total profit
- $-11,723
- Equity at exit
- $25,348
- IRR
- 1.3%
- Equity multiple
- 1.08×
- Total profit
- $3,989
- Equity at exit
- $14,698
Cash invested: $47,600 (down + closing). Projections, not guarantees.
Landlord ↔ Tenant lean methodology
- Overall (STATE)
- 90 Strongly Landlord-Friendly
- State Georgia
- 90 Strongly Landlord-Friendly · R+3
- County
- — inherits STATE
- City
- — inherits STATE
ZIP-level market 30165
- Home prices YoY
- -24.6%
- Rents YoY
- 1.7%
- Active inventory
- 369
- Price-to-rent
- 8.0×
Monthly cashflow live
- Estimated rent
- $1,770 medium interval (Pro) →
- Mortgage (P&I)
- −$891
- Tax from tax record
- −$152 /mo · $1,822/yr
- Insurance
- −$71
- HOA
- −$0
- Vacancy / Maint / Mgmt
- −$372
- Net cashflow
- $284
Break-even live
UW: 25.0% down · 7.5% · 30yr · 1.5% tax · 5.0% vac · 8.0% maint · 8.0% mgmt
Financing live
Cash to close
- Down payment
- $42,500
- Closing costs
- $5,100
- Reserves months
- —
- Total cash needed
- —
Loan-product check · same deal, 3 products live
Conventional
25% down · 7.5% · 30yr
- Down + closing
- —
- Monthly P&I
- —
- Monthly cashflow
- —
- DSCR
- —
- Eligible?
- —
Personal DTI + credit; lowest rate.
DSCR
20% down · 8.5% · 30yr
- Down + closing
- —
- Monthly P&I
- —
- Monthly cashflow
- —
- DSCR
- —
- Eligible?
- —
No personal income docs; deal must DSCR.
Hard money
10% down · 12.0% · 12mo
- Down + closing
- —
- Monthly P&I
- —
- Monthly cashflow
- —
- DSCR
- —
- Eligible?
- —
Short-term bridge; refi at stabilization.
Rent comps 5 comps
| Address | Beds | Baths | Sqft | Rent | $/sqft | DOM | Units | Dist |
|---|---|---|---|---|---|---|---|---|
| 122 Malone Dr NW Rome, GA | 3.0 | 2.0 | 1000 | $3,000 | $3.00 | 43d | 1 | 0.51mi |
| 122 Malone Dr Unit 1345543P Rome, GA | 3.0 | 2.0 | 990 | $2,687 | $2.71 | 43d | 1 | 0.51mi |
| 32 Wilma Dr Rome, GA | 3.0 | 2.0 | 1221 | $1,195 | $0.98 | 43d | 1 | 0.80mi |
| 46 Widgeon Way Rome, GA | 3.0 | 2.0 | 1208 | $1,295 | $1.07 | 43d | 1 | 1.03mi |
| 32 Melody Ln NW Rome, GA | 3.0 | 1.0 | 1085 | $1,550 | $1.43 | 43d | 1 | 1.07mi |
Listing history 6 events
-
2026-04-23status Under Contract
-
2026-04-21$170,000 New
-
2026-03-02soldstatus $160,000
-
2006-08-30soldstatus $92,900
-
2006-06-13soldstatus $70,000
-
1998-09-29soldstatus $67,000
ⓘ Source: listings_history table (triggers on properties + properties_extension) + one-shot
backfill from property_details.listing_events for pre-trigger history.
Tax reassessment forecast GA · Resets to sale price
- Current annual tax
- $1,822 · $152/mo
- Projected year-2 tax
- $1,822 · $152/mo
- Expected delta
- $0/yr ($0/mo · 0.0%)
ⓘ Screening estimate from a state-policy table — verify with the county assessor before closing.
Climate risk First Street
- Flood 5/10 Major FEMA zone X (unshaded) · 67% chance over 30 yrs
- Wildfire 3/10 Moderate
- Heat 6/10 Major 7 d/yr ≥104°F today · 19 d/yr by 30 yrs out
- Wind 4/10 Moderate 18% chance of damaging wind over 30 yrs
- Air quality 3/10 Moderate 3 unhealthy d/yr today · 3 by 30 yrs out
Nearby sold comps map
Loading sold comps map…
Walkable amenities ~0.75 mi
Loading nearby amenities…
Taxation est. · year 1
- Rental income
- $21,242
- − Mortgage interest
- −$9,523
- − Property taxes
- −$1,822
- − Insurance
- −$850
- − Repairs & maintenance
- −$1,699
- − Management
- −$1,699
- − Depreciation
- −$4,945
- Taxable income
- $703
- Est. tax owed @ 24.0%
- −$169
- After-tax cash flow
- $3,242/yr
For passive investors: Depreciation is non-cash, so a rental often shows a tax loss while cash-flowing — sheltering income. Rental losses are passive: they offset passive income freely, and up to $25,000/yr can offset ordinary (W-2) income if you actively participate and your MAGI is under $100k (phasing out to $0 by $150k); unused losses carry forward. On sale, claimed depreciation is recaptured at up to 25%, and gains may owe capital-gains tax (a 1031 exchange can defer both). Figures are a year-1 estimate at your 24.0% rate — not tax advice; consult a CPA.
Schools (NCES district)
- District
- Rome City
- NCES district ID
- 1304440
- Math proficiency
- 27% ▼ -14.00%
- Reading proficiency
- 29% ▼ -4.00%
- Median HH income
- $34,889
- Composite
- 23.1/100
- National rank
- #7963
- State rank
- #112 of 174 in GA
Livability — Rome
- Score
- 64/100
- State rank
- #266
- US rank
- #14459
Category grades
Schools grade is shown separately in the Schools card above.
Census & demographics
- Census place
- Rome, GA
- County
- Floyd County · 77,706 people
- City population
- 77,706
- Metro
- Rome, GA
- Population (ZIP)
- 43,001
- Household income
- $68,089
- Rent vs Own
- Severe rent burden
- 1311.0
Population outlook (Floyd County) Hauer SSP2
- Today (2025)
- 96,321 people
- By 2030
- 95,532 · -0.8%
- By 2040
- 93,332 · -3.1%
- By 2050
- 90,850 · -5.7%
- By 2075
- 84,989 · -11.8%
- By 2100
- 76,097 · -21.0%
Race, ethnicity, and origin ACS 2023
- Neighborhood character
- Diverse neighborhood (Simpson 0.57)
- Race & ethnicity
- White 61% Hispanic / Latino 21% Black 12% Two or more races 11% Asian 2%
- Hispanic origin (detail)
- Mexican 13%
- Common ancestry
- Slovak 2% Serbian 1% Italian 1%
- Foreign-born
- 11% · Canada, Vietnam, South Korea
- Languages at home
- 82% English-only · Spanish 16% Other Indo-European 1% Vietnamese 1%
Political lean MEDSL · Floyd
- 2024 margin
- Solid R (+42.0) · D 28.8% · R 70.7%
- 2008→2024 swing
- -5.6pp toward R · 2008: -36.4pp · 2024: -42.0pp
- All cycles
- 2024: R+42.0 2020: R+41.1 2016: R+43.5 2012: R+39.9 2008: R+36.4
Not yet ingested
- Civics
- —
Market trends
- HPI YoY
- ▼ -82.79%
- Current HPI
- 254.3732
- Rent YoY
- ▲ 1.71%
- Metro
- Rome, GA
- State GDP YoY
- ▲ 2.66%
- F500 in state
- 28
Industry mix (Fortune 500 HQ in GA)
| Industry | F500 HQs | Revenue |
|---|---|---|
| Paper / Packaging | 2 | $29B |
|
||
| Retail | 1 | $160B |
|
||
| Transportation / Logistics | 1 | $91B |
|
||
| Airlines | 1 | $62B |
|
||
| Consumer Goods | 1 | $47B |
|
||
| Utilities | 1 | $25B |
|
||
Price history
+153.7% since first listed6 events — show timeline
- 2026-04-23 Pending — GAMLS
- 2026-04-21 Listed $170,000 GAMLS
- 2026-03-02 Sold (Public Records) $160,000 Public Records
- 2006-08-30 Sold (Public Records) $92,900 Public Records
- 2006-06-13 Sold (Public Records) $70,000 Public Records
- 1998-09-29 Sold (Public Records) $67,000 Public Records
Property tax history
+4.7%/yrLatest (2025): $1,822 · +0.8% YoY. Source: county tax records.
Cash-flow waterfall
monthlySold comps — $/sqft
last 12 mo · ≤1 miLoading sold comps…