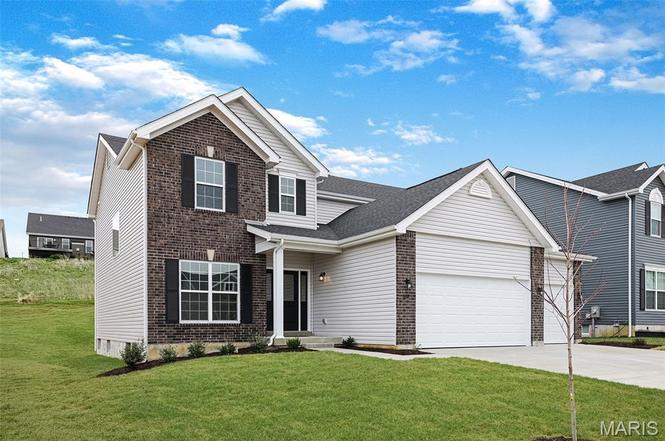
1412 Bloomfield Dr · Eureka, MO
Flood risk 1/10 · Minimal
- FEMA flood zone
- X (unshaded)
- Chance of flooding over 30 yrs
- 0.0%
- Est. flood insurance / yr
- $507 – $1,088
Fire risk 3/10 · Minor
- Est. fire insurance / yr
- $1,054 – $1,958
Heat risk 5/10 · Moderate
- Hot days now (above 108°F)
- 7 days/yr
- Hot days in 30 yrs
- 20 days/yr
Wind risk 2/10 · Minimal
- Chance of severe wind over 30 yrs
- 1.0%
Air-quality risk 2/10 · Minimal
- Unhealthy air days now
- 1 days/yr
- Unhealthy air days in 30 yrs
- 2 days/yr
Risk factors via First Street. Map © Google.
Why this score? — see what drove the D grade
The composite is a weighted blend of 9 inputs, each scored 0–100. Each bar is that input's sub-score; the figure is the points it added to the 100-point composite (weight × sub-score).
- Cash flow +14.9/30.0
- ARV discount +7.5/15.0
- Schools +5.4/10.0
- DSCR +4.6/10.0
- Livability +3.6/5.0
- 1% rule +2.8/10.0
- Rent growth +2.5/5.0
- Condition / age +2.5/5.0
- Appreciation +0.0/10.0
$502,900
🖨 Deal sheet (PDF) 📄 Offer letter ✓ Due diligence
Listing remarks
Introducing the brand-new Nottingham 2-story home by McBride Homes! With 4BR and 2.5BA, this home is ready now! Featuring 3-car garage, 9’ ceilings, 6’ windows, & upgraded wood laminate flooring throughout the main level. The kitchen is a showstopper w/ quartz countertops, 42” Winstead Burlap cabinets, island with breakfast bar, & stainless steel GE appliances. Perfect for relaxing or entertaining, it also has a spacious great room w/ a wall of windows, plus formal living & dining rooms off the welcoming foyer. Upstairs, the primary suite includes a walk-in closet, separate shower, & large tub, along w/ 3 additional bedrooms, a hall bath, & a loft
Key facts
- Quartz countertops
- Spacious great room
- 3 car garage
Tags
Neighborhood map
What this means for you Summary
Snapshot
- This is a 4-bed/2.5-bath other listed at $503k.
Deal economics
- At list price, monthly cash flow is $148 ($2k/yr) — positive.
- The deal already cash-flows at list — no discount required.
- To meet the 1% rule (rent ≥ 1% of price), the offer needs to be $390k (22.4% below list).
- Recommended offer: $390k (22.4% below list) — sets the bar for 1% rule.
- Cap rate 6.6% vs local median 3.2% in Eureka — top-decile yield for the area; either an underpriced asset or a hidden risk that comps aren't pricing in. Stress-test before assuming the spread holds.
Location & tenants
- Location reads 72/100 on livability (#97 in MO) — a middle-class / working-renter tenant base. Strengths: crime A+, employment A+, housing A+; Watch: amenities F, commute F, health & safety F.
- Rockwood R-VI (suburban): math 51% / reading 64% proficiency, ranked #9 of 324 in MO (top 3%) — acceptable for families but not a draw, mixed tenant base, ~2y average lease; only 10% free/reduced lunch — higher-income household profile.
- Zoned schools: Geggie Elem. (math 43% / reading 60%, grade C-, #268 of 1,115 statewide, top 24%, 654 students, 7% FRL); Lasalle Springs Middle (math 46% / reading 59%, grade C+, #54 of 391 statewide, top 14%, 872 students, 12% FRL); Eureka Sr. High (math 36% / reading 66%, grade D+, #109 of 521 statewide, top 21%, 1,712 students, 10% FRL) — zoned schools at 10% FRL track the district average.
- Market conditions: 143 active listings in the ZIP; 1 comparable units currently listed for rent nearby; 807 units permitted in Jefferson County in 2024 (104 in 5+ unit buildings).
Forward outlook
- Local home prices are declining (-3.0%/yr); year-one equity from $3k of loan paydown is wiped out by about $15k of value loss. Plan a longer hold.
Negotiation context
- It's been on market 268 days — a 12% lower offer ($443k) is reasonable based on typical stale-listing flexibility.
Risks & watch-outs
- Climate carrying-cost: extreme-heat days projected 7→20/yr by 2055 (HVAC capex compounding) — expect insurance premiums to compound above CPI over the hold.
Questions for the listing agent
- It's been on market 268 days. Have you received any prior offers? Is the seller open to a 22% concession, seller financing, or rate buy-down credit?
- Why hasn't it sold? Are there any deal-killer items the seller is aware of (foundation, flood, title, zoning, code violations)?
- Is there a deadline driving the sale (1031 exchange, divorce, estate, relocation)? That informs how much negotiation room exists.
- Schools are B-rated — typically a magnet for longer-tenancy family renters. What's the average tenant stay here, and is there a school-zone premium baked into asking?
- The area grade is low — what's the realistic commute time and amenity access for the typical tenant pool here? Any planned neighborhood developments (good or bad) we should know about?
- What's the average days-on-market for RENTAL listings here right now (not sales)? A rising rental-DOM trend means longer vacancies and softer asking-rent achievability than the comps imply.
- What's the recent tenant-quality profile in this submarket — average credit score on applications, eviction rate, late-payment / NSF rate, and stable-employment percentage? A property-management company in the area should have these aggregated.
- How much new for-sale + rental construction is in the pipeline within 1–3 miles? Heavy new supply typically softens prices + rents 12–24 months out; constrained supply supports both.
Investment metrics
- 1% rule
- 0.78% ✗
- Cap rate
- 6.65%
- Cash-on-cash
- 1.26%
- DSCR
- 1.06
- GRM
- 10.7
CMA / ARV
No comps found within radius.
Projected returns pro-forma
-3.0% appreciation · 3.0% rent growth · sell at horizon
- IRR
- -14.4%
- Equity multiple
- 0.49×
- Total profit
- $-72,361
- Equity at exit
- $74,984
- IRR
- -5.7%
- Equity multiple
- 0.63×
- Total profit
- $-52,015
- Equity at exit
- $43,482
Cash invested: $140,812 (down + closing). Projections, not guarantees.
Landlord ↔ Tenant lean methodology
- Overall (STATE)
- 81 Strongly Landlord-Friendly
- State Missouri
- 81 Strongly Landlord-Friendly · R+10
- County
- — inherits STATE
- City
- — inherits STATE
ZIP-level market 63025
- Active inventory
- 143
- Price-to-rent
- 10.7×
Monthly cashflow live
- Estimated rent
- $3,900 medium interval (Pro) →
- Mortgage (P&I)
- −$2,637
- Tax from tax record
- −$87 /mo · $1,038/yr
- Insurance
- −$210
- HOA
- −$0
- Vacancy / Maint / Mgmt
- −$819
- Net cashflow
- $148
Break-even live
Sensitivity live
| Price | -10% $432 | -5% $290 | +0% $148 | +5% $-568 | +10% $-742 |
|---|---|---|---|---|---|
| Rent | -10% $-160 | -5% $-6 | +0% $148 | +5% $302 | +10% $456 |
| Rate | -1.0pp $401 | -0.5pp $276 | base $148 | +0.5pp $17 | +1.0pp $-115 |
UW: 25.0% down · 7.5% · 30yr · 1.5% tax · 5.0% vac · 8.0% maint · 8.0% mgmt
Financing live
Cash to close
- Down payment
- $125,725
- Closing costs
- $15,087
- Reserves months
- —
- Total cash needed
- —
Loan-product check · same deal, 3 products live
Conventional
25% down · 7.5% · 30yr
- Down + closing
- —
- Monthly P&I
- —
- Monthly cashflow
- —
- DSCR
- —
- Eligible?
- —
Personal DTI + credit; lowest rate.
DSCR
20% down · 8.5% · 30yr
- Down + closing
- —
- Monthly P&I
- —
- Monthly cashflow
- —
- DSCR
- —
- Eligible?
- —
No personal income docs; deal must DSCR.
Hard money
10% down · 12.0% · 12mo
- Down + closing
- —
- Monthly P&I
- —
- Monthly cashflow
- —
- DSCR
- —
- Eligible?
- —
Short-term bridge; refi at stabilization.
Rent comps 1 comps
| Address | Beds | Baths | Sqft | Rent | $/sqft | DOM | Units | Dist |
|---|---|---|---|---|---|---|---|---|
| 5233 Mirasol Manor Way Eureka, MO | 4.0 | 2.5 | 2985 | $3,900 | $1.31 | 0d | 1 | 0.39mi |
Listing history 5 events
-
2026-04-24status Pending
-
2026-01-30price $502,900
-
2025-12-22price $501,212
-
2025-10-31price $479,900
-
2025-07-30$499,699 Active
ⓘ Source: listings_history table (triggers on properties + properties_extension) + one-shot
backfill from property_details.listing_events for pre-trigger history.
Tax reassessment forecast MO · Resets to sale price
- Current annual tax
- $1,038 · $87/mo
- Projected year-2 tax
- $4,878 · $407/mo
- Expected delta
- +$3,840/yr (+$320/mo · 369.8%)
ⓘ Screening estimate from a state-policy table — verify with the county assessor before closing.
Climate risk First Street
- Flood 1/10 Low FEMA zone X (unshaded) · 0% chance over 30 yrs
- Wildfire 3/10 Moderate
- Heat 5/10 Major 7 d/yr ≥108°F today · 20 d/yr by 30 yrs out
- Wind 2/10 Low 100% chance of damaging wind over 30 yrs
- Air quality 2/10 Low 1 unhealthy d/yr today · 2 by 30 yrs out
Nearby sold comps map
Loading sold comps map…
Walkable amenities ~0.75 mi
Loading nearby amenities…
Taxation est. · year 1
- Rental income
- $46,800
- − Mortgage interest
- −$28,170
- − Property taxes
- −$1,038
- − Insurance
- −$2,514
- − Repairs & maintenance
- −$3,744
- − Management
- −$3,744
- − Depreciation
- −$14,630
- Taxable loss
- −$7,041
- Est. tax savings @ 24.0%
- +$1,690
- After-tax cash flow
- $3,462/yr
For passive investors: Depreciation is non-cash, so a rental often shows a tax loss while cash-flowing — sheltering income. Rental losses are passive: they offset passive income freely, and up to $25,000/yr can offset ordinary (W-2) income if you actively participate and your MAGI is under $100k (phasing out to $0 by $150k); unused losses carry forward. On sale, claimed depreciation is recaptured at up to 25%, and gains may owe capital-gains tax (a 1031 exchange can defer both). Figures are a year-1 estimate at your 24.0% rate — not tax advice; consult a CPA.
Schools (NCES district)
- District
- Rockwood R-VI
- NCES district ID
- 2926850
- Math proficiency
- 51% ▼ -7.00%
- Reading proficiency
- 64% ▼ -2.00%
- Median HH income
- $98,721
- Composite
- 53.61/100
- National rank
- #1438
- State rank
- #9 of 324 in MO
Livability — Eureka
- Score
- 72/100
- State rank
- #97
- US rank
- #6462
Category grades
Schools grade is shown separately in the Schools card above.
Census & demographics
- Census place
- Eureka, MO
- City population
- 18,483
- Population (ZIP)
- 18,483
Population outlook (Jefferson County) Hauer SSP2
- Today (2025)
- 235,088 people
- By 2030
- 238,365 · +1.4%
- By 2040
- 240,156 · +2.2%
- By 2050
- 234,651 · -0.2%
- By 2075
- 214,569 · -8.7%
- By 2100
- 179,697 · -23.6%
Race, ethnicity, and origin ACS 2023
- Neighborhood character
- Predominantly White (86%)
- Race & ethnicity
- White 86% Two or more races 8% Hispanic / Latino 4% Asian 3%
- Common ancestry
- Italian 3% Lithuanian 3% Romanian 3%
- Foreign-born
- 4% · Canada, China, South Korea
- Languages at home
- 94% English-only · Spanish 2% Russian/Polish/Slavic 1% Chinese 1%
Political lean MEDSL · Jefferson
- 2024 margin
- Solid R (+36.7) · D 31.0% · R 67.7% · Other 1.3%
- 2008→2024 swing
- -39.3pp toward R · 2008: 2.5pp · 2024: -36.7pp
- All cycles
- 2024: R+36.7 2020: R+33.9 2016: R+35.3 2012: R+12.7 2008: D+2.5
Not yet ingested
- Civics
- —
Market trends
- HPI YoY
- ▼ -208.60%
- Current HPI
- 203.4691
- Rent YoY
- —
- Metro
- —
- State GDP YoY
- ▲ 1.84%
- F500 in state
- 20
Industry mix (Fortune 500 HQ in MO)
| Industry | F500 HQs | Revenue |
|---|---|---|
| Healthcare | 1 | $163B |
|
||
| Insurance | 1 | $21B |
|
||
| Industrial Technology | 1 | $17B |
|
||
| Retail | 1 | $16B |
|
||
| Industrial Distribution | 1 | $10B |
|
||
| Utilities | 1 | $9B |
|
||
Price history
+0.6% since first listed5 events — show timeline
- 2026-04-24 Pending — MARIS as Distributed by MLS Grid
- 2026-01-30 Price Changed $502,900 MARIS as Distributed by MLS Grid
- 2025-12-22 Price Changed $501,212 MARIS as Distributed by MLS Grid
- 2025-10-31 Price Changed $479,900 MARIS as Distributed by MLS Grid
- 2025-07-30 Listed $499,699 MARIS as Distributed by MLS Grid
Property tax history
+5.2%/yrLatest (2025): $1,038 · +29.3% YoY. Source: county tax records.
Cash-flow waterfall
monthlySold comps — $/sqft
last 12 mo · ≤1 miLoading sold comps…