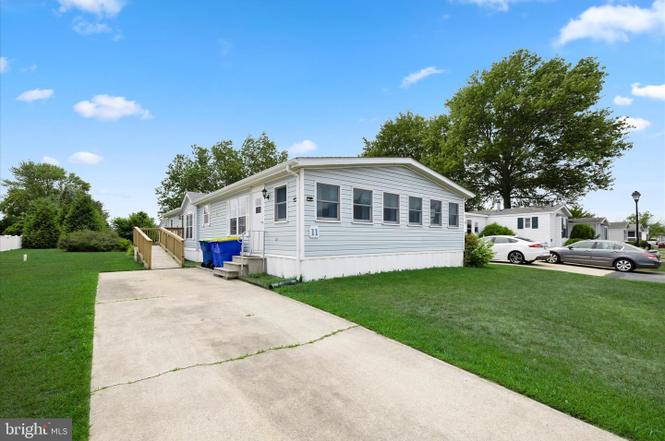
11 Andover Ln #39182 · Lewes, DE
Flood risk 1/10 · Minimal
- FEMA flood zone
- X (unshaded)
- Chance of flooding over 30 yrs
- 0.0%
- Est. flood insurance / yr
- $473 – $860
Fire risk 1/10 · Minimal
- Est. fire insurance / yr
- $476 – $884
Heat risk 8/10 · Major
- Hot days now (above 101°F)
- 7 days/yr
- Hot days in 30 yrs
- 19 days/yr
Wind risk 8/10 · Major
- Chance of severe wind over 30 yrs
- 80.0%
Air-quality risk 2/10 · Minimal
- Unhealthy air days now
- 1 days/yr
- Unhealthy air days in 30 yrs
- 1 days/yr
Risk factors via First Street. Map © Google.
Why this score? — see what drove the B+ grade
The composite is a weighted blend of 9 inputs, each scored 0–100. Each bar is that input's sub-score; the figure is the points it added to the 100-point composite (weight × sub-score).
- Cash flow +30.0/30.0
- ARV discount +15.0/15.0
- 1% rule +10.0/10.0
- DSCR +10.0/10.0
- Schools +4.2/10.0
- Livability +3.4/5.0
- Rent growth +2.7/5.0
- Condition / age +2.5/5.0
- Appreciation +0.0/10.0
$100,000
🖨 Deal sheet (PDF) 📄 Offer letter ✓ Due diligence
Listing remarks MLS
Well cared for, 1 owner home. 55+ community within minutes of the beach, medical facilities, and the outlets. New roof in 2012. This home is in good condition just needs a few updates. Owner will consider all offers. Home is being sold as-is but is in good condition.
Key facts
- Manicured lawn
- Skylight
- Off-street parking
Tags
Property features AI
Finance
- HOA & community: Retirement community amenities; Community center; Land lease (monthly $620; ~1 year remaining)
Exterior
- Parking: Concrete driveway; Off-street driveway parking
- Utilities: Private water; Public sewer; Electric hot water
- Home design: Mobile (pre-1976) home; Senior community (55+); Assessor-provided year built
- Construction: Modular/manufactured construction; Vinyl siding; Shingle/asphalt roof; Pillar/post/pier foundation with crawl space; Windows with screens and storm windows
- Exterior features: Outbuilding(s); Cleared lot; Landscaping; No basement
Interior
- Kitchen: Dishwasher; Icemaker; Refrigerator; Gas oven/range; Exhaust fan
- Bedrooms: Three bedrooms on the main level
- Flooring: Carpet; Vinyl
- Bathrooms: Two full bathrooms (main level)
- Heating & cooling: Propane (leased) heating; Electric cooling
- Interior features: Eat-in kitchen; Combination kitchen and dining area; Ceiling fans; Whirlpool/hot tub; Window treatments; Storm doors
- Laundry & utility: Washer; Electric dryer; Electric water heater
Neighborhood map
What this means for you Summary
Snapshot
- This is a 3-bed/2.0-bath manufactured listed at $100k.
Deal economics
- At list price, monthly cash flow is $1k ($16k/yr) — positive.
- The deal already cash-flows at list — no discount required.
- Meets the 1% rule at list price ($3k rent vs $100k).
- Cap rate 22.5% vs local median 1.8% in Lewes — top-decile yield for the area; either an underpriced asset or a hidden risk that comps aren't pricing in. Stress-test before assuming the spread holds.
Location & tenants
- Location reads 67/100 on livability (#40 in DE) — a middle-class / working-renter tenant base. Strengths: crime A+, employment A+, health & safety A+; Watch: commute F, cost of living F.
- Cape Henlopen School District (town): math 42% / reading 55% proficiency, ranked #5 of 26 in DE (top 19%) — families likely to look elsewhere, expect single-tenant / working-renter base with shorter leases.
- Zoned schools: Milton Elementary School (math 47% / reading 57%, grade C-, #13 of 105 statewide, top 12%, 556 students, 0% FRL); Mariner Middle School (math 32% / reading 48%, grade F, #7 of 36 statewide, top 17%, 664 students, 0% FRL); Cape Henlopen High School (math 26% / reading 51%, grade F, #14 of 40 statewide, top 33%, 1,813 students, 0% FRL) — zoned schools average 0% FRL vs 41% district-wide (41 pts lower); this property's tenant base skews higher-income than the district average.
- Market conditions: Rents flat; 822 active listings in the ZIP; 7 comparable units currently listed for rent nearby; rentals lingering (median 46d on market — plan ~5-8 weeks vacancy on turnover, expect pricing pressure); 57% of comp listings sitting > 30 days — soft ceiling on asking rent; solid renter incomes; 4,354 units permitted in Sussex County in 2024 (344 in 5+ unit buildings).
- This rent runs 32% of the median local income ($97k/yr) — at the standard rent-burdened threshold; future hikes will face affordability resistance.
Forward outlook
- Local home prices are declining (-3.0%/yr); year-one equity from $691 of loan paydown is wiped out by about $3k of value loss. Plan a longer hold.
- Sussex County population projected at +25% by 2050 — long-run rental-demand tailwind backs the buy-and-hold thesis.
- At projected returns (-3.0% appreciation + 0.8% rent growth), your $28k cash investment doubles in ~2 years — after that, you're playing with house money.
Negotiation context
- Only 11 days on market — expect competitive offers; lowballing is unlikely to land.
- 2 sale attempts since 12y ago with the ask held roughly flat each time — persistent listings suggest the price (not the market) is what's stuck; bring a comps-based counter.
- Current owner paid $23k; list at $100k implies a 335% gain — meaningful room to come down on a strong offer.
Risks & watch-outs
- Climate carrying-cost: severe wind risk, 80% chance of damaging wind over 30y; extreme-heat days projected 7→19/yr by 2055 (HVAC capex compounding) — expect insurance premiums to compound above CPI over the hold.
Questions for the listing agent
- Is there a deadline driving the sale (1031 exchange, divorce, estate, relocation)? That informs how much negotiation room exists.
- Schools are B-rated — typically a magnet for longer-tenancy family renters. What's the average tenant stay here, and is there a school-zone premium baked into asking?
- What's the average days-on-market for RENTAL listings here right now (not sales)? A rising rental-DOM trend means longer vacancies and softer asking-rent achievability than the comps imply.
- What's the recent tenant-quality profile in this submarket — average credit score on applications, eviction rate, late-payment / NSF rate, and stable-employment percentage? A property-management company in the area should have these aggregated.
- How much new for-sale + rental construction is in the pipeline within 1–3 miles? Heavy new supply typically softens prices + rents 12–24 months out; constrained supply supports both.
Investment metrics
- 1% rule
- 2.58% ✓
- Cap rate
- 22.48%
- Cash-on-cash
- 57.81%
- DSCR
- 3.57
- GRM
- 3.2
CMA / ARV
- ARV (on-the-fly)
- $137,020
- Comps found
- 1
Show comp detail 1 sale within ~0.75 mi
| Address | Dist | Beds/Ba | Sqft | Sold | Price | $/sf | Match |
|---|---|---|---|---|---|---|---|
| 31702 Siham Rd #2339 | 0.43mi | 3/2.0 | 1,524 (-6%) | 22mo | $130,000 | $85 | 52 |
Match score weights: distance 35% · size 25% · config 20% · recency 20%. Top-matched comps best support the ARV.
Projected returns pro-forma
-3.0% appreciation · 0.77% rent growth · sell at horizon
- IRR
- 53.8%
- Equity multiple
- 3.29×
- Total profit
- $64,080
- Equity at exit
- $14,910
- IRR
- 58.1%
- Equity multiple
- 6.16×
- Total profit
- $144,344
- Equity at exit
- $8,646
Cash invested: $28,000 (down + closing). Projections, not guarantees.
Landlord ↔ Tenant lean methodology
- Overall (STATE)
- 70 Landlord-Friendly
- State Delaware
- 70 Landlord-Friendly · D+7
- County
- — inherits STATE
- City
- — inherits STATE
ZIP-level market 19958
- Rents YoY
- 0.8%
- Active inventory
- 822
- Price-to-rent
- 3.2×
Monthly cashflow live
- Estimated rent
- $2,582 high interval (Pro) →
- Mortgage (P&I)
- −$524
- Tax est. 1.5%
- −$125 /mo · $1,500/yr
- Insurance
- −$42
- HOA
- −$0
- Vacancy / Maint / Mgmt
- −$542
- Net cashflow
- $1,349
Break-even live
Sensitivity live
| Price | -10% $1,418 | -5% $1,383 | +0% $1,349 | +5% $1,314 | +10% $1,280 |
|---|---|---|---|---|---|
| Rent | -10% $1,145 | -5% $1,247 | +0% $1,349 | +5% $1,451 | +10% $1,553 |
| Rate | -1.0pp $1,399 | -0.5pp $1,374 | base $1,349 | +0.5pp $1,323 | +1.0pp $1,297 |
UW: 25.0% down · 7.5% · 30yr · 1.5% tax · 5.0% vac · 8.0% maint · 8.0% mgmt
Financing live
Cash to close
- Down payment
- $25,000
- Closing costs
- $3,000
- Reserves months
- —
- Total cash needed
- —
Loan-product check · same deal, 3 products live
Conventional
25% down · 7.5% · 30yr
- Down + closing
- —
- Monthly P&I
- —
- Monthly cashflow
- —
- DSCR
- —
- Eligible?
- —
Personal DTI + credit; lowest rate.
DSCR
20% down · 8.5% · 30yr
- Down + closing
- —
- Monthly P&I
- —
- Monthly cashflow
- —
- DSCR
- —
- Eligible?
- —
No personal income docs; deal must DSCR.
Hard money
10% down · 12.0% · 12mo
- Down + closing
- —
- Monthly P&I
- —
- Monthly cashflow
- —
- DSCR
- —
- Eligible?
- —
Short-term bridge; refi at stabilization.
Rent comps 7 comps
| Address | Beds | Baths | Sqft | Rent | $/sqft | DOM | Units | Dist |
|---|---|---|---|---|---|---|---|---|
| 20141 Riesling Ln #306 Lewes, DE | 2.0 | 2.0 | 1600 | $2,600 | $1.62 | 46d | 1 | 0.48mi |
| 24258 Zinfandel Ln Lewes, DE | 2.0 | 2.0 | 1300 | $2,300 | $1.77 | 46d | 1 | 0.51mi |
| 12001 Old Vine Blvd Lewes, DE | 1.0–2.0 | 1.0–2.0 | 987 | $3,055 | $3.10 | 15d | 17 | 0.54mi |
| 24238 Zinfandel Ln Lewes, DE | 2.0 | 2.0 | 1300 | $2,300 | $1.77 | 46d | 1 | 0.56mi |
| 17010 Minos Conaway Rd Lewes, DE | 3.0 | 2.0 | 1600 | $2,500 | $1.56 | 46d | 1 | 0.87mi |
| 17432 Slipper Shell Way #5 Lewes, DE | 3.0 | 2.0 | 1840 | $2,150 | $1.17 | 23d | 1 | 1.16mi |
| 18 Greystone Dr Lewes, DE | 3.0 | 2.5 | 2114 | $2,875 | $1.36 | 23d | 1 | 1.38mi |
Listing history 8 events
-
2026-06-22days on market $100,000 Active 11 DOM
-
2026-06-18days on market $100,000 Active 8 DOM
-
2026-06-17days on market $100,000 Active 7 DOM
-
2026-06-16days on market $100,000 Active 6 DOM
-
2026-06-15days on market $100,000 Active 5 DOM
-
2026-06-14days on market $100,000 Active 3 DOM
-
2026-06-13remarks 699-char remark
-
2026-06-13$100,000 Active 2 DOM
ⓘ Source: listings_history table (triggers on properties + properties_extension) + one-shot
backfill from property_details.listing_events for pre-trigger history.
Climate risk First Street
- Flood 1/10 Low FEMA zone X (unshaded) · 0% chance over 30 yrs
- Wildfire 1/10 Low
- Heat 8/10 Severe 7 d/yr ≥101°F today · 19 d/yr by 30 yrs out
- Wind 8/10 Severe 80% chance of damaging wind over 30 yrs
- Air quality 2/10 Low 1 unhealthy d/yr today · 1 by 30 yrs out
Nearby sold comps map
Loading sold comps map…
Walkable amenities ~0.75 mi
Loading nearby amenities…
Taxation est. · year 1
- Rental income
- $30,987
- − Mortgage interest
- −$5,602
- − Property taxes
- −$1,500
- − Insurance
- −$500
- − Repairs & maintenance
- −$2,479
- − Management
- −$2,479
- − Depreciation
- −$2,909
- Taxable income
- $15,519
- Est. tax owed @ 24.0%
- −$3,724
- After-tax cash flow
- $12,463/yr
For passive investors: Depreciation is non-cash, so a rental often shows a tax loss while cash-flowing — sheltering income. Rental losses are passive: they offset passive income freely, and up to $25,000/yr can offset ordinary (W-2) income if you actively participate and your MAGI is under $100k (phasing out to $0 by $150k); unused losses carry forward. On sale, claimed depreciation is recaptured at up to 25%, and gains may owe capital-gains tax (a 1031 exchange can defer both). Figures are a year-1 estimate at your 24.0% rate — not tax advice; consult a CPA.
Schools (NCES district)
- District
- Cape Henlopen School District
- NCES district ID
- 1000170
- Math proficiency
- 42% ▼ -14.00%
- Reading proficiency
- 55% ▼ -10.00%
- Median HH income
- $60,196
- Composite
- 42.47/100
- National rank
- #3214
- State rank
- #5 of 26 in DE
Livability — Lewes
- Score
- 67/100
- State rank
- #40
- US rank
- #11077
Category grades
Schools grade is shown separately in the Schools card above.
Census & demographics
- County
- Sussex County · 82,708 people
- City population
- 31,938
- Metro
- Salisbury, MD-DE
- Population (ZIP)
- 31,938
- Household income
- $97,197
- Rent vs Own
- Severe rent burden
- 545.0
Population outlook (Sussex County) Hauer SSP2
- Today (2025)
- 248,853 people
- By 2030
- 264,464 · +6.3%
- By 2040
- 290,980 · +16.9%
- By 2050
- 311,259 · +25.1%
- By 2075
- 352,488 · +41.6%
- By 2100
- 367,406 · +47.6%
Race, ethnicity, and origin ACS 2023
- Neighborhood character
- Predominantly White (88%)
- Race & ethnicity
- White 88% Two or more races 6% Hispanic / Latino 4% Black 2% Asian 2%
- Common ancestry
- Romanian 6% Slovak 3% Italian 2%
- Foreign-born
- 6% · Canada
- Languages at home
- 93% English-only · Spanish 3% Other Indo-European 1% Russian/Polish/Slavic 1%
Political lean MEDSL · Sussex
- 2024 margin
- R (+11.0) · D 43.9% · R 54.9% · Other 1.2%
- 2008→2024 swing
- -2.4pp toward R · 2008: -8.6pp · 2024: -11.0pp
- All cycles
- 2024: R+11.0 2020: R+11.2 2016: R+22.0 2012: R+13.0 2008: R+8.6
Not yet ingested
- Civics
- —
Market trends
- HPI YoY
- ▼ -204.07%
- Current HPI
- 299.0736
- Rent YoY
- ▲ 0.77%
- Metro
- Salisbury, MD-DE
- State GDP YoY
- —
- F500 in state
- 0
Price history
+263.6% since first listed3 events — show timeline
- 2026-06-10 Listed $100,000 BRIGHT MLS
- 2015-10-02 Sold (MLS) $23,000 BRIGHT MLS
- 2014-10-28 Listed $27,500 BRIGHT MLS
Cash-flow waterfall
monthlySold comps — $/sqft
last 12 mo · ≤1 miLoading sold comps…