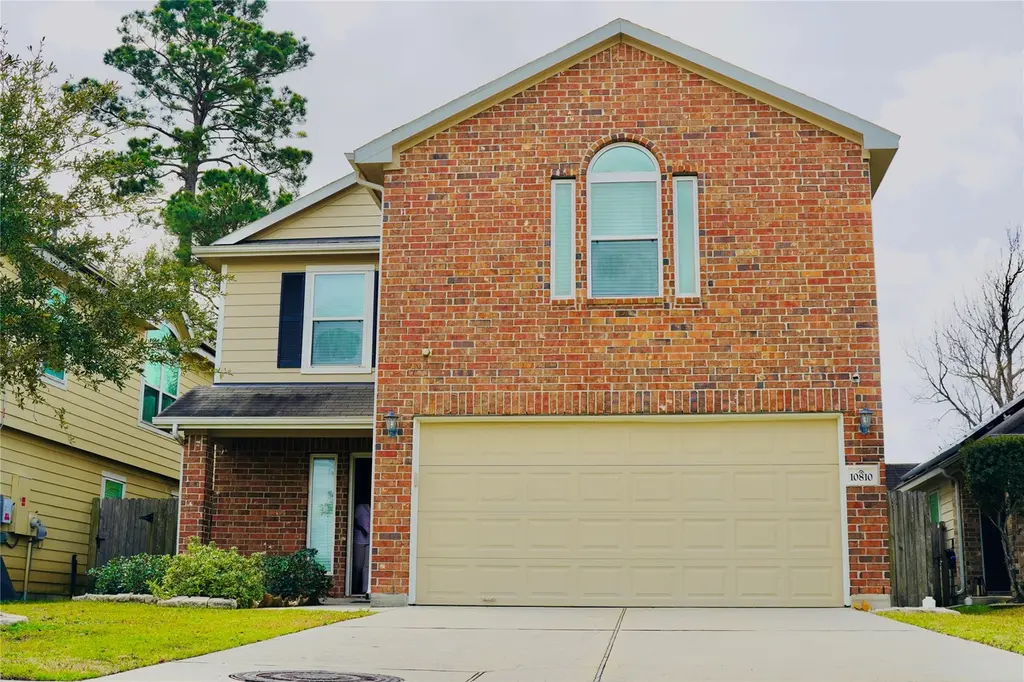
10810 Sun River Falls Dr · Atascocita, TX
Flood risk 4/10 · Minor
- FEMA flood zone
- X (unshaded)
- Chance of flooding over 30 yrs
- 0.22%
- Est. flood insurance / yr
- $507 – $1,088
Fire risk 4/10 · Minor
- Est. fire insurance / yr
- $1,222 – $2,270
Heat risk 9/10 · Severe
- Hot days now (above 111°F)
- 7 days/yr
- Hot days in 30 yrs
- 25 days/yr
Wind risk 9/10 · Severe
- Chance of severe wind over 30 yrs
- 99.0%
Air-quality risk 3/10 · Minor
- Unhealthy air days now
- 2 days/yr
- Unhealthy air days in 30 yrs
- 3 days/yr
Risk factors via First Street. Map © Google.
Why this score? — see what drove the D grade
The composite is a weighted blend of 9 inputs, each scored 0–100. Each bar is that input's sub-score; the figure is the points it added to the 100-point composite (weight × sub-score).
- ARV discount +14.7/15.0
- Cash flow +7.8/30.0
- 1% rule +5.0/10.0
- Schools +3.9/10.0
- Livability +3.5/5.0
- Condition / age +2.5/5.0
- DSCR +1.9/10.0
- Rent growth +1.8/5.0
- Appreciation +0.0/10.0
$230,000
🖨 Deal sheet (PDF) 📄 Offer letter ✓ Due diligence
Listing remarks MLS
This beautiful 4-bedroom, 2.5-bath home is located in a highly desirable neighborhood. The open-concept floor plan connects the kitchen to the breakfast area, while the formal dining room flows into the living room. The kitchen offers access to the laundry room and a 2-car garage, and the spacious backyard is perfect for family gatherings and making memories. Upstairs features a bright and open primary bedroom with an en-suite bathroom, complete with a combo shower and tub plus dual vanities for convenience. The home’s great location provides easy access to major highways, shopping centers, and grocery stores, in an area that continues to grow and develop.
Key facts
- Spacious backyard
- 5,100 sq ft lot
- 2 garage spots
Tags
Neighborhood map
What this means for you Summary
Snapshot
- This is a 4-bed/2.5-bath single-family listed at $230k.
Deal economics
- At list price, monthly cash flow is $-258 ($-3k/yr) — negative.
- To cash-flow at today's rent, offer at most $184k (19.8% below list).
- To meet the 1% rule (rent ≥ 1% of price), the offer needs to be $229k (0.5% below list).
- Recommended offer: $184k (19.8% below list) — sets the bar for cash-flow.
- Cap rate 4.9% vs local median 4.0% in Atascocita — meaningfully above typical; check what's discounted (condition, days-on-market, listing class) to confirm the premium yield is real.
Location & tenants
- Location reads 70/100 on livability (#346 in TX) — a middle-class / working-renter tenant base. Strengths: employment A+, cost of living A+, housing A+; Watch: amenities F, commute F, health & safety F.
- Humble ISD (urban): math 38% / reading 44% proficiency, ranked #262 of 826 in TX (top 32%) — families likely to look elsewhere, expect single-tenant / working-renter base with shorter leases.
- Zoned schools: Ridge Creek El (math 26% / reading 33%, grade F, #2,525 of 4,322 statewide, top 62%, 1,125 students, 74% FRL); Woodcreek Middle (math 46% / reading 49%, grade C-, #408 of 1,662 statewide, top 25%, 1,145 students, 36% FRL); Humble H S (math 15% / reading 31%, grade F, #1,348 of 1,632 statewide, top 83%, 2,867 students, 77% FRL) — zoned schools average 62% FRL vs 32% district-wide (30 pts higher); higher-poverty schools than district average — tighter screening recommended.
- Market conditions: Rents soft (-2.9%/yr); 260 active listings in the ZIP; 8 comparable units currently listed for rent nearby; rentals leasing fast (median 14d on market — plan ~1-2 weeks tenant-placement turnaround); solid renter incomes; 29,883 units permitted in Harris County in 2024 (8,621 in 5+ unit buildings).
- This rent runs 35% of the median local income ($78k/yr) — at the standard rent-burdened threshold; future hikes will face affordability resistance.
Forward outlook
- Local home prices are declining (-3.0%/yr); year-one equity from $2k of loan paydown is wiped out by about $7k of value loss. Plan a longer hold.
- Harris County population projected at +47% by 2050 — long-run rental-demand tailwind backs the buy-and-hold thesis.
Negotiation context
- It's been on market 71 days — a 6% lower offer ($216k) is reasonable based on typical stale-listing flexibility.
- 4 sale attempts; this cycle's ask has dropped $80k (26%) from the opening price — seller is motivated, your offer sets the floor, not the list.
Risks & watch-outs
- Watch-outs: property tax is 3.8% of price.
- Climate carrying-cost: severe wind risk, 99% chance of damaging wind over 30y; extreme-heat days projected 7→25/yr by 2055 (HVAC capex compounding) — expect insurance premiums to compound above CPI over the hold.
Questions for the listing agent
- What do current leases actually rent for vs. the listed asking? Can we see a recent rent roll and the last 12 months of T-12 income?
- It's been on market 71 days. Have you received any prior offers? Is the seller open to a 20% concession, seller financing, or rate buy-down credit?
- Property tax is high relative to price — has the assessment been appealed recently, and will the sale trigger a re-assessment?
- What does the HOA fee cover, when was the last increase, and are there any pending special assessments or reserve-fund shortfalls?
- Why hasn't it sold? Are there any deal-killer items the seller is aware of (foundation, flood, title, zoning, code violations)?
- Is there a deadline driving the sale (1031 exchange, divorce, estate, relocation)? That informs how much negotiation room exists.
- The area grade is low — what's the realistic commute time and amenity access for the typical tenant pool here? Any planned neighborhood developments (good or bad) we should know about?
- What's the average days-on-market for RENTAL listings here right now (not sales)? A rising rental-DOM trend means longer vacancies and softer asking-rent achievability than the comps imply.
- What's the recent tenant-quality profile in this submarket — average credit score on applications, eviction rate, late-payment / NSF rate, and stable-employment percentage? A property-management company in the area should have these aggregated.
- How much new for-sale + rental construction is in the pipeline within 1–3 miles? Heavy new supply typically softens prices + rents 12–24 months out; constrained supply supports both.
Investment metrics
- 1% rule
- 1.00% ✗
- Cap rate
- 4.95%
- Cash-on-cash
- -4.81%
- DSCR
- 0.79
- GRM
- 8.4
CMA / ARV
- ARV (median comp)
- $273,884
- List price
- $230,000
- Delta
- -16.02%
- Verdict
- UNDERPRICED
- Comps
- 20 within 1.0 mi
Show comp detail 12 sales within ~0.75 mi
| Address | Dist | Beds/Ba | Sqft | Sold | Price | $/sf | Match |
|---|---|---|---|---|---|---|---|
| 15214 Central Lakes Dr | 0.31mi | 4/2.0 | 2,280 (-0%) | 6mo | $260,000 | $114 | 79 |
| 10606 Hillside Creek Dr | 0.30mi | 3/2.5 (-1) | 2,295 (+0%) | 8mo | $287,000 | $125 | 74 |
| 11042 Hillside Creek Dr | 0.33mi | 3/2.5 (-1) | 2,232 (-2%) | 4mo | $257,600 | $115 | 72 |
| 15026 Sunset Creek Dr | 0.43mi | 4/2.5 | 2,240 (-2%) | 6mo | $270,000 | $121 | 72 |
| 15103 Silhouette Ridge Dr | 0.27mi | 4/2.5 | 2,425 (+6%) | 8mo | $289,900 | $120 | 71 |
| 15207 Lake Erie Dr | 0.38mi | 4/2.5 | 2,379 (+4%) | 7mo | $279,900 | $118 | 69 |
| 14919 Tranquility Ridge Ct | 0.57mi | 4/2.5 | 2,286 (+0%) | 7mo | $279,000 | $122 | 68 |
| 11315 Harbour Lake Ct | 0.49mi | 4/2.5 | 2,367 (+4%) | 8mo | $294,995 | $125 | 64 |
| 15243 Crescent Brookfield Dr | 0.35mi | 5/2.5 (+1) | 2,462 (+8%) | 4mo | $305,500 | $124 | 63 |
| 15318 Central Lakes Dr | 0.35mi | 4/2.0 | 1,992 (-13%) | 3mo | $259,900 | $130 | 58 |
| 15203 Lake Powell Dr | 0.40mi | 4/2.5 | 2,620 (+15%) | 1mo | $268,000 | $102 | 56 |
| 11410 Sandstone Canyon Dr | 0.54mi | 3/2.0 (-1) | 2,015 (-12%) | 9mo | $289,900 | $144 | 41 |
Match score weights: distance 35% · size 25% · config 20% · recency 20%. Top-matched comps best support the ARV.
Projected returns pro-forma
-3.0% appreciation · 0.0% rent growth · sell at horizon
- IRR
- -28.9%
- Equity multiple
- 0.07×
- Total profit
- $-60,102
- Equity at exit
- $34,294
- IRR
- -56.0%
- Equity multiple
- -0.52×
- Total profit
- $-98,113
- Equity at exit
- $19,886
Cash invested: $64,400 (down + closing). Projections, not guarantees.
Landlord ↔ Tenant lean methodology
- Overall (STATE)
- 87 Strongly Landlord-Friendly
- State Texas
- 87 Strongly Landlord-Friendly · R+5
- County
- — inherits STATE
- City
- — inherits STATE
ZIP-level market 77396
- Home prices YoY
- -22.5%
- Rents YoY
- -2.9%
- Active inventory
- 260
- Price-to-rent
- 8.4×
Monthly cashflow live
- Estimated rent
- $2,289 high interval (Pro) →
- Mortgage (P&I)
- −$1,206
- Tax from tax record
- −$736 /mo · $8,828/yr
- Insurance
- −$96
- HOA
- −$29
- Vacancy / Maint / Mgmt
- −$481
- Net cashflow
- $-258
Break-even live
Sensitivity live
| Price | -10% $-128 | -5% $-193 | +0% $-258 | +5% $-323 | +10% $-389 |
|---|---|---|---|---|---|
| Rent | -10% $-439 | -5% $-349 | +0% $-258 | +5% $-168 | +10% $-77 |
| Rate | -1.0pp $-142 | -0.5pp $-200 | base $-258 | +0.5pp $-318 | +1.0pp $-379 |
UW: 25.0% down · 7.5% · 30yr · 1.5% tax · 5.0% vac · 8.0% maint · 8.0% mgmt
Financing live
Cash to close
- Down payment
- $57,500
- Closing costs
- $6,900
- Reserves months
- —
- Total cash needed
- —
Loan-product check · same deal, 3 products live
Conventional
25% down · 7.5% · 30yr
- Down + closing
- —
- Monthly P&I
- —
- Monthly cashflow
- —
- DSCR
- —
- Eligible?
- —
Personal DTI + credit; lowest rate.
DSCR
20% down · 8.5% · 30yr
- Down + closing
- —
- Monthly P&I
- —
- Monthly cashflow
- —
- DSCR
- —
- Eligible?
- —
No personal income docs; deal must DSCR.
Hard money
10% down · 12.0% · 12mo
- Down + closing
- —
- Monthly P&I
- —
- Monthly cashflow
- —
- DSCR
- —
- Eligible?
- —
Short-term bridge; refi at stabilization.
Rent comps 8 comps
| Address | Beds | Baths | Sqft | Rent | $/sqft | DOM | Units | Dist |
|---|---|---|---|---|---|---|---|---|
| 15031 Silhouette Ridge Dr Humble, TX | 4.0 | 2.5 | 2153 | $2,185 | $1.01 | 13d | 1 | 0.26mi |
| 10638 Harbor Canyon Dr Humble, TX | 4.0 | 3.0 | 2355 | $2,181 | $0.93 | 45d | 1 | 0.28mi |
| 10730 Hillside Creek Dr Humble, TX | 5.0 | 2.5 | 2593 | $2,445 | $0.94 | 7d | 1 | 0.29mi |
| 11347 Needlerock Ct Unit 1310533P Humble, TX | 4.0 | 3.0 | 3239 | $9,388 | $2.90 | 45d | 1 | 0.66mi |
| 11522 Moonlight Ridge Dr Humble, TX | 3.0 | 2.0 | 1749 | $2,336 | $1.34 | 0d | 1 | 0.68mi |
| 12138 Loch Muick Dr Humble, TX | 4.0 | 2.0 | 1887 | $2,411 | $1.28 | 7d | 1 | 1.15mi |
| 9719 Deborah Colony Ln Humble, TX | 4.0 | 2.5 | 2746 | $2,445 | $0.89 | 45d | 1 | 1.35mi |
| 15713 Saxton Mist Dr Humble, TX | 3.0–4.0 | 2.5–3.5 | 1643 | $2,858 | $1.74 | 0d | 35 | 1.42mi |
HOA detail
- Monthly dues
- $29 · $348/yr
Listing history 17 events
-
2026-06-13statusdays on market $230,000 Pending 71 DOM
-
2026-06-09days on market $230,000 Active 70 DOM
-
2026-06-08days on market $230,000 Active 69 DOM
-
2026-06-07days on market $230,000 Active 68 DOM
-
2026-06-04days on market $230,000 Active 65 DOM
-
2026-06-03days on market $230,000 Active 64 DOM
-
2026-06-02days on market $230,000 Active 63 DOM
-
2026-06-01days on market $230,000 Active 62 DOM
-
2026-05-31days on market $230,000 Active 61 DOM
-
2026-05-06price $270,000 670-char remark
Show marketing remark (670 chars)
This beautiful 4-bedroom, 2.5-bath home is located in a highly desirable neighborhood. The open-concept floor plan connects the kitchen to the breakfast area, while the formal dining room flows into the living room. The kitchen offers access to the laundry room and a 2-car garage, and the spacious backyard is perfect for family gatherings and making memories. Upstairs features a bright and open primary bedroom with an en-suite bathroom, complete with a combo shower and tub plus dual vanities for convenience. The home’s great location provides easy access to major highways, shopping centers, and grocery stores, in an area that continues to grow and develop.
-
2026-03-31$310,000 Active 670-char remark
Show marketing remark (670 chars)
This beautiful 4-bedroom, 2.5-bath home is located in a highly desirable neighborhood. The open-concept floor plan connects the kitchen to the breakfast area, while the formal dining room flows into the living room. The kitchen offers access to the laundry room and a 2-car garage, and the spacious backyard is perfect for family gatherings and making memories. Upstairs features a bright and open primary bedroom with an en-suite bathroom, complete with a combo shower and tub plus dual vanities for convenience. The home’s great location provides easy access to major highways, shopping centers, and grocery stores, in an area that continues to grow and develop.
-
2026-03-31historical
Show marketing remark (670 chars)
This beautiful 4-bedroom, 2.5-bath home is located in a highly desirable neighborhood. The open-concept floor plan connects the kitchen to the breakfast area, while the formal dining room flows into the living room. The kitchen offers access to the laundry room and a 2-car garage, and the spacious backyard is perfect for family gatherings and making memories. Upstairs features a bright and open primary bedroom with an en-suite bathroom, complete with a combo shower and tub plus dual vanities for convenience. The home’s great location provides easy access to major highways, shopping centers, and grocery stores, in an area that continues to grow and develop.
-
2026-03-17status Active
-
2026-03-17status Active
-
2026-03-16historical
-
2026-03-16historical
-
2026-02-05$310,000 Active
ⓘ Source: listings_history table (triggers on properties + properties_extension) + one-shot
backfill from property_details.listing_events for pre-trigger history.
Tax reassessment forecast TX · Resets to sale price
- Current annual tax
- $8,828 · $736/mo
- Projected year-2 tax
- $8,828 · $736/mo
- Expected delta
- $0/yr ($0/mo · 0.0%)
ⓘ Screening estimate from a state-policy table — verify with the county assessor before closing.
Climate risk First Street
- Flood 4/10 Moderate FEMA zone X (unshaded) · 22% chance over 30 yrs
- Wildfire 4/10 Moderate
- Heat 9/10 Extreme 7 d/yr ≥111°F today · 25 d/yr by 30 yrs out
- Wind 9/10 Extreme 99% chance of damaging wind over 30 yrs
- Air quality 3/10 Moderate 2 unhealthy d/yr today · 3 by 30 yrs out
Nearby sold comps map
Loading sold comps map…
Walkable amenities ~0.75 mi
Loading nearby amenities…
Taxation est. · year 1
- Rental income
- $27,468
- − Mortgage interest
- −$12,884
- − Property taxes
- −$8,828
- − Insurance
- −$1,150
- − Repairs & maintenance
- −$2,197
- − Management
- −$2,197
- − HOA
- −$348
- − Depreciation
- −$6,691
- Taxable loss
- −$6,827
- Est. tax savings @ 24.0%
- +$1,638
- After-tax cash flow
- $-1,461/yr
For passive investors: Depreciation is non-cash, so a rental often shows a tax loss while cash-flowing — sheltering income. Rental losses are passive: they offset passive income freely, and up to $25,000/yr can offset ordinary (W-2) income if you actively participate and your MAGI is under $100k (phasing out to $0 by $150k); unused losses carry forward. On sale, claimed depreciation is recaptured at up to 25%, and gains may owe capital-gains tax (a 1031 exchange can defer both). Figures are a year-1 estimate at your 24.0% rate — not tax advice; consult a CPA.
Schools (NCES district)
- District
- Humble ISD
- NCES district ID
- 4823910
- Math proficiency
- 38% ▼ -11.00%
- Reading proficiency
- 44% ▼ -7.00%
- Median HH income
- $83,946
- Composite
- 38.55/100
- National rank
- #4171
- State rank
- #262 of 826 in TX
Livability — Atascocita
- Score
- 70/100
- State rank
- #346
- US rank
- #7586
Category grades
Schools grade is shown separately in the Schools card above.
Census & demographics
- Census place
- Atascocita, TX
- County
- Harris County · 4,702,590 people
- City population
- 79,538
- Metro
- Houston-The Woodlands-Sugar Land, TX
- Population (ZIP)
- 61,735
- Household income
- $78,169
- Rent vs Own
- Severe rent burden
- 1655.0
Population outlook (Harris County) Hauer SSP2
- Today (2025)
- 5,571,493 people
- By 2030
- 6,089,821 · +9.3%
- By 2040
- 7,142,806 · +28.2%
- By 2050
- 8,185,864 · +46.9%
- By 2075
- 10,574,329 · +89.8%
- By 2100
- 12,109,958 · +117.4%
Race, ethnicity, and origin ACS 2023
- Neighborhood character
- Diverse neighborhood (Simpson 0.67)
- Race & ethnicity
- Hispanic / Latino 46% Black 29% Two or more races 19% White 19% Asian 4%
- Hispanic origin (detail)
- Mexican 36%
- Common ancestry
- Lithuanian 1% Slovak 1% Romanian 1%
- Foreign-born
- 18% · Canada, Vietnam, Jamaica
- Languages at home
- 58% English-only · Spanish 37% Other Indo-European 1% Vietnamese 1%
Political lean MEDSL · Harris
- 2024 margin
- Lean D (+5.5) · D 52.0% · R 46.4% · Other 1.6%
- 2008→2024 swing
- +3.9pp toward D · 2008: 1.6pp · 2024: 5.5pp
- All cycles
- 2024: D+5.5 2020: D+13.3 2016: D+12.4 2012: D+0.1 2008: D+1.6
Not yet ingested
- Civics
- —
Market trends
- HPI YoY
- ▼ -70.66%
- Current HPI
- 243.7012
- Rent YoY
- ▼ -2.92%
- Metro
- Houston-The Woodlands-Sugar Land, TX
- State GDP YoY
- ▲ 3.95%
- F500 in state
- 110
Industry mix (Fortune 500 HQ in TX)
| Industry | F500 HQs | Revenue |
|---|---|---|
| Energy | 16 | $1,198B |
|
||
| Technology | 5 | $198B |
|
||
| Engineering / Construction | 4 | $72B |
|
||
| Energy Services | 3 | $60B |
|
||
| Utilities | 3 | $41B |
|
||
| Healthcare | 2 | $330B |
|
||
Price history
-12.9% since first listed8 events — show timeline
- 2026-05-06 Price Changed $270,000 HARMLS
- 2026-03-31 Listing Removed — HARMLS
- 2026-03-31 Listed $310,000 HARMLS
- 2026-03-17 Relisted — HARMLS
- 2026-03-17 Relisted — HARMLS
- 2026-03-16 Listing Removed — HARMLS
- 2026-03-16 Listing Removed — HARMLS
- 2026-02-05 Listed $310,000 HARMLS
Property tax history
+33.9%/yrLatest (2025): $8,828 · -1.5% YoY. Source: county tax records.
Cash-flow waterfall
monthlySold comps — $/sqft
last 12 mo · ≤1 miLoading sold comps…