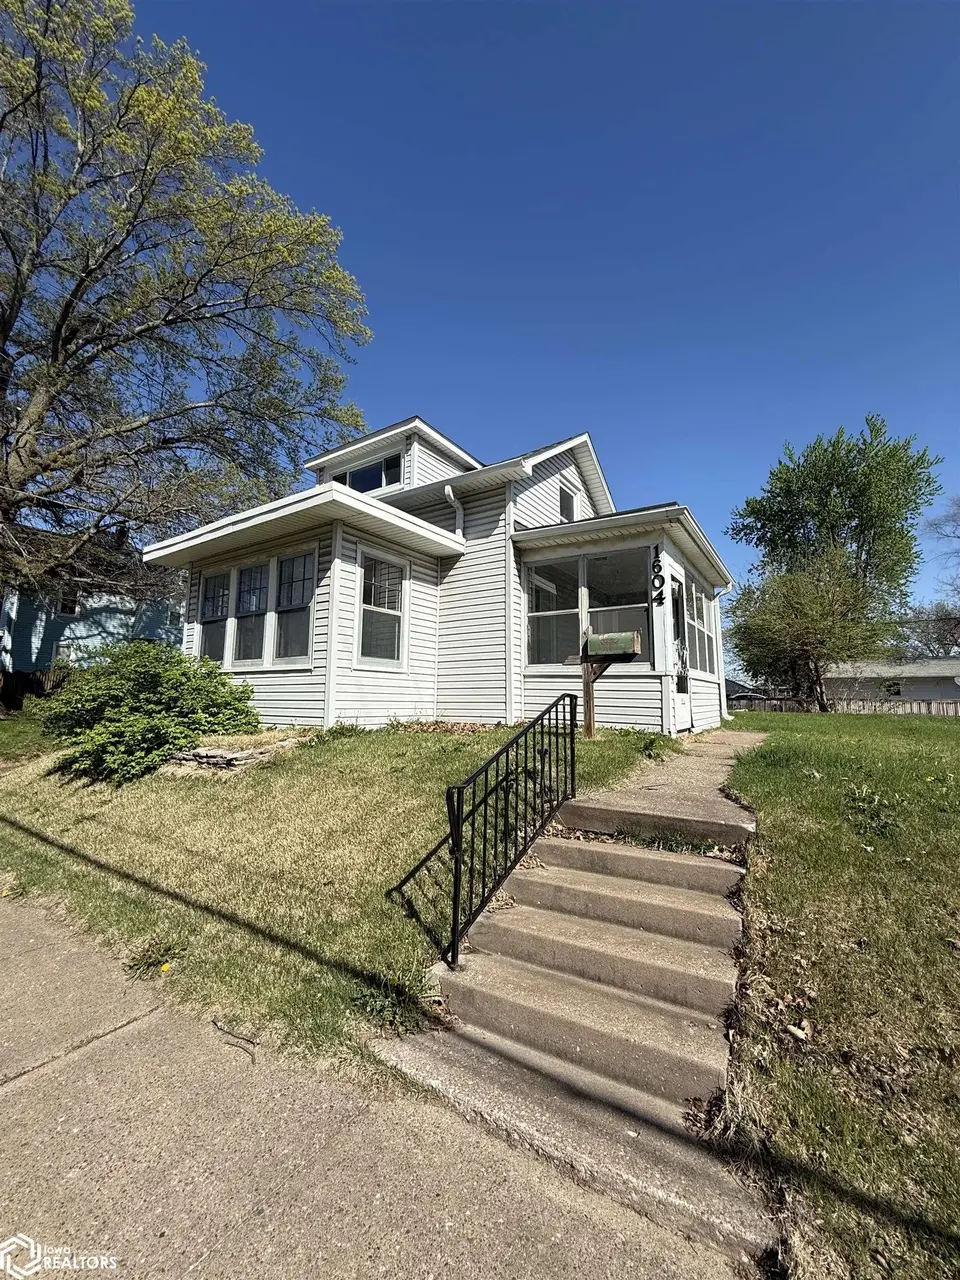
1604 Division St · Burlington, IA
Flood risk 1/10 · Minimal
- FEMA flood zone
- X (unshaded)
- Chance of flooding over 30 yrs
- 0.0%
- Est. flood insurance / yr
- $473 – $860
Fire risk 1/10 · Minimal
- Est. fire insurance / yr
- $902 – $1,676
Heat risk 3/10 · Minor
- Hot days now (above 106°F)
- 7 days/yr
- Hot days in 30 yrs
- 16 days/yr
Wind risk 2/10 · Minimal
- Chance of severe wind over 30 yrs
- —
Air-quality risk 2/10 · Minimal
- Unhealthy air days now
- 0 days/yr
- Unhealthy air days in 30 yrs
- 1 days/yr
Risk factors via First Street. Map © Google.
Why this score? — see what drove the B+ grade
The composite is a weighted blend of 9 inputs, each scored 0–100. Each bar is that input's sub-score; the figure is the points it added to the 100-point composite (weight × sub-score).
- Cash flow +30.0/30.0
- ARV discount +13.2/15.0
- 1% rule +10.0/10.0
- DSCR +10.0/10.0
- Schools +4.0/10.0
- Livability +3.7/5.0
- Rent growth +2.5/5.0
- Condition / age +2.5/5.0
- Appreciation +0.0/10.0
$62,000
🖨 Deal sheet 📄 Offer letter ✓ Due diligence
Listing remarks MLS
Darling 2-bedroom, 1-bath home located at 1604 Division St! Beautiful hardwood flooring throughout the main level in the dining room, living room & bedroom! Natural light pours in, creating a bright and welcoming atmosphere throughout the home. The second bedroom is located upstairs, with ample storage space in the upstairs closet. New roof in 2020. Move-in ready home with character and charm!
Key facts
- Hardwood flooring
- Ample storage space
- Natural light
Tags
Neighborhood map
What this means for you Summary
Snapshot
- This is a 2-bed/1.0-bath single-family listed at $62k.
Deal economics
- At list price, monthly cash flow is $365 ($4k/yr) — positive.
- The deal already cash-flows at list — no discount required.
- Meets the 1% rule at list price ($991 rent vs $62k).
- Recommended offer: $60k (3.0% below list) — sets the bar for market timing.
- Cap rate 13.4% vs local median 6.0% in Burlington — top-decile yield for the area; either an underpriced asset or a hidden risk that comps aren't pricing in. Stress-test before assuming the spread holds.
Location & tenants
- Location reads 73/100 on livability (#287 in IA) — a middle-class / working-renter tenant base. Strengths: cost of living A+, housing A+, health & safety A+; Watch: crime D+, employment D, amenities F.
- Burlington Community School District (town): math 42% / reading 54% proficiency, ranked #286 of 289 in IA (top 99%) — families likely to look elsewhere, expect single-tenant / working-renter base with shorter leases.
- Market conditions: 184 active listings in the ZIP; 6 comparable units currently listed for rent nearby; rentals lingering (median 44d on market — plan ~5-8 weeks vacancy on turnover, expect pricing pressure); 100% of comp listings sitting > 30 days — soft ceiling on asking rent; 53 units permitted in Des Moines County in 2024 (40 in 5+ unit buildings).
Forward outlook
- Local home prices are declining (-3.0%/yr); year-one equity from $429 of loan paydown is wiped out by about $2k of value loss. Plan a longer hold.
- Des Moines County population projected to shrink 6% by 2050 — rents likely to lag national; underwrite the cash flow, not the appreciation.
- At projected returns (-3.0% appreciation + 3.0% rent growth), your $17k cash investment doubles in ~5 years — after that, you're playing with house money.
Negotiation context
- It's been on market 60 days — a 3% lower offer ($60k) is reasonable based on typical stale-listing flexibility.
- 2 sale attempts since 10y ago; this cycle's ask has dropped $7k (10%) from the opening price — seller is motivated, your offer sets the floor, not the list.
- Current owner paid $42k; 48% above their basis — modest negotiation headroom, anchor on the comps not their cost.
Risks & watch-outs
- Watch-outs: built in 1900 — expect roof / HVAC / electrical / plumbing capex.
Questions for the listing agent
- It's been on market 60 days. Have you received any prior offers? Is the seller open to a 3% concession, seller financing, or rate buy-down credit?
- Built in 1900 — when were the roof, HVAC, electrical panel, plumbing, and water heater last replaced?
- Is there a deadline driving the sale (1031 exchange, divorce, estate, relocation)? That informs how much negotiation room exists.
- Crime grade is D in this area — have there been break-ins, vandalism, or insurance claims at this property in the last 3 years? What carrier currently insures it and at what premium?
- What's the average days-on-market for RENTAL listings here right now (not sales)? A rising rental-DOM trend means longer vacancies and softer asking-rent achievability than the comps imply.
- What's the recent tenant-quality profile in this submarket — average credit score on applications, eviction rate, late-payment / NSF rate, and stable-employment percentage? A property-management company in the area should have these aggregated.
- How much new for-sale + rental construction is in the pipeline within 1–3 miles? Heavy new supply typically softens prices + rents 12–24 months out; constrained supply supports both.
Investment metrics
- 1% rule
- 1.60% ✓
- Cap rate
- 13.36%
- Cash-on-cash
- 25.23%
- DSCR
- 2.12
- GRM
- 5.2
CMA / ARV
- ARV (median comp)
- $70,956
- List price
- $62,000
- Delta
- -12.62%
- Verdict
- UNDERPRICED
- Comps
- 20 within 1.0 mi
Show comp detail 12 sales within ~0.75 mi
| Address | Dist | Beds/Ba | Sqft | Sold | Price | $/sf | Match |
|---|---|---|---|---|---|---|---|
| 564 S Central Ave Ave | 0.57mi | 2/1.0 | 1,122 (+3%) | 1mo | $66,500 | $59 | 68 |
| 235 S 8th Street St | 0.52mi | 3/1.0 (+1) | 1,056 (-3%) | 3mo | $80,000 | $76 | 63 |
| 214 Shields St | 0.61mi | 3/1.5 (+1) | 1,092 (0%) | 4mo | $125,000 | $114 | 61 |
| 104 S Leebrick St | 0.12mi | 3/2.0 (+1) | 1,248 (+14%) | 2mo | $94,000 | $75 | 60 |
| 2300 West Ave | 0.65mi | 2/2.0 | 1,146 (+5%) | 2mo | $170,000 | $148 | 56 |
| 320 N Plane St N | 0.47mi | 2/1.0 | 944 (-14%) | 0mo | $110,150 | $117 | 55 |
| 671 Higbee Ave | 0.44mi | 3/1.0 (+1) | 1,241 (+14%) | 2mo | $27,000 | $22 | 50 |
| 816 Haskell St | 0.64mi | 3/1.0 (+1) | 1,172 (+7%) | 5mo | $140,000 | $119 | 49 |
| 801 Angular St | 0.67mi | 2/2.0 | 1,182 (+8%) | 5mo | $25,000 | $21 | 46 |
| 2600 Amelia St | 0.60mi | 3/1.5 (+1) | 1,186 (+9%) | 6mo | $203,000 | $171 | 46 |
| 612 S Central Ave | 0.61mi | 2/1.0 | 936 (-14%) | 3mo | $70,000 | $75 | 45 |
| 1308 Plank St | 0.52mi | 3/1.0 (+1) | 1,248 (+14%) | 6mo | $90,000 | $72 | 42 |
Match score weights: distance 35% · size 25% · config 20% · recency 20%. Top-matched comps best support the ARV.
Projected returns pro-forma
-3.0% appreciation · 3.0% rent growth · sell at horizon
- IRR
- 18.8%
- Equity multiple
- 1.76×
- Total profit
- $13,211
- Equity at exit
- $9,244
- IRR
- 27.1%
- Equity multiple
- 3.39×
- Total profit
- $41,476
- Equity at exit
- $5,361
Cash invested: $17,360 (down + closing). Projections, not guarantees.
Landlord ↔ Tenant lean methodology
- Overall (STATE)
- 83 Strongly Landlord-Friendly
- State Iowa
- 83 Strongly Landlord-Friendly · R+6
- County
- — inherits STATE
- City
- — inherits STATE
ZIP-level market 52601
- Active inventory
- 184
- Price-to-rent
- 5.2×
Monthly cashflow live
- Estimated rent
- $991 high interval (Pro) →
- Mortgage (P&I)
- −$325
- Tax from tax record
- −$67 /mo · $802/yr
- Insurance
- −$26
- HOA
- −$0
- Vacancy / Maint / Mgmt
- −$208
- Net cashflow
- $365
Break-even live
UW: 25.0% down · 7.5% · 30yr · 1.5% tax · 5.0% vac · 8.0% maint · 8.0% mgmt
Financing live
Cash to close
- Down payment
- $15,500
- Closing costs
- $1,860
- Reserves months
- —
- Total cash needed
- —
Loan-product check · same deal, 3 products live
Conventional
25% down · 7.5% · 30yr
- Down + closing
- —
- Monthly P&I
- —
- Monthly cashflow
- —
- DSCR
- —
- Eligible?
- —
Personal DTI + credit; lowest rate.
DSCR
20% down · 8.5% · 30yr
- Down + closing
- —
- Monthly P&I
- —
- Monthly cashflow
- —
- DSCR
- —
- Eligible?
- —
No personal income docs; deal must DSCR.
Hard money
10% down · 12.0% · 12mo
- Down + closing
- —
- Monthly P&I
- —
- Monthly cashflow
- —
- DSCR
- —
- Eligible?
- —
Short-term bridge; refi at stabilization.
Rent comps 6 comps
| Address | Beds | Baths | Sqft | Rent | $/sqft | DOM | Units | Dist |
|---|---|---|---|---|---|---|---|---|
| 1601 Division St Burlington, IA | 3.0 | 1.0 | 1440 | $1,100 | $0.76 | 43d | 1 | 0.05mi |
| 116 N 5th St Unit 402 Burlington, IA | 1.0 | 1.0 | 1025 | $1,020 | $1.00 | 43d | 1 | 0.79mi |
| 116 N 4th St Unit 205 Burlington, IA | 1.0 | 1.0 | 930 | $900 | $0.97 | 43d | 1 | 0.84mi |
| 116 N 4th St Unit 214 Burlington, IA | 2.0 | 1.0 | 1205 | $1,295 | $1.07 | 43d | 1 | 0.84mi |
| 2645 Newbury Cir Burlington, IA | 2.0 | 1.0 | 825 | $825 | $1.00 | 43d | 3 | 0.88mi |
| 2911 Market St Unit 2909 Burlington, IA | 2.0 | 1.0 | 720 | $625 | $0.87 | 43d | 1 | 0.97mi |
Listing history 20 events
-
2026-06-19days on market $62,000 Active 60 DOM
-
2026-06-18days on market $62,000 Active 59 DOM
-
2026-06-17days on market $62,000 Active 58 DOM
-
2026-06-16days on market $62,000 Active 57 DOM
-
2026-06-15days on market $62,000 Active 56 DOM
-
2026-06-14days on market $62,000 Active 54 DOM
-
2026-06-12days on market $62,000 Active 53 DOM
-
2026-06-09days on market $62,000 Active 50 DOM
-
2026-06-08days on market $62,000 Active 49 DOM
-
2026-06-07days on market $62,000 Active 48 DOM
-
2026-06-07days on market $62,000 Active 47 DOM
-
2026-06-03days on market $62,000 Active 44 DOM
-
2026-06-02days on market $62,000 Active 43 DOM
-
2026-06-01days on market $62,000 Active 42 DOM
-
2026-05-31days on market $62,000 Active 41 DOM
-
2026-05-30days on market $62,000 Active 40 DOM
-
2026-04-30price $62,000 402-char remark
Show marketing remark (402 chars)
Darling 2-bedroom, 1-bath home located at 1604 Division St! Beautiful hardwood flooring throughout the main level in the dining room, living room & bedroom! Natural light pours in, creating a bright and welcoming atmosphere throughout the home. The second bedroom is located upstairs, with ample storage space in the upstairs closet. New roof in 2020. Move-in ready home with character and charm!
-
2026-04-20$69,000 Active 402-char remark
Show marketing remark (402 chars)
Darling 2-bedroom, 1-bath home located at 1604 Division St! Beautiful hardwood flooring throughout the main level in the dining room, living room & bedroom! Natural light pours in, creating a bright and welcoming atmosphere throughout the home. The second bedroom is located upstairs, with ample storage space in the upstairs closet. New roof in 2020. Move-in ready home with character and charm!
-
2016-10-12soldstatus $42,000 107-char remark
Show marketing remark (107 chars)
1 1/2 story, 2 bedroom, separate dining room, enclosed front porch, large side yard, detached 2 car garage.
-
2016-08-16$48,000 107-char remark
Show marketing remark (107 chars)
1 1/2 story, 2 bedroom, separate dining room, enclosed front porch, large side yard, detached 2 car garage.
ⓘ Source: listings_history table (triggers on properties + properties_extension) + one-shot
backfill from property_details.listing_events for pre-trigger history.
Tax reassessment forecast IA · Partial reset (capped growth)
- Current annual tax
- $802 · $67/mo
- Projected year-2 tax
- $888 · $74/mo
- Expected delta
- +$86/yr (+$7/mo · 10.7%)
ⓘ Screening estimate from a state-policy table — verify with the county assessor before closing.
Climate risk First Street
- Flood 1/10 Low FEMA zone X (unshaded) · 0% chance over 30 yrs
- Wildfire 1/10 Low
- Heat 3/10 Moderate 7 d/yr ≥106°F today · 16 d/yr by 30 yrs out
- Wind 2/10 Low
- Air quality 2/10 Low 0 unhealthy d/yr today · 1 by 30 yrs out
Nearby sold comps map
Loading sold comps map…
Walkable amenities ~0.75 mi
Loading nearby amenities…
Taxation est. · year 1
- Rental income
- $11,891
- − Mortgage interest
- −$3,473
- − Property taxes
- −$802
- − Insurance
- −$310
- − Repairs & maintenance
- −$951
- − Management
- −$951
- − Depreciation
- −$1,804
- Taxable income
- $3,600
- Est. tax owed @ 24.0%
- −$864
- After-tax cash flow
- $3,516/yr
For passive investors: Depreciation is non-cash, so a rental often shows a tax loss while cash-flowing — sheltering income. Rental losses are passive: they offset passive income freely, and up to $25,000/yr can offset ordinary (W-2) income if you actively participate and your MAGI is under $100k (phasing out to $0 by $150k); unused losses carry forward. On sale, claimed depreciation is recaptured at up to 25%, and gains may owe capital-gains tax (a 1031 exchange can defer both). Figures are a year-1 estimate at your 24.0% rate — not tax advice; consult a CPA.
Schools (NCES district)
- District
- Burlington Community School District
- NCES district ID
- 1905790
- Math proficiency
- 42% ▼ -4.00%
- Reading proficiency
- 54% ▼ -1.00%
- Median HH income
- $41,833
- Composite
- 40.3/100
- National rank
- #3753
- State rank
- #286 of 289 in IA
Livability — Burlington
- Score
- 73/100
- State rank
- #287
- US rank
- #5540
Category grades
Schools grade is shown separately in the Schools card above.
Census & demographics
- Census place
- Burlington, IA
- County
- Des Moines County · 27,341 people
- City population
- 27,341
- Metro
- Burlington, IA-IL
- Population (ZIP)
- 27,341
- Household income
- $60,983
- Rent vs Own
- Severe rent burden
- 963.0
Population outlook (Des Moines County) Hauer SSP2
- Today (2025)
- 39,735 people
- By 2030
- 39,257 · -1.2%
- By 2040
- 38,090 · -4.1%
- By 2050
- 37,156 · -6.5%
- By 2075
- 36,905 · -7.1%
- By 2100
- 37,222 · -6.3%
Race, ethnicity, and origin ACS 2023
- Neighborhood character
- Predominantly White (83%)
- Race & ethnicity
- White 83% Two or more races 8% Black 5% Hispanic / Latino 4% Asian 1%
- Common ancestry
- Iranian 2% Lithuanian 2% Slovak 2%
- Foreign-born
- 3% · Canada
- Languages at home
- 95% English-only · Spanish 3% Other Asian/Pacific 1%
Political lean MEDSL · Des Moines
- 2024 margin
- R (+15.1) · D 41.8% · R 56.8% · Other 1.4%
- 2008→2024 swing
- -38.1pp toward R · 2008: 23.0pp · 2024: -15.1pp
- All cycles
- 2024: R+15.1 2020: R+8.5 2016: R+7.0 2012: D+18.5 2008: D+23.0
Not yet ingested
- Civics
- —
Market trends
- HPI YoY
- ▼ -83.48%
- Current HPI
- 149.7662
- Rent YoY
- —
- Metro
- Burlington, IA-IL
- State GDP YoY
- ▲ 2.48%
- F500 in state
- 4
Industry mix (Fortune 500 HQ in IA)
| Industry | F500 HQs | Revenue |
|---|---|---|
| Financial Services | 1 | $16B |
|
||
| Retail / Convenience | 1 | $15B |
|
||
Price history
+29.2% since first listed4 events — show timeline
- 2026-04-30 Price Changed $62,000 IAR
- 2026-04-20 Listed $69,000 IAR
- 2016-10-12 Sold (MLS) $42,000 IAR
- 2016-08-16 Listed $48,000 IAR
Property tax history
+0.7%/yrLatest (2025): $802 · +14.2% YoY. Source: county tax records.
Cash-flow waterfall
monthlySold comps — $/sqft
last 12 mo · ≤1 miLoading sold comps…