1075 NE Miami Gardens Dr #306 · Ojus, FL
Flood risk No data
- FEMA flood zone
- —
- Chance of flooding over 30 yrs
- —
- Est. flood insurance / yr
- —
Fire risk No data
- Est. fire insurance / yr
- —
Heat risk No data
- Hot days now (above threshold)
- —
- Hot days in 30 yrs
- —
Wind risk No data
- Chance of severe wind over 30 yrs
- —
Air-quality risk No data
- Unhealthy air days now
- —
- Unhealthy air days in 30 yrs
- —
Risk factors via First Street. Map © Google.
Why this score? — see what drove the B grade
The composite is a weighted blend of 9 inputs, each scored 0–100. Each bar is that input's sub-score; the figure is the points it added to the 100-point composite (weight × sub-score).
- Cash flow +29.5/30.0
- 1% rule +10.0/10.0
- DSCR +10.0/10.0
- ARV discount +7.5/15.0
- Schools +4.2/10.0
- Livability +4.2/5.0
- Condition / age +4.0/5.0
- Rent growth +2.6/5.0
- Appreciation +0.0/10.0
$190,000
🖨 Deal sheet 📄 Offer letter ✓ Due diligence
Listing remarks
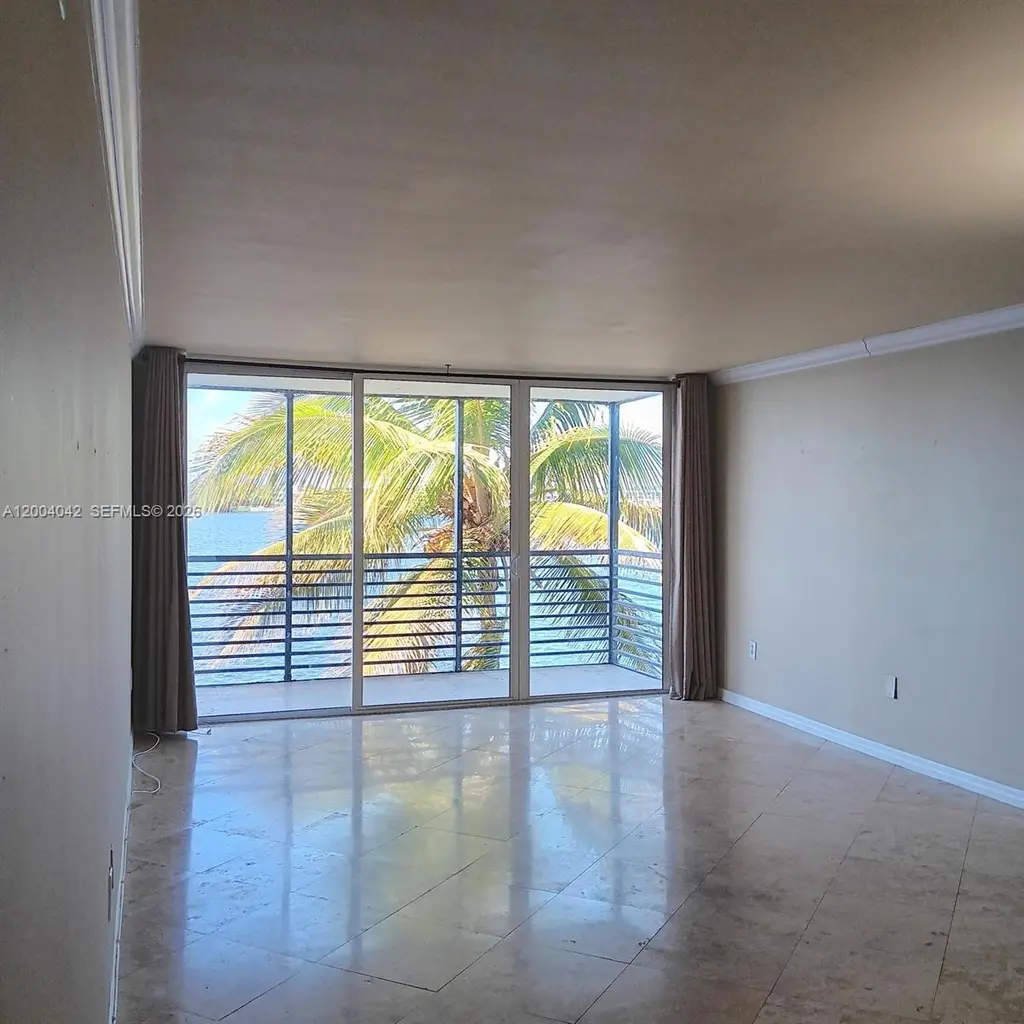
Stunning unobstructed panoramic water views from this beautifully renovated, pet-friendly residence (up to 30 lbs) in North Miami Beach. This move-in ready home offers breathtaking waterfront scenery with swaying palm trees and serene sunsets from your private balcony, creating the ultimate South Florida lifestyle. Bright and spacious interior with abundant natural light, featuring an open-concept kitchen, updated bathrooms, and generous living and dining areas designed for comfort, functionality, and modern living. Additional private storage included, with a convenient location near elevators and laundry facilities. Enjoy resort-style amenities including heated pool, fitness center, sauna,
Key facts
- Open-concept kitchen
- Sauna
- Gym
Tags
Property features AI
Finance
- Financial info: Pets allowed with restrictions or conditions
- HOA & community: Monthly association fee; Association fee includes amenities; Association amenities include pool
Exterior
- Parking: Assigned parking; Guest parking; One assigned space
- Security: Complex fenced; Security guard
- Utilities: Cable available
- Home design: Condominium (attached property); 8-story building; Entry on level 3; Resale unit
- Construction: Block construction
- Exterior features: Balcony; Open balcony/patio; Canal-front waterfront
Interior
- Kitchen: Dishwasher; Electric range; Refrigerator
- Flooring: Marble; Tile
- Bathrooms: 1 full bathroom; 1 half bathroom
- Heating & cooling: Central heating (electric); Central air conditioning (electric)
- Interior features: Breakfast area; Eat-in kitchen; Elevator; Jetted tub; Living/dining room; Walk-in closet(s); Drapes; Impact glass windows; Sliding windows
- Laundry & utility: Electric water heater; Storage room
Neighborhood map
What this means for you Summary
Snapshot
- This is a 1-bed/1.5-bath condo listed at $190k. Condition is rated good.
Deal economics
- At list price, monthly cash flow is $680 ($8k/yr) — positive.
- The deal already cash-flows at list — no discount required.
- Meets the 1% rule at list price ($3k rent vs $190k).
- Recommended offer: $184k (3.0% below list) — sets the bar for market timing.
- Cap rate 10.6% vs local median 8.7% in Ojus — meaningfully above typical; check what's discounted (condition, days-on-market, listing class) to confirm the premium yield is real.
Location & tenants
- Location reads 83/100 on livability (#58 in FL, #1,031 nationally) — a professional / high-income tenant draw. Strengths: commute A+, housing A+, health & safety A+; Watch: schools D+, amenities F.
- Miami-Dade (suburban): math 45% / reading 54% proficiency, ranked #40 of 73 in FL (top 55%) — families likely to look elsewhere, expect single-tenant / working-renter base with shorter leases; 64% free/reduced lunch — lower-income household profile, screen leases tightly.
- Market conditions: Rents flat; 572 active listings in the ZIP; 10,051 units permitted in Miami-Dade County in 2024 (7,758 in 5+ unit buildings).
- At $3,338/mo this rent would consume 61% of the median local household income ($65k/yr) (locally 3123% of renters already pay >50% of income on rent) — very limited rent-growth headroom before tenants either downsize or default.
Forward outlook
- Local home prices are declining (-3.0%/yr); year-one equity from $1k of loan paydown is wiped out by about $6k of value loss. Plan a longer hold.
- Miami-Dade County population projected at +28% by 2050 — long-run rental-demand tailwind backs the buy-and-hold thesis.
Negotiation context
- It's been on market 59 days — a 3% lower offer ($184k) is reasonable based on typical stale-listing flexibility.
- 4 sale attempts with the ask held roughly flat each time — persistent listings suggest the price (not the market) is what's stuck; bring a comps-based counter.
Questions for the listing agent
- It's been on market 59 days. Have you received any prior offers? Is the seller open to a 3% concession, seller financing, or rate buy-down credit?
- Built in 1968 — when were the roof, HVAC, electrical panel, plumbing, and water heater last replaced?
- What does the HOA fee cover, when was the last increase, and are there any pending special assessments or reserve-fund shortfalls?
- Any open or pending special assessments — roof, HVAC, plumbing, elevator, façade? What's the per-unit balance and payoff schedule, and is the seller paying it off at close or rolling it to the buyer?
- Is there a deadline driving the sale (1031 exchange, divorce, estate, relocation)? That informs how much negotiation room exists.
- Schools are D-rated, which usually means shorter tenancies and higher turnover. Who's the typical renter profile here, and what's been the actual vacancy rate?
- What's the average days-on-market for RENTAL listings here right now (not sales)? A rising rental-DOM trend means longer vacancies and softer asking-rent achievability than the comps imply.
- What's the recent tenant-quality profile in this submarket — average credit score on applications, eviction rate, late-payment / NSF rate, and stable-employment percentage? A property-management company in the area should have these aggregated.
- How much new apartment / multifamily construction is in the pipeline within 1–3 miles? Heavy new supply (>2% of stock underway) typically softens rents 12–24 months out; light construction supports rent growth.
Investment metrics
- 1% rule
- 1.76% ✓
- Cap rate
- 10.59%
- Cash-on-cash
- 15.34%
- DSCR
- 1.68
- GRM
- 4.7
CMA / ARV
No comps found within radius.
Projected returns pro-forma
-3.0% appreciation · 0.22% rent growth · sell at horizon
- IRR
- 2.0%
- Equity multiple
- 1.07×
- Total profit
- $3,880
- Equity at exit
- $28,330
- IRR
- 7.6%
- Equity multiple
- 1.48×
- Total profit
- $25,694
- Equity at exit
- $16,428
Cash invested: $53,200 (down + closing). Projections, not guarantees.
Landlord ↔ Tenant lean methodology
- Overall (STATE)
- 87 Strongly Landlord-Friendly
- State Florida
- 87 Strongly Landlord-Friendly · R+3
- County
- — inherits STATE
- City
- — inherits STATE
ZIP-level market 33179
- Rents YoY
- 0.2%
- Active inventory
- 572
- Price-to-rent
- 4.7×
Monthly cashflow live
- Estimated rent
- $3,338 medium interval (Pro) →
- Mortgage (P&I)
- −$996
- Tax est. 1.5%
- −$238 /mo · $2,850/yr
- Insurance
- −$79
- HOA
- −$644
- Vacancy / Maint / Mgmt
- −$701
- Net cashflow
- $680
Break-even live
UW: 25.0% down · 7.5% · 30yr · 1.5% tax · 5.0% vac · 8.0% maint · 8.0% mgmt
Financing live
Cash to close
- Down payment
- $47,500
- Closing costs
- $5,700
- Reserves months
- —
- Total cash needed
- —
Loan-product check · same deal, 3 products live
Conventional
25% down · 7.5% · 30yr
- Down + closing
- —
- Monthly P&I
- —
- Monthly cashflow
- —
- DSCR
- —
- Eligible?
- —
Personal DTI + credit; lowest rate.
DSCR
20% down · 8.5% · 30yr
- Down + closing
- —
- Monthly P&I
- —
- Monthly cashflow
- —
- DSCR
- —
- Eligible?
- —
No personal income docs; deal must DSCR.
Hard money
10% down · 12.0% · 12mo
- Down + closing
- —
- Monthly P&I
- —
- Monthly cashflow
- —
- DSCR
- —
- Eligible?
- —
Short-term bridge; refi at stabilization.
HOA detail condo
- Monthly dues
- $644 · $7,728/yr
- Likely covers
- waterpoolgym
- Assessments
- None detected in remarks — confirm with the listing agent.
Listing history 13 events
-
2026-06-18days on market $190,000 Active 59 DOM
-
2026-06-17days on market $190,000 Active 58 DOM
-
2026-06-16days on market $190,000 Active 57 DOM
-
2026-06-15days on market $190,000 Active 56 DOM
-
2026-06-13days on market $190,000 Active 54 DOM
-
2026-06-09days on market $190,000 Active 50 DOM
-
2026-06-08pricedays on market $190,000 Active 49 DOM
-
2026-06-07days on market $197,000 Active 48 DOM
-
2026-06-04days on market $197,000 Active 45 DOM
-
2026-06-03days on market $197,000 Active 44 DOM
-
2026-06-02days on market $197,000 Active 43 DOM
-
2026-06-01days on market $197,000 Active 42 DOM
-
2026-05-31days on market $197,000 Active 41 DOM
ⓘ Source: listings_history table (triggers on properties + properties_extension) + one-shot
backfill from property_details.listing_events for pre-trigger history.
Nearby sold comps map
Loading sold comps map…
Walkable amenities ~0.75 mi
Loading nearby amenities…
Taxation est. · year 1
- Rental income
- $40,056
- − Mortgage interest
- −$10,643
- − Property taxes
- −$2,850
- − Insurance
- −$950
- − Repairs & maintenance
- −$3,204
- − Management
- −$3,204
- − HOA
- −$7,728
- − Depreciation
- −$5,527
- Taxable income
- $5,949
- Est. tax owed @ 24.0%
- −$1,428
- After-tax cash flow
- $6,732/yr
For passive investors: Depreciation is non-cash, so a rental often shows a tax loss while cash-flowing — sheltering income. Rental losses are passive: they offset passive income freely, and up to $25,000/yr can offset ordinary (W-2) income if you actively participate and your MAGI is under $100k (phasing out to $0 by $150k); unused losses carry forward. On sale, claimed depreciation is recaptured at up to 25%, and gains may owe capital-gains tax (a 1031 exchange can defer both). Figures are a year-1 estimate at your 24.0% rate — not tax advice; consult a CPA.
Condition & rehab AI · 12 photos
This waterfront condo is in excellent condition with modern amenities and a stunning view. It is move-in ready and offers high ROI for both resale and rental.
Value-add opportunities
- Both Painting exterior and interior walls — Enhances curb appeal and interior aesthetics
- Both Landscaping improvements — Enhances waterfront view and curb appeal
- Both Upgrade lighting fixtures — Improves ambiance and safety
Renovation cost estimate screening
Value-add ROI direction
- Both Painting exterior and interior walls — Enhances curb appeal and interior aesthetics ↑
- Both Landscaping improvements — Enhances waterfront view and curb appeal ↑
- Both Upgrade lighting fixtures — Improves ambiance and safety ↑
ⓘ Cost ranges are severity-bucket heuristics (US national rule-of-thumb). Get contractor quotes + a written scope before underwriting a rehab budget.
Schools (NCES district)
- District
- Miami-Dade
- NCES district ID
- 1200390
- Math proficiency
- 45% ▼ -16.00%
- Reading proficiency
- 54% ▼ -5.00%
- Median HH income
- $43,928
- Composite
- 41.76/100
- National rank
- #3397
- State rank
- #40 of 73 in FL
Livability — Ojus
- Score
- 83/100
- State rank
- #58
- US rank
- #1031
Category grades
Schools grade is shown separately in the Schools card above.
Census & demographics
- Census place
- Ojus, FL
- County
- Miami-Dade County · 2,697,751 people
- Metro
- Miami-Fort Lauderdale-Pompano Beach, FL
- Population (ZIP)
- 51,591
- Household income
- $65,211
- Rent vs Own
- Severe rent burden
- 3123.0
Population outlook (Miami-Dade County) Hauer SSP2
- Today (2025)
- 3,126,439 people
- By 2030
- 3,325,765 · +6.4%
- By 2040
- 3,697,561 · +18.3%
- By 2050
- 4,012,134 · +28.3%
- By 2075
- 4,605,612 · +47.3%
- By 2100
- 4,866,598 · +55.7%
Race, ethnicity, and origin ACS 2023
- Neighborhood character
- Diverse neighborhood (Simpson 0.67)
- Race & ethnicity
- Black 39% Hispanic / Latino 38% Two or more races 23% White 19% Asian 1%
- Hispanic origin (detail)
- Mexican 1% Puerto Rican 2% Cuban 6% Dominican 3% Salvadoran 3%
- Common ancestry
- Hispanic 13% Scotch-Irish 2% Romanian 2%
- Foreign-born
- 48% · Canada, Jamaica, Dominican Republic
- Languages at home
- 42% English-only · Spanish 37% French/Haitian/Cajun 13% Other Indo-European 2%
Political lean MEDSL · Miami-Dade
- 2024 margin
- R (+11.4) · D 43.9% · R 55.4%
- 2008→2024 swing
- -27.6pp toward R · 2008: 16.1pp · 2024: -11.4pp
- All cycles
- 2024: R+11.4 2020: D+7.3 2016: D+29.6 2012: D+23.7 2008: D+16.1
Not yet ingested
- Civics
- —
Market trends
- HPI YoY
- ▼ -608.34%
- Current HPI
- 328.1733
- Rent YoY
- ▲ 0.22%
- Metro
- Miami-Fort Lauderdale-Pompano Beach, FL
- State GDP YoY
- ▲ 3.28%
- F500 in state
- 36
Industry mix (Fortune 500 HQ in FL)
| Industry | F500 HQs | Revenue |
|---|---|---|
| Industrial Technology | 2 | $29B |
|
||
| Insurance | 2 | $17B |
|
||
| Retail | 1 | $60B |
|
||
| Technology Distribution | 1 | $58B |
|
||
| Homebuilding | 1 | $35B |
|
||
| Technology Manufacturing | 1 | $35B |
|
||
Price history
-1.0% since first listed10 events — show timeline
- 2026-05-21 Price Changed $197,000 MARMLS
- 2026-04-20 Listed $199,000 MARMLS
- 2026-01-09 Listing Removed — MARMLS
- 2025-12-29 Relisted — MARMLS
- 2025-12-20 Pending — MARMLS
- 2025-12-19 Listing Removed — MARMLS
- 2025-10-15 Pending — MARMLS
- 2025-09-02 Relisted — MARMLS
- 2025-08-27 Contingent — MARMLS
- 2025-07-11 Listed $199,000 MARMLS
Cash-flow waterfall
monthlySold comps — $/sqft
last 12 mo · ≤1 miLoading sold comps…