 7-Plex
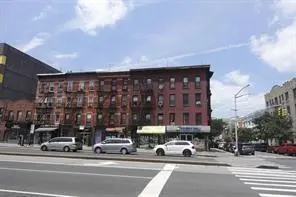
922 4th Ave · New York, NY
Flood risk No data
- FEMA flood zone
- —
- Chance of flooding over 30 yrs
- —
- Est. flood insurance / yr
- —
Fire risk No data
- Est. fire insurance / yr
- —
Heat risk No data
- Hot days now (above threshold)
- —
- Hot days in 30 yrs
- —
Wind risk No data
- Chance of severe wind over 30 yrs
- —
Air-quality risk No data
- Unhealthy air days now
- —
- Unhealthy air days in 30 yrs
- —
Risk factors via First Street. Map © Google.
Why this score? — see what drove the A- grade
The composite is a weighted blend of 9 inputs, each scored 0–100. Each bar is that input's sub-score; the figure is the points it added to the 100-point composite (weight × sub-score).
- Cash flow +29.4/30.0
- DSCR +10.0/10.0
- Appreciation +9.2/10.0
- 1% rule +8.3/10.0
- ARV discount +7.5/15.0
- Schools +5.0/10.0
- Rent growth +4.1/5.0
- Livability +3.8/5.0
- Condition / age +3.8/5.0
$1,800,000
🖨 Deal sheet (PDF) 📄 Offer letter ✓ Due diligence
Multi-family units
County records classify this as Multi-Family (5+ Unit). Listing-text estimate: 7 units. confirmed
5+ unit building — per-unit beds/baths from public records are typically unavailable; the breakdown below (if shown) is an estimate from the listing text.
Listing remarks
$177,000/YEAR-$15,000/MONTH RENTAL INCOME!!! A TRULY INCREDIBLE INVESTMENT PROPERTY IN A MOST DESIRABLE GREENWOOD HEIGHTS/SUNSET PARK LOCATION- 7 FAMILY + 1 STOREFRONT MIXED-USE SOLID BRICK BUILDING ON A BUSY & BUSTLING 4th AVE COMMERICIAL CORRIDOR- SURROUNDED BY ALL TRANSPORTATION & SHOPPING. .. THIS BUILDING GENERATES AN IMPRESSIVE APPROXIMATE RENT ROLL OF $177,000/YEAR-$15,000/MONTH. .. DON'T MISS OUT ON THIS OUTSTANDING OPPORTUNITY TO OWN A PRIZED PIECE OF REAL ESTATE IN ONE OF BROOKLYN'S MOST SOUGHT-AFTER & PREMIER NEIGHBORHOODS. .. THIS MONEY MAKING BUILDING RUNS LIKE CLOCKWORK- ALL YOU NEED TO DO IS JUST SIT BACK & COLLECT THAT RENT$$$
Key facts
- Sunset park location
- Mixed-use building
- Solid brick building
Tags
Property features AI
Finance
- Other: Building footprint approximately 1,000 sq ft; Total building area reported as 4,000
- Financial info: Gross rent income reported; Financing options: exchange considered, bank mortgage, or cash
Exterior
- Parking: No designated parking
- Utilities: 110V electric; Gas hot water; Gas heating (steam/radiator)
- Home design: Brick exterior; Flat roof; Other foundation
- Construction: Brick construction
- Exterior features: Back yard; Attached building; Mixed-use property
Interior
- Bedrooms: Eight units total (mix of 1- and 2-bedroom apartments and retail unit); Multiple 1-bedroom units; One 2-bedroom unit
- Flooring: Hardwood floors
- Bathrooms: Most residential units have one full bathroom
- Heating & cooling: Steam/radiator heat; Gas hot water
- Interior features: Hardwood floors; Cellar
Neighborhood map
What this means for you Summary
Snapshot
- This is a 7 × 8-bed/7.0-bath units multifamily listed at $1.80M. Condition is rated good.
Deal economics
- At list price, monthly cash flow is $6k ($77k/yr) — positive. Per door: $915/mo.
- The deal already cash-flows at list — no discount required.
- Meets the 1% rule at list price ($24k rent vs $1.80M).
- Recommended offer: $1.64M (9.0% below list) — sets the bar for market timing.
- Cap rate 10.6% vs local median 2.6% in New York — top-decile yield for the area; either an underpriced asset or a hidden risk that comps aren't pricing in. Stress-test before assuming the spread holds.
Location & tenants
- Location reads 75/100 on livability (#268 in NY, #4,188 nationally) — a middle-class / working-renter tenant base. Strengths: amenities A+, commute A+, health & safety A; Watch: crime F, cost of living F.
- Zoned schools: Elm Tree Elementary School (math 27% / reading 52%, grade F, #1,444 of 2,108 statewide, top 71%, 806 students, 94% FRL); Ms 51 William Alexander (math 67% / reading 92%, grade A+, #32 of 729 statewide, top 5%, 1,026 students, 61% FRL); Midwood High School (math 94% / reading 96%, grade A+, #83 of 1,100 statewide, top 8%, 4,062 students, 73% FRL).
- Market conditions: Rents rising fast (+6.3%/yr); 87 active listings in the ZIP; solid renter incomes; 10,063 units permitted in Kings County in 2024 (9,789 in 5+ unit buildings).
- At $23,852/mo this rent would consume 315% of the median local household income ($91k/yr) (locally 1713% of renters already pay >50% of income on rent) — very limited rent-growth headroom before tenants either downsize or default.
Forward outlook
- In year one you build about $163k of equity ($12k loan paydown + $150k appreciation (8.3% local appreciation)).
- Kings County population projected at +13% by 2050 — modest demand growth; plan on rents tracking national, not racing it.
- At projected returns (8.3% appreciation + 6.3% rent growth), your $504k cash investment doubles in ~2 years — after that, you're playing with house money.
- By year 2, paydown + projected appreciation supports a ~$261k cash-out refi (75% LTV) — recoverable capital for the next deal without selling this one.
Negotiation context
- It's been on market 93 days — a 9% lower offer ($1.64M) is reasonable based on typical stale-listing flexibility.
Questions for the listing agent
- It's been on market 93 days. Have you received any prior offers? Is the seller open to a 9% concession, seller financing, or rate buy-down credit?
- Can we see the unit-by-unit rent roll, current vacancy, and any below-market leases? What's the average tenancy length?
- What capital expenditures (roof, boiler, parking lot, exteriors) have been made in the last 5 years, and what's planned in the next 2?
- Why hasn't it sold? Are there any deal-killer items the seller is aware of (foundation, flood, title, zoning, code violations)?
- Is there a deadline driving the sale (1031 exchange, divorce, estate, relocation)? That informs how much negotiation room exists.
- Schools are B-rated — typically a magnet for longer-tenancy family renters. What's the average tenant stay here, and is there a school-zone premium baked into asking?
- Crime grade is F in this area — have there been break-ins, vandalism, or insurance claims at this property in the last 3 years? What carrier currently insures it and at what premium?
- What's the average days-on-market for RENTAL listings here right now (not sales)? A rising rental-DOM trend means longer vacancies and softer asking-rent achievability than the comps imply.
- What's the recent tenant-quality profile in this submarket — average credit score on applications, eviction rate, late-payment / NSF rate, and stable-employment percentage? A property-management company in the area should have these aggregated.
- How much new apartment / multifamily construction is in the pipeline within 1–3 miles? Heavy new supply (>2% of stock underway) typically softens rents 12–24 months out; light construction supports rent growth.
Investment metrics
- 1% rule
- 1.33% ✓
- Cap rate
- 10.56%
- Cash-on-cash
- 15.25%
- DSCR
- 1.68
- GRM
- 6.3
CMA / ARV
No comps found within radius.
Projected returns pro-forma
8.35% appreciation · 6.26% rent growth · sell at horizon
- IRR
- 34.3%
- Equity multiple
- 3.52×
- Total profit
- $1,270,637
- Equity at exit
- $1,410,205
- IRR
- 31.6%
- Equity multiple
- 8.10×
- Total profit
- $3,577,206
- Equity at exit
- $2,840,974
Cash invested: $504,000 (down + closing). Projections, not guarantees.
Landlord ↔ Tenant lean methodology
- Overall (CITY)
- 0 Strongly Tenant-Friendly
- State New York
- 15 Strongly Tenant-Friendly · D+10
- County
- — inherits STATE
- City New York
- 0 Strongly Tenant-Friendly · D+34
ZIP-level market 11232
- Home prices YoY
- 2.0%
- Rents YoY
- 6.3%
- Active inventory
- 87
- Price-to-rent
- 44.0×
Monthly cashflow live
- Estimated rent
- $23,852 medium interval (Pro) →
- Mortgage (P&I)
- −$9,439
- Tax est. 1.5%
- −$2,250 /mo · $27,000/yr
- Insurance
- −$750
- HOA
- −$0
- Vacancy / Maint / Mgmt
- −$5,009
- Net cashflow
- $6,404
Break-even live
Sensitivity live
| Price | -10% $7,648 | -5% $7,026 | +0% $6,404 | +5% $5,782 | +10% $5,160 |
|---|---|---|---|---|---|
| Rent | -10% $4,519 | -5% $5,462 | +0% $6,404 | +5% $7,346 | +10% $8,288 |
| Rate | -1.0pp $7,310 | -0.5pp $6,861 | base $6,404 | +0.5pp $5,937 | +1.0pp $5,463 |
7-unit breakdown (identical units grouped — click to expand)
| Units | Beds | Baths | Est. rent |
|---|---|---|---|
| 7× units | 8 | 7 | $23,849 |
| #1 | 8 | 7 | $3,407 |
| #2 | 8 | 7 | $3,407 |
| #3 | 8 | 7 | $3,407 |
| #4 | 8 | 7 | $3,407 |
| #5 | 8 | 7 | $3,407 |
| #6 | 8 | 7 | $3,407 |
| #7 | 8 | 7 | $3,407 |
| Total (7 units) | $23,852 | ||
UW: 25.0% down · 7.5% · 30yr · 1.5% tax · 5.0% vac · 8.0% maint · 8.0% mgmt
Financing live
Cash to close
- Down payment
- $450,000
- Closing costs
- $54,000
- Reserves months
- —
- Total cash needed
- —
Loan-product check · same deal, 3 products live
Conventional
25% down · 7.5% · 30yr
- Down + closing
- —
- Monthly P&I
- —
- Monthly cashflow
- —
- DSCR
- —
- Eligible?
- —
Personal DTI + credit; lowest rate.
DSCR
20% down · 8.5% · 30yr
- Down + closing
- —
- Monthly P&I
- —
- Monthly cashflow
- —
- DSCR
- —
- Eligible?
- —
No personal income docs; deal must DSCR.
Hard money
10% down · 12.0% · 12mo
- Down + closing
- —
- Monthly P&I
- —
- Monthly cashflow
- —
- DSCR
- —
- Eligible?
- —
Short-term bridge; refi at stabilization.
Listing history 17 events
-
2026-06-21days on market $1,800,000 Active 93 DOM
-
2026-06-18days on market $1,800,000 Active 90 DOM
-
2026-06-17days on market $1,800,000 Active 89 DOM
-
2026-06-15days on market $1,800,000 Active 87 DOM
-
2026-06-13days on market $1,800,000 Active 85 DOM
-
2026-06-10days on market $1,800,000 Active 81 DOM
-
2026-06-08days on market $1,800,000 Active 80 DOM
-
2026-06-08days on market $1,800,000 Active 79 DOM
-
2026-06-04days on market $1,800,000 Active 76 DOM
-
2026-06-03days on market $1,800,000 Active 75 DOM
-
2026-06-01days on market $1,800,000 Active 73 DOM
-
2026-05-31days on market $1,800,000 Active 72 DOM
-
2026-03-20$1,800,000 Active
-
2025-08-25price $1,800,000
-
2025-02-25price $1,950,000
-
2024-12-10price $1,999,000
-
2024-03-12price $2,150,000
ⓘ Source: listings_history table (triggers on properties + properties_extension) + one-shot
backfill from property_details.listing_events for pre-trigger history.
Nearby sold comps map
Loading sold comps map…
Walkable amenities ~0.75 mi
Loading nearby amenities…
Taxation est. · year 1
- Rental income
- $286,224
- − Mortgage interest
- −$100,828
- − Property taxes
- −$27,000
- − Insurance
- −$9,000
- − Repairs & maintenance
- −$22,898
- − Management
- −$22,898
- − Depreciation
- −$52,364
- Taxable income
- $51,237
- Est. tax owed @ 24.0%
- −$12,297
- After-tax cash flow
- $64,547/yr
For passive investors: Depreciation is non-cash, so a rental often shows a tax loss while cash-flowing — sheltering income. Rental losses are passive: they offset passive income freely, and up to $25,000/yr can offset ordinary (W-2) income if you actively participate and your MAGI is under $100k (phasing out to $0 by $150k); unused losses carry forward. On sale, claimed depreciation is recaptured at up to 25%, and gains may owe capital-gains tax (a 1031 exchange can defer both). Figures are a year-1 estimate at your 24.0% rate — not tax advice; consult a CPA.
Condition & rehab AI · 11 photos
This multi-family property is in good condition with a solid rental income. It offers a good investment opportunity with potential for minor updates to enhance its curb appeal and interior aesthetics.
Value-add opportunities
- Both Painting the exterior and interior walls — Fresh paint can enhance the curb appeal and interior aesthetics, potentially increasing both resale and rental value.
- Both Updating the kitchen appliances — Modernizing the kitchen with new appliances can improve the home's appeal and functionality, boosting both resale and rental value.
Renovation cost estimate screening
Value-add ROI direction
- Both Painting the exterior and interior walls — Fresh paint can enhance the curb appeal and interior aesthetics, potentially increasing both resale and rental value. ↑
- Both Updating the kitchen appliances — Modernizing the kitchen with new appliances can improve the home's appeal and functionality, boosting both resale and rental value. ↑
ⓘ Cost ranges are severity-bucket heuristics (US national rule-of-thumb). Get contractor quotes + a written scope before underwriting a rehab budget.
Schools (NCES district)
No district data.
Livability — New York
- Score
- 75/100
- State rank
- #268
- US rank
- #4188
Category grades
Schools grade is shown separately in the Schools card above.
Census & demographics
- Census place
- New York, NY
- County
- Kings County · 2,614,986 people
- City population
- 7,731,280
- Metro
- New York-Newark-Jersey City, NY-NJ-PA
- Population (ZIP)
- 27,816
- Household income
- $90,891
- Rent vs Own
- Severe rent burden
- 1713.0
Population outlook (Kings County) Hauer SSP2
- Today (2025)
- 2,847,441 people
- By 2030
- 2,937,006 · +3.1%
- By 2040
- 3,095,491 · +8.7%
- By 2050
- 3,228,968 · +13.4%
- By 2075
- 3,321,723 · +16.7%
- By 2100
- 3,111,387 · +9.3%
Race, ethnicity, and origin ACS 2023
- Neighborhood character
- Diverse neighborhood (Simpson 0.65)
- Race & ethnicity
- Hispanic / Latino 52% White 23% Asian 15% Two or more races 12% Black 6% Native American 4%
- Hispanic origin (detail)
- Mexican 20% Puerto Rican 9% Dominican 7%
- Common ancestry
- Romanian 3% Scotch-Irish 1% Lithuanian 1%
- Foreign-born
- 38% · Canada, China, Jamaica
- Languages at home
- 40% English-only · Spanish 44% Chinese 9% Other Asian/Pacific 1%
Political lean MEDSL · Kings
- 2024 margin
- Solid D (+44.0) · D 72.0% · R 28.0%
- 2008→2024 swing
- -15.5pp toward R · 2008: 59.4pp · 2024: 44.0pp
- All cycles
- 2024: D+44.0 2020: D+54.8 2016: D+61.8 2012: D+63.9 2008: D+59.4
Not yet ingested
- Civics
- —
Market trends
- HPI YoY
- ▲ 8.35%
- Current HPI
- 422.0849
- Rent YoY
- ▲ 6.26%
- Metro
- New York-Newark-Jersey City, NY-NJ-PA
- State GDP YoY
- ▲ 2.60%
- F500 in state
- 92
Industry mix (Fortune 500 HQ in NY)
| Industry | F500 HQs | Revenue |
|---|---|---|
| Financial Services | 10 | $950B |
|
||
| Consumer Goods | 9 | $162B |
|
||
| Insurance | 4 | $225B |
|
||
| Telecommunications | 2 | $144B |
|
||
| Pharmaceuticals | 2 | $112B |
|
||
| Media / Entertainment | 2 | $69B |
|
||
Price history
-16.3% since first listed5 events — show timeline
- 2026-03-20 Listed $1,800,000 BNYMLS
- 2025-08-25 Price Changed $1,800,000 BNYMLS
- 2025-02-25 Price Changed $1,950,000 BNYMLS
- 2024-12-10 Price Changed $1,999,000 BNYMLS
- 2024-03-12 Price Changed $2,150,000 BNYMLS
Cash-flow waterfall
monthlySold comps — $/sqft
last 12 mo · ≤1 miLoading sold comps…