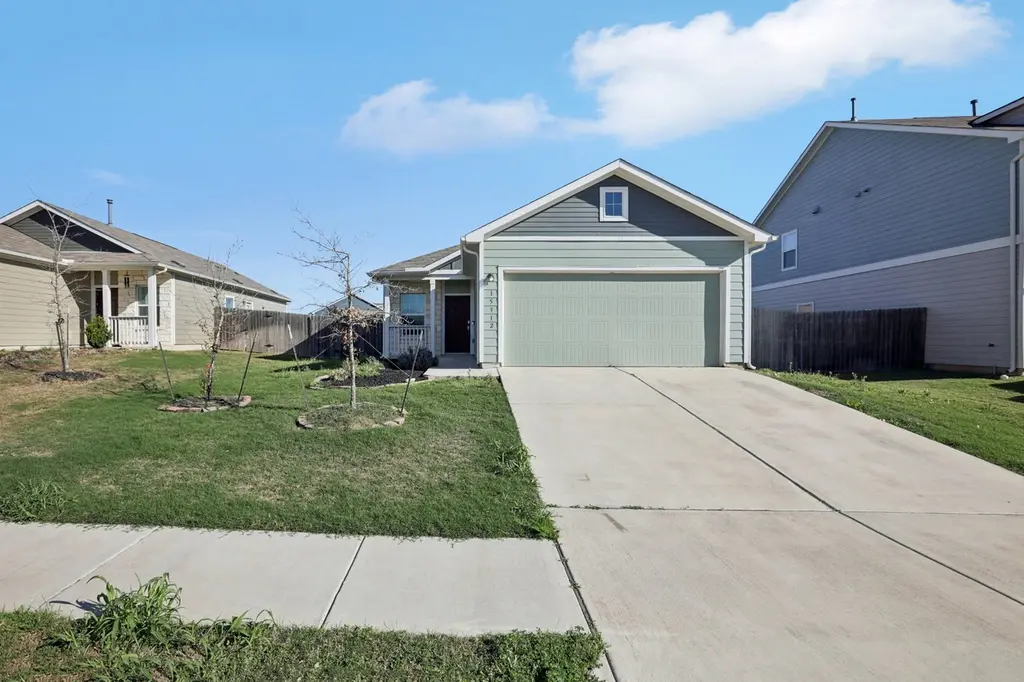
15312 Sweet Mimosa Dr · Austin, TX
Flood risk 1/10 · Minimal
- FEMA flood zone
- X (unshaded)
- Chance of flooding over 30 yrs
- 0.0%
- Est. flood insurance / yr
- $507 – $1,088
Fire risk 6/10 · Moderate
- Est. fire insurance / yr
- $1,222 – $2,270
Heat risk 8/10 · Major
- Hot days now (above 108°F)
- 7 days/yr
- Hot days in 30 yrs
- 23 days/yr
Wind risk 8/10 · Major
- Chance of severe wind over 30 yrs
- 80.0%
Air-quality risk 1/10 · Minimal
- Unhealthy air days now
- 0 days/yr
- Unhealthy air days in 30 yrs
- 0 days/yr
Risk factors via First Street. Map © Google.
Why this score? — see what drove the D- grade
The composite is a weighted blend of 9 inputs, each scored 0–100. Each bar is that input's sub-score; the figure is the points it added to the 100-point composite (weight × sub-score).
- ARV discount +15.0/15.0
- Cash flow +5.7/30.0
- Livability +4.1/5.0
- Appreciation +3.4/10.0
- 1% rule +3.0/10.0
- Condition / age +2.5/5.0
- Rent growth +2.4/5.0
- Schools +1.9/10.0
- DSCR +0.1/10.0
$259,999
🖨 Deal sheet 📄 Offer letter ✓ Due diligence
Listing remarks MLS
Welcome to 15312 Sweet Mimosa Dr! This single story home features charming curb appeal and an inviting interior floor plan. The spacious kitchen includes stainless steel appliances, gas range, rich cabinetry, and a large breakfast bar overlooking the living area. A dedicated laundry closet adds convenience and additional storage. Property also includes a fully fenced private backyard and 2 car garage. Vacant, Easy to Show and Ready for Move in!
Key facts
- Rich cabinetry
- Large breakfast bar
- Gas range
Tags
Neighborhood map
What this means for you Summary
Snapshot
- This is a 3-bed/2.0-bath single-family listed at $260k.
Deal economics
- At list price, monthly cash flow is $-526 ($-6k/yr) — negative.
- To cash-flow at today's rent, offer at most $167k (35.7% below list).
- To meet the 1% rule (rent ≥ 1% of price), the offer needs to be $207k (20.3% below list).
- Recommended offer: $167k (35.7% below list) — sets the bar for cash-flow.
- Cap rate 3.9% vs local median 1.8% in Austin — top-decile yield for the area; either an underpriced asset or a hidden risk that comps aren't pricing in. Stress-test before assuming the spread holds.
Location & tenants
- Location reads 82/100 on livability (#16 in TX, #1,208 nationally) — a professional / high-income tenant draw. Strengths: amenities A+, commute A+, employment A+; Watch: cost of living D, crime F.
- Del Valle ISD (rural): math 19% / reading 26% proficiency, ranked #749 of 826 in TX (top 91%) — low school quality limits family demand, transient renter base, plan for 1-2y turnover; 77% free/reduced lunch — lower-income household profile, screen leases tightly.
- Market conditions: Rents soft (-0.4%/yr); 246 active listings in the ZIP; 10 comparable units currently listed for rent nearby; rentals at typical pace (median 24d on market — plan ~3-4 weeks tenant-placement turnaround); 17,121 units permitted in Travis County in 2024 (11,963 in 5+ unit buildings).
- This rent runs 35% of the median local income ($72k/yr) — at the standard rent-burdened threshold; future hikes will face affordability resistance.
Forward outlook
- Local home prices are declining (-3.0%/yr); year-one equity from $2k of loan paydown is wiped out by about $8k of value loss. Plan a longer hold.
- Travis County population projected at +60% by 2050 — long-run rental-demand tailwind backs the buy-and-hold thesis.
Negotiation context
- It's been on market 91 days — a 9% lower offer ($237k) is reasonable based on typical stale-listing flexibility.
Risks & watch-outs
- Watch-outs: property tax is 2.9% of price.
- Climate carrying-cost: severe wind risk, 80% chance of damaging wind over 30y; major wildfire risk; extreme-heat days projected 7→23/yr by 2055 (HVAC capex compounding) — expect insurance premiums to compound above CPI over the hold.
Questions for the listing agent
- What do current leases actually rent for vs. the listed asking? Can we see a recent rent roll and the last 12 months of T-12 income?
- It's been on market 91 days. Have you received any prior offers? Is the seller open to a 36% concession, seller financing, or rate buy-down credit?
- Property tax is high relative to price — has the assessment been appealed recently, and will the sale trigger a re-assessment?
- What does the HOA fee cover, when was the last increase, and are there any pending special assessments or reserve-fund shortfalls?
- Why hasn't it sold? Are there any deal-killer items the seller is aware of (foundation, flood, title, zoning, code violations)?
- Is there a deadline driving the sale (1031 exchange, divorce, estate, relocation)? That informs how much negotiation room exists.
- Crime grade is F in this area — have there been break-ins, vandalism, or insurance claims at this property in the last 3 years? What carrier currently insures it and at what premium?
- The area grade is low — what's the realistic commute time and amenity access for the typical tenant pool here? Any planned neighborhood developments (good or bad) we should know about?
- What's the average days-on-market for RENTAL listings here right now (not sales)? A rising rental-DOM trend means longer vacancies and softer asking-rent achievability than the comps imply.
- What's the recent tenant-quality profile in this submarket — average credit score on applications, eviction rate, late-payment / NSF rate, and stable-employment percentage? A property-management company in the area should have these aggregated.
- How much new for-sale + rental construction is in the pipeline within 1–3 miles? Heavy new supply typically softens prices + rents 12–24 months out; constrained supply supports both.
Investment metrics
- 1% rule
- 0.80% ✗
- Cap rate
- 3.87%
- Cash-on-cash
- -8.67%
- DSCR
- 0.61
- GRM
- 10.5
CMA / ARV
- ARV (median comp)
- $337,765
- List price
- $259,999
- Delta
- -23.02%
- Verdict
- UNDERPRICED
- Comps
- 20 within 1.0 mi
Show comp detail 12 sales within ~0.75 mi
| Address | Dist | Beds/Ba | Sqft | Sold | Price | $/sf | Match |
|---|---|---|---|---|---|---|---|
| 7506 Grenadine Bloom Bnd | 0.06mi | 3/2.0 | 1,479 (0%) | 10mo | $273,000 | $185 | 88 |
| 7517 Sparkling Light Dr | 0.11mi | 3/2.0 | 1,488 (+1%) | 16mo | $294,990 | $198 | 81 |
| 15307 Lithodora Cv | 0.19mi | 3/2.0 | 1,464 (-1%) | 18mo | $289,000 | $197 | 74 |
| 7328 Dungarees Way | 0.43mi | 3/2.0 | 1,491 (+1%) | 9mo | $269,900 | $181 | 71 |
| 15607 Poppy Petal Dr | 0.30mi | 3/2.0 | 1,610 (+9%) | 2mo | $285,000 | $177 | 69 |
| 15409 Summer Ray Dr | 0.27mi | 3/2.0 | 1,586 (+7%) | 10mo | $290,000 | $183 | 67 |
| 7507 Petal Pink Cv | 0.11mi | 3/2.0 | 1,610 (+9%) | 17mo | $359,990 | $224 | 66 |
| 15213 Purple Drop Cv | 0.18mi | 3/2.0 | 1,610 (+9%) | 14mo | $349,990 | $217 | 66 |
| 15204 Purple Drop Cv | 0.16mi | 3/2.0 | 1,600 (+8%) | 18mo | $359,990 | $225 | 64 |
| 7608 Purple Drop Bnd | 0.21mi | 3/2.0 | 1,610 (+9%) | 15mo | $339,790 | $211 | 63 |
| 15305 Ivy Wreath Dr Unit A | 0.21mi | 3/2.5 | 1,567 (+6%) | 20mo | $265,000 | $169 | 62 |
| 15201 Spruce Frost Cv Unit B | 0.11mi | 3/2.5 | 1,681 (+14%) | 18mo | $270,000 | $161 | 55 |
Match score weights: distance 35% · size 25% · config 20% · recency 20%. Top-matched comps best support the ARV.
Projected returns pro-forma
-3.0% appreciation · 0.0% rent growth · sell at horizon
- IRR
- -35.8%
- Equity multiple
- -0.12×
- Total profit
- $-81,435
- Equity at exit
- $38,767
- IRR
- -78.5%
- Equity multiple
- -0.87×
- Total profit
- $-136,461
- Equity at exit
- $22,480
Cash invested: $72,800 (down + closing). Projections, not guarantees.
Landlord ↔ Tenant lean methodology
- Overall (STATE)
- 87 Strongly Landlord-Friendly
- State Texas
- 87 Strongly Landlord-Friendly · R+5
- County
- — inherits STATE
- City
- — inherits STATE
ZIP-level market 78617
- Home prices YoY
- -1.7%
- Rents YoY
- -0.4%
- Active inventory
- 246
- Price-to-rent
- 10.5×
Monthly cashflow live
- Estimated rent
- $2,072 high interval (Pro) →
- Mortgage (P&I)
- −$1,363
- Tax from tax record
- −$631 /mo · $7,572/yr
- Insurance
- −$108
- HOA
- −$60
- Vacancy / Maint / Mgmt
- −$435
- Net cashflow
- $-526
Break-even live
UW: 25.0% down · 7.5% · 30yr · 1.5% tax · 5.0% vac · 8.0% maint · 8.0% mgmt
Financing live
Cash to close
- Down payment
- $65,000
- Closing costs
- $7,800
- Reserves months
- —
- Total cash needed
- —
Loan-product check · same deal, 3 products live
Conventional
25% down · 7.5% · 30yr
- Down + closing
- —
- Monthly P&I
- —
- Monthly cashflow
- —
- DSCR
- —
- Eligible?
- —
Personal DTI + credit; lowest rate.
DSCR
20% down · 8.5% · 30yr
- Down + closing
- —
- Monthly P&I
- —
- Monthly cashflow
- —
- DSCR
- —
- Eligible?
- —
No personal income docs; deal must DSCR.
Hard money
10% down · 12.0% · 12mo
- Down + closing
- —
- Monthly P&I
- —
- Monthly cashflow
- —
- DSCR
- —
- Eligible?
- —
Short-term bridge; refi at stabilization.
Rent comps 10 comps
| Address | Beds | Baths | Sqft | Rent | $/sqft | DOM | Units | Dist |
|---|---|---|---|---|---|---|---|---|
| 15307 Grenadine Bloom Cv Del Valle, TX | 4.0 | 2.0 | 1845 | $2,500 | $1.36 | 43d | 1 | 0.05mi |
| 15302 Grenadine Bloom Cv Del Valle, TX | 4.0 | 2.0 | 1635 | $2,050 | $1.25 | 24d | 1 | 0.08mi |
| 7409 Sparkling Light Dr Unit A Del Valle, TX | 3.0 | 2.5 | 1690 | $1,999 | $1.18 | 24d | 1 | 0.12mi |
| 7416 Sparkling Light Dr Unit A Del Valle, TX | 3.0 | 2.5 | 1767 | $1,999 | $1.13 | 24d | 1 | 0.13mi |
| 7316 Sparkling Light Dr Unit B Del Valle, TX | 3.0 | 2.5 | 1336 | $1,775 | $1.33 | 24d | 1 | 0.18mi |
| 7616 Pewter Luster Bnd Del Valle, TX | 3.0 | 2.0 | 1479 | $2,200 | $1.49 | 24d | 1 | 0.19mi |
| 7200 Grenadine Bloom Bnd Unit A Del Valle, TX | 3.0 | 2.5 | 1765 | $1,700 | $0.96 | 43d | 1 | 0.21mi |
| 15401 Poppy Petal Dr Del Valle, TX | 4.0 | 2.5 | 1856 | $2,300 | $1.24 | 17d | 1 | 0.23mi |
| 15428 Jazzberry Way Del Valle, TX | 3.0 | 2.0 | 1607 | $2,000 | $1.24 | 24d | 1 | 0.25mi |
| 8105 Linden Rd Unit 1 Del Valle, TX | 2.0 | 2.0 | 1132 | $2,099 | $1.85 | 24d | 1 | 0.91mi |
HOA detail
- Monthly dues
- $60 · $720/yr
- Likely covers
- gas
Listing history 15 events
-
2026-06-18days on market $259,999 Active 91 DOM
-
2026-06-17days on market $259,999 Active 90 DOM
-
2026-06-16days on market $259,999 Active 89 DOM
-
2026-06-15days on market $259,999 Active 88 DOM
-
2026-06-13days on market $259,999 Active 86 DOM
-
2026-06-09days on market $259,999 Active 82 DOM
-
2026-06-08days on market $259,999 Active 81 DOM
-
2026-06-07days on market $259,999 Active 80 DOM
-
2026-06-04days on market $259,999 Active 77 DOM
-
2026-06-03days on market $259,999 Active 76 DOM
-
2026-06-02days on market $259,999 Active 75 DOM
-
2026-06-01days on market $259,999 Active 74 DOM
-
2026-05-31days on market $259,999 Active 73 DOM
-
2026-04-16price $265,000 448-char remark
Show marketing remark (448 chars)
Welcome to 15312 Sweet Mimosa Dr! This single story home features charming curb appeal and an inviting interior floor plan. The spacious kitchen includes stainless steel appliances, gas range, rich cabinetry, and a large breakfast bar overlooking the living area. A dedicated laundry closet adds convenience and additional storage. Property also includes a fully fenced private backyard and 2 car garage. Vacant, Easy to Show and Ready for Move in!
-
2026-03-19$275,000 Active 448-char remark
Show marketing remark (448 chars)
Welcome to 15312 Sweet Mimosa Dr! This single story home features charming curb appeal and an inviting interior floor plan. The spacious kitchen includes stainless steel appliances, gas range, rich cabinetry, and a large breakfast bar overlooking the living area. A dedicated laundry closet adds convenience and additional storage. Property also includes a fully fenced private backyard and 2 car garage. Vacant, Easy to Show and Ready for Move in!
ⓘ Source: listings_history table (triggers on properties + properties_extension) + one-shot
backfill from property_details.listing_events for pre-trigger history.
Tax reassessment forecast TX · Resets to sale price
- Current annual tax
- $7,572 · $631/mo
- Projected year-2 tax
- $7,572 · $631/mo
- Expected delta
- $0/yr ($0/mo · 0.0%)
ⓘ Screening estimate from a state-policy table — verify with the county assessor before closing.
Climate risk First Street
- Flood 1/10 Low FEMA zone X (unshaded) · 0% chance over 30 yrs
- Wildfire 6/10 Major
- Heat 8/10 Severe 7 d/yr ≥108°F today · 23 d/yr by 30 yrs out
- Wind 8/10 Severe 80% chance of damaging wind over 30 yrs
- Air quality 1/10 Low 0 unhealthy d/yr today · 0 by 30 yrs out
Nearby sold comps map
Loading sold comps map…
Walkable amenities ~0.75 mi
Loading nearby amenities…
Taxation est. · year 1
- Rental income
- $24,866
- − Mortgage interest
- −$14,564
- − Property taxes
- −$7,572
- − Insurance
- −$1,300
- − Repairs & maintenance
- −$1,989
- − Management
- −$1,989
- − HOA
- −$720
- − Depreciation
- −$7,564
- Taxable loss
- −$10,832
- Est. tax savings @ 24.0%
- +$2,600
- After-tax cash flow
- $-3,710/yr
For passive investors: Depreciation is non-cash, so a rental often shows a tax loss while cash-flowing — sheltering income. Rental losses are passive: they offset passive income freely, and up to $25,000/yr can offset ordinary (W-2) income if you actively participate and your MAGI is under $100k (phasing out to $0 by $150k); unused losses carry forward. On sale, claimed depreciation is recaptured at up to 25%, and gains may owe capital-gains tax (a 1031 exchange can defer both). Figures are a year-1 estimate at your 24.0% rate — not tax advice; consult a CPA.
Schools (NCES district)
- District
- Del Valle ISD
- NCES district ID
- 4816620
- Math proficiency
- 19% ▼ -13.00%
- Reading proficiency
- 26% ▼ -2.00%
- Median HH income
- $41,322
- Composite
- 19.13/100
- National rank
- #8830
- State rank
- #749 of 826 in TX
Livability — Austin
- Score
- 82/100
- State rank
- #16
- US rank
- #1208
Category grades
Schools grade is shown separately in the Schools card above.
Census & demographics
- Census place
- Austin, TX
- County
- Travis County · 1,299,254 people
- City population
- 1,066,854
- Metro
- Austin-Round Rock-Georgetown, TX
- Population (ZIP)
- 30,756
- Household income
- $71,640
- Rent vs Own
- Severe rent burden
- 681.0
Population outlook (Travis County) Hauer SSP2
- Today (2025)
- 1,545,133 people
- By 2030
- 1,729,269 · +11.9%
- By 2040
- 2,097,596 · +35.8%
- By 2050
- 2,463,890 · +59.5%
- By 2075
- 3,249,374 · +110.3%
- By 2100
- 3,801,868 · +146.1%
Race, ethnicity, and origin ACS 2023
- Neighborhood character
- Predominantly Hispanic (75%)
- Race & ethnicity
- Hispanic / Latino 75% Two or more races 33% White 16% Black 6% Asian 1%
- Hispanic origin (detail)
- Mexican 68% Puerto Rican 1%
- Common ancestry
- Romanian 1%
- Foreign-born
- 26% · Canada
- Languages at home
- 41% English-only · Spanish 57% Other Asian/Pacific 1%
Political lean MEDSL · Travis
- 2024 margin
- Solid D (+39.3) · D 68.8% · R 29.4% · Other 1.8%
- 2008→2024 swing
- +9.9pp toward D · 2008: 29.4pp · 2024: 39.3pp
- All cycles
- 2024: D+39.3 2020: D+45.0 2016: D+38.9 2012: D+23.9 2008: D+29.4
Not yet ingested
- Civics
- —
Market trends
- HPI YoY
- ▼ -3.24%
- Current HPI
- 192.3518
- Rent YoY
- ▼ -0.36%
- Metro
- Austin-Round Rock-Georgetown, TX
- State GDP YoY
- ▲ 3.95%
- F500 in state
- 110
Industry mix (Fortune 500 HQ in TX)
| Industry | F500 HQs | Revenue |
|---|---|---|
| Energy | 16 | $1,198B |
|
||
| Technology | 5 | $198B |
|
||
| Engineering / Construction | 4 | $72B |
|
||
| Energy Services | 3 | $60B |
|
||
| Utilities | 3 | $41B |
|
||
| Healthcare | 2 | $330B |
|
||
Price history
-3.6% since first listed2 events — show timeline
- 2026-04-16 Price Changed $265,000 Unlock MLS
- 2026-03-19 Listed $275,000 Unlock MLS
Property tax history
+47.8%/yrLatest (2026): $7,572 · +2.8% YoY. Source: county tax records.
Cash-flow waterfall
monthlySold comps — $/sqft
last 12 mo · ≤1 miLoading sold comps…