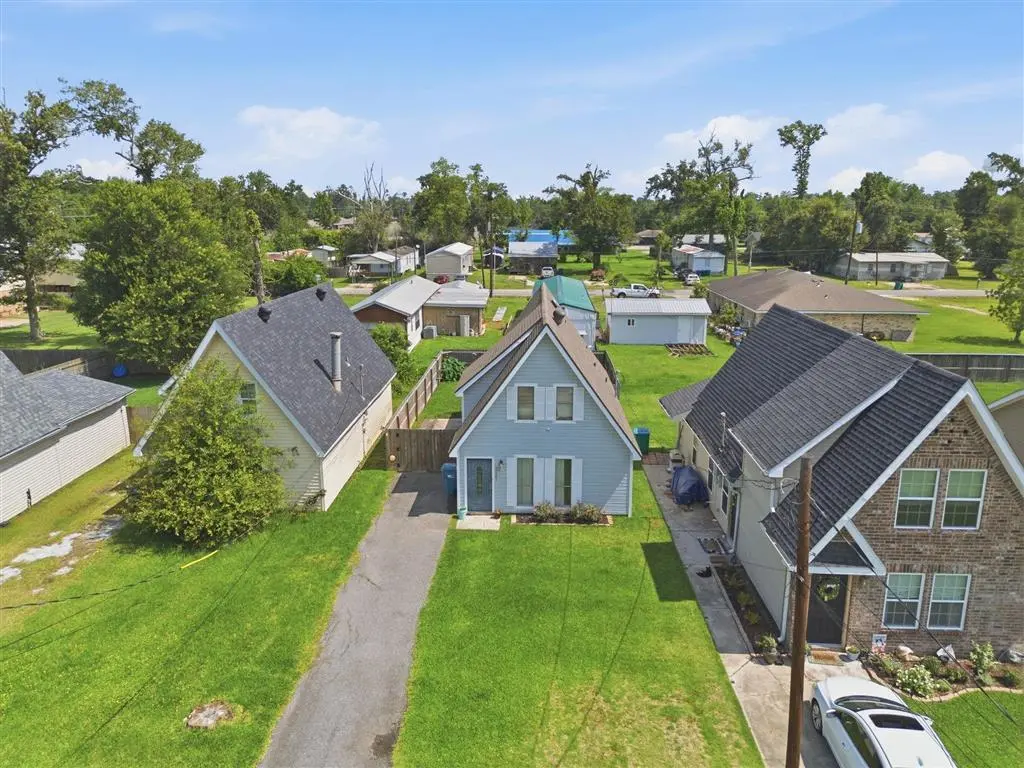
2107 Division Rd · Sulphur, LA
Flood risk 5/10 · Moderate
- FEMA flood zone
- X (shaded)
- Chance of flooding over 30 yrs
- 0.41%
- Est. flood insurance / yr
- $507 – $1,088
Fire risk 3/10 · Minor
- Est. fire insurance / yr
- $1,269 – $2,357
Heat risk 9/10 · Severe
- Hot days now (above 109°F)
- 7 days/yr
- Hot days in 30 yrs
- 24 days/yr
Wind risk 9/10 · Severe
- Chance of severe wind over 30 yrs
- 99.0%
Air-quality risk 2/10 · Minimal
- Unhealthy air days now
- 1 days/yr
- Unhealthy air days in 30 yrs
- 1 days/yr
Risk factors via First Street. Map © Google.
Why this score? — see what drove the B- grade
The composite is a weighted blend of 9 inputs, each scored 0–100. Each bar is that input's sub-score; the figure is the points it added to the 100-point composite (weight × sub-score).
- Cash flow +28.4/30.0
- DSCR +10.0/10.0
- ARV discount +6.9/15.0
- 1% rule +6.8/10.0
- Rent growth +4.4/5.0
- Livability +3.6/5.0
- Schools +3.1/10.0
- Condition / age +2.5/5.0
- Appreciation +0.0/10.0
$172,000
🖨 Deal sheet (PDF) 📄 Offer letter ✓ Due diligence
Listing remarks MLS
This charming, well maintained 3 bed 2 bath home has a new roof, updated kitchen, fresh paint, some new flooring, and stainless appliances. The bedrooms are spacious with walk-in closets, and there is a pantry/storage under the stairs. The property is located down the road from shopping, parks, and churches and it will qualify for 100% financing. All measurements are more or less and is in flood zone X.
Key facts
- Primary suite
- Soaring ceilings
- Natural light
Tags
Property features AI
Exterior
- Utilities: Public water; Public sewer; Electricity connected; Water connected; Sewer connected
- Home design: House; Two-story
- Exterior features: Back yard; City lot
Interior
- Bedrooms: One bedroom on the main level
- Bathrooms: Two full bathrooms; One bathroom on the main level
- Heating & cooling: Central heating; Central air conditioning
- Interior features: No fireplace
Neighborhood map
What this means for you Summary
Snapshot
- This is a 3-bed/2.0-bath single-family listed at $172k.
Deal economics
- At list price, monthly cash flow is $557 ($7k/yr) — positive.
- The deal already cash-flows at list — no discount required.
- Meets the 1% rule at list price ($2k rent vs $172k).
- Recommended offer: $169k (1.5% below list) — sets the bar for market timing.
Location & tenants
- Location reads 71/100 on livability (#48 in LA) — a middle-class / working-renter tenant base. Strengths: cost of living A+, housing A+, schools A; Watch: crime D-, amenities F, commute F.
- Calcasieu Parish (other): math 30% / reading 44% proficiency, ranked #29 of 98 in LA (top 30%) — families likely to look elsewhere, expect single-tenant / working-renter base with shorter leases.
- Market conditions: Rents rising fast (+7.7%/yr); 291 active listings in the ZIP; 4 comparable units currently listed for rent nearby; rentals lingering (median 44d on market — plan ~5-8 weeks vacancy on turnover, expect pricing pressure); 75% of comp listings sitting > 30 days — soft ceiling on asking rent; 1,298 units permitted in Calcasieu Parish in 2024 (526 in 5+ unit buildings).
- This rent runs 38% of the median local income ($65k/yr) — at the standard rent-burdened threshold; future hikes will face affordability resistance.
Forward outlook
- Local home prices are declining (-3.0%/yr); year-one equity from $1k of loan paydown is wiped out by about $5k of value loss. Plan a longer hold.
- Calcasieu County population projected at +11% by 2050 — modest demand growth; plan on rents tracking national, not racing it.
- At projected returns (-3.0% appreciation + 7.7% rent growth), your $48k cash investment doubles in ~7 years — after that, you're playing with house money.
Negotiation context
- It's been on market 18 days — a 2% lower offer ($169k) is reasonable based on typical stale-listing flexibility.
- 2 sale attempts since 5y ago with the ask held roughly flat each time — persistent listings suggest the price (not the market) is what's stuck; bring a comps-based counter.
Risks & watch-outs
- Climate carrying-cost: moderate flood risk; severe wind risk, 99% chance of damaging wind over 30y; extreme-heat days projected 7→24/yr by 2055 (HVAC capex compounding) — expect insurance premiums to compound above CPI over the hold.
Questions for the listing agent
- Is there a deadline driving the sale (1031 exchange, divorce, estate, relocation)? That informs how much negotiation room exists.
- Schools are A-rated — typically a magnet for longer-tenancy family renters. What's the average tenant stay here, and is there a school-zone premium baked into asking?
- Crime grade is D in this area — have there been break-ins, vandalism, or insurance claims at this property in the last 3 years? What carrier currently insures it and at what premium?
- What's the average days-on-market for RENTAL listings here right now (not sales)? A rising rental-DOM trend means longer vacancies and softer asking-rent achievability than the comps imply.
- What's the recent tenant-quality profile in this submarket — average credit score on applications, eviction rate, late-payment / NSF rate, and stable-employment percentage? A property-management company in the area should have these aggregated.
- How much new for-sale + rental construction is in the pipeline within 1–3 miles? Heavy new supply typically softens prices + rents 12–24 months out; constrained supply supports both.
Investment metrics
- 1% rule
- 1.18% ✓
- Cap rate
- 10.18%
- Cash-on-cash
- 13.89%
- DSCR
- 1.62
- GRM
- 7.1
CMA / ARV
- ARV (on-the-fly)
- $169,632
- Comps found
- 12
Show comp detail 12 sales within ~0.75 mi
| Address | Dist | Beds/Ba | Sqft | Sold | Price | $/sf | Match |
|---|---|---|---|---|---|---|---|
| 2219 Roxton St | 0.28mi | 3/2.0 | 1,328 (-3%) | 4mo | $169,900 | $128 | 78 |
| 2115 N Rose Park Ave N | 0.39mi | 3/2.0 | 1,324 (-3%) | 5mo | $63,000 | $48 | 73 |
| 1525 Anita St | 0.37mi | 3/2.0 | 1,389 (+2%) | 12mo | $179,000 | $129 | 70 |
| 2227 Division Rd | 0.17mi | 3/2.0 | 1,318 (-4%) | 19mo | $135,600 | $103 | 70 |
| 1530 Shasta St | 0.50mi | 3/2.0 | 1,370 (+0%) | 12mo | $162,000 | $118 | 67 |
| 2216 Saint Francis St | 0.31mi | 3/2.0 | 1,376 (+1%) | 22mo | $195,000 | $142 | 66 |
| 2229 Estelle Dr Dr | 0.47mi | 4/1.0 (+1) | 1,329 (-3%) | 3mo | $125,000 | $94 | 62 |
| 2404 Roxton St | 0.37mi | 3/2.0 | 1,250 (-9%) | 12mo | $175,000 | $140 | 58 |
| 2613 Mary Ann Dr Dr | 0.71mi | 3/1.5 | 1,316 (-4%) | 4mo | $165,000 | $125 | 55 |
| 2544 Saint Joseph St | 0.69mi | 3/2.0 | 1,452 (+6%) | 14mo | $179,900 | $124 | 46 |
| 2340 Acadienne St | 0.40mi | 3/2.0 | 1,558 (+14%) | 17mo | $170,000 | $109 | 44 |
| 1030 Gulf Ln | 0.71mi | 3/2.0 | 1,279 (-6%) | 15mo | $148,500 | $116 | 44 |
Match score weights: distance 35% · size 25% · config 20% · recency 20%. Top-matched comps best support the ARV.
Projected returns pro-forma
-3.0% appreciation · 7.65% rent growth · sell at horizon
- IRR
- 8.8%
- Equity multiple
- 1.36×
- Total profit
- $17,501
- Equity at exit
- $25,646
- IRR
- 21.4%
- Equity multiple
- 3.19×
- Total profit
- $105,568
- Equity at exit
- $14,871
Cash invested: $48,160 (down + closing). Projections, not guarantees.
Landlord ↔ Tenant lean methodology
- Overall (STATE)
- 90 Strongly Landlord-Friendly
- State Louisiana
- 90 Strongly Landlord-Friendly · R+12
- County
- — inherits STATE
- City
- — inherits STATE
ZIP-level market 70663
- Rents YoY
- 7.7%
- Active inventory
- 291
- Price-to-rent
- 7.1×
Monthly cashflow live
- Estimated rent
- $2,027 medium interval (Pro) →
- Mortgage (P&I)
- −$902
- Tax from tax record
- −$70 /mo · $841/yr
- Insurance
- −$72
- HOA
- −$0
- Vacancy / Maint / Mgmt
- −$426
- Net cashflow
- $557
Break-even live
Sensitivity live
| Price | -10% $655 | -5% $606 | +0% $557 | +5% $509 | +10% $460 |
|---|---|---|---|---|---|
| Rent | -10% $397 | -5% $477 | +0% $557 | +5% $637 | +10% $718 |
| Rate | -1.0pp $644 | -0.5pp $601 | base $557 | +0.5pp $513 | +1.0pp $468 |
UW: 25.0% down · 7.5% · 30yr · 1.5% tax · 5.0% vac · 8.0% maint · 8.0% mgmt
Financing live
Cash to close
- Down payment
- $43,000
- Closing costs
- $5,160
- Reserves months
- —
- Total cash needed
- —
Loan-product check · same deal, 3 products live
Conventional
25% down · 7.5% · 30yr
- Down + closing
- —
- Monthly P&I
- —
- Monthly cashflow
- —
- DSCR
- —
- Eligible?
- —
Personal DTI + credit; lowest rate.
DSCR
20% down · 8.5% · 30yr
- Down + closing
- —
- Monthly P&I
- —
- Monthly cashflow
- —
- DSCR
- —
- Eligible?
- —
No personal income docs; deal must DSCR.
Hard money
10% down · 12.0% · 12mo
- Down + closing
- —
- Monthly P&I
- —
- Monthly cashflow
- —
- DSCR
- —
- Eligible?
- —
Short-term bridge; refi at stabilization.
Rent comps 4 comps
| Address | Beds | Baths | Sqft | Rent | $/sqft | DOM | Units | Dist |
|---|---|---|---|---|---|---|---|---|
| 2310 Timberlane Dr Sulphur, LA | 2.0 | 2.0 | 1350 | $2,450 | $1.81 | 44d | 1 | 0.20mi |
| 1917 Linda Ave Sulphur, LA | 3.0 | 2.0 | 1288 | $1,890 | $1.47 | 44d | 1 | 0.37mi |
| 2304 Merwood St Unit B Sulphur, LA | 3.0 | 2.0 | 1200 | $900 | $0.75 | 21d | 1 | 1.14mi |
| 1141 Mosswood Dr Sulphur, LA | 2.0–3.0 | 2.0–3.5 | 1332 | $2,195 | $1.65 | 44d | 1 | 1.17mi |
Listing history 14 events
-
2026-06-19days on market $172,000 Active 18 DOM
-
2026-06-18days on market $172,000 Active 17 DOM
-
2026-06-17days on market $172,000 Active 16 DOM
-
2026-06-16days on market $172,000 Active 15 DOM
-
2026-06-15days on market $172,000 Active 14 DOM
-
2026-06-14days on market $172,000 Active 12 DOM
-
2026-06-13days on market $172,000 Active 11 DOM
-
2026-06-10days on market $172,000 Active 9 DOM
-
2026-06-09days on market $172,000 Active 8 DOM
-
2026-06-08days on market $172,000 Active 7 DOM
-
2026-06-07days on market $172,000 Active 6 DOM
-
2026-06-05days on market $172,000 Active 3 DOM
-
2026-06-02remarks 699-char remark
-
2026-06-02$172,000 Active 1 DOM
ⓘ Source: listings_history table (triggers on properties + properties_extension) + one-shot
backfill from property_details.listing_events for pre-trigger history.
Tax reassessment forecast LA · Resets to sale price
- Current annual tax
- $841 · $70/mo
- Projected year-2 tax
- $946 · $79/mo
- Expected delta
- +$105/yr (+$9/mo · 12.5%)
ⓘ Screening estimate from a state-policy table — verify with the county assessor before closing.
Climate risk First Street
- Flood 5/10 Major FEMA zone X (shaded) · 41% chance over 30 yrs
- Wildfire 3/10 Moderate
- Heat 9/10 Extreme 7 d/yr ≥109°F today · 24 d/yr by 30 yrs out
- Wind 9/10 Extreme 99% chance of damaging wind over 30 yrs
- Air quality 2/10 Low 1 unhealthy d/yr today · 1 by 30 yrs out
Nearby sold comps map
Loading sold comps map…
Walkable amenities ~0.75 mi
Loading nearby amenities…
Taxation est. · year 1
- Rental income
- $24,322
- − Mortgage interest
- −$9,635
- − Property taxes
- −$841
- − Insurance
- −$860
- − Repairs & maintenance
- −$1,946
- − Management
- −$1,946
- − Depreciation
- −$5,004
- Taxable income
- $4,091
- Est. tax owed @ 24.0%
- −$982
- After-tax cash flow
- $5,707/yr
For passive investors: Depreciation is non-cash, so a rental often shows a tax loss while cash-flowing — sheltering income. Rental losses are passive: they offset passive income freely, and up to $25,000/yr can offset ordinary (W-2) income if you actively participate and your MAGI is under $100k (phasing out to $0 by $150k); unused losses carry forward. On sale, claimed depreciation is recaptured at up to 25%, and gains may owe capital-gains tax (a 1031 exchange can defer both). Figures are a year-1 estimate at your 24.0% rate — not tax advice; consult a CPA.
Schools (NCES district)
- District
- Calcasieu Parish
- NCES district ID
- 2200330
- Math proficiency
- 30% ▼ -39.00%
- Reading proficiency
- 44% ▼ -33.00%
- Median HH income
- $44,700
- Composite
- 31.45/100
- National rank
- #5979
- State rank
- #29 of 98 in LA
Livability — Sulphur
- Score
- 71/100
- State rank
- #48
- US rank
- #7164
Category grades
Schools grade is shown separately in the Schools card above.
Census & demographics
- Census place
- Sulphur, LA
- County
- Calcasieu Parish · 170,889 people
- City population
- 27,799
- Metro
- Lake Charles, LA
- Population (ZIP)
- 27,799
- Household income
- $64,707
- Rent vs Own
- Severe rent burden
- 197.0
Population outlook (Calcasieu County) Hauer SSP2
- Today (2025)
- 212,179 people
- By 2030
- 218,199 · +2.8%
- By 2040
- 228,486 · +7.7%
- By 2050
- 236,208 · +11.3%
- By 2075
- 251,696 · +18.6%
- By 2100
- 247,848 · +16.8%
Race, ethnicity, and origin ACS 2023
- Neighborhood character
- Predominantly White (82%)
- Race & ethnicity
- White 82% Black 8% Hispanic / Latino 5% Two or more races 4%
- Common ancestry
- Lithuanian 13% Slovak 2% Scandinavian 1%
- Foreign-born
- 3% · Canada, Vietnam
- Languages at home
- 94% English-only · Spanish 2% French/Haitian/Cajun 2% Other Indo-European 1%
Political lean MEDSL · Calcasieu
- 2024 margin
- Solid R (+39.6) · D 29.5% · R 69.0% · Other 1.5%
- 2008→2024 swing
- -15.0pp toward R · 2008: -24.6pp · 2024: -39.6pp
- All cycles
- 2024: R+39.6 2020: R+35.2 2016: R+33.3 2012: R+28.7 2008: R+24.6
Not yet ingested
- Civics
- —
Market trends
- HPI YoY
- ▼ -104.29%
- Current HPI
- 100.0895
- Rent YoY
- ▲ 7.65%
- Metro
- Lake Charles, LA
- State GDP YoY
- ▲ 3.29%
- F500 in state
- 10
Industry mix (Fortune 500 HQ in LA)
| Industry | F500 HQs | Revenue |
|---|---|---|
| Telecommunications | 2 | $23B |
|
||
| Utilities | 1 | $12B |
|
||
| Wholesale / Distribution | 1 | $5B |
|
||
| Advertising | 1 | $2B |
|
||
Price history
+8.9% since first listed4 events — show timeline
- 2026-06-01 Listed $172,000 SWLAR
- 2022-02-11 Sold (Public Records) $165,000 Public Records
- 2022-02-11 Sold (MLS) — SWLAR
- 2021-11-12 Listed $158,000 SWLAR
Property tax history
-0.6%/yrLatest (2025): $841 · +0.8% YoY. Source: county tax records.
Cash-flow waterfall
monthlySold comps — $/sqft
last 12 mo · ≤1 miLoading sold comps…