6 Penn Dr · Lincoln University, PA
Flood risk 1/10 · Minimal
- FEMA flood zone
- X (unshaded)
- Chance of flooding over 30 yrs
- 0.0%
- Est. flood insurance / yr
- $473 – $860
Fire risk 3/10 · Minor
- Est. fire insurance / yr
- $511 – $949
Heat risk 6/10 · Moderate
- Hot days now (above 101°F)
- 7 days/yr
- Hot days in 30 yrs
- 15 days/yr
Wind risk 6/10 · Moderate
- Chance of severe wind over 30 yrs
- 27.0%
Air-quality risk 2/10 · Minimal
- Unhealthy air days now
- 1 days/yr
- Unhealthy air days in 30 yrs
- 3 days/yr
Risk factors via First Street. Map © Google.
Why this score? — see what drove the B- grade
The composite is a weighted blend of 9 inputs, each scored 0–100. Each bar is that input's sub-score; the figure is the points it added to the 100-point composite (weight × sub-score).
- Cash flow +30.0/30.0
- 1% rule +10.0/10.0
- DSCR +10.0/10.0
- ARV discount +7.5/15.0
- Schools +5.3/10.0
- Rent growth +2.5/5.0
- Condition / age +2.5/5.0
- Livability +2.0/5.0
- Appreciation +0.0/10.0
$239,000
🖨 Deal sheet 📄 Offer letter ✓ Due diligence
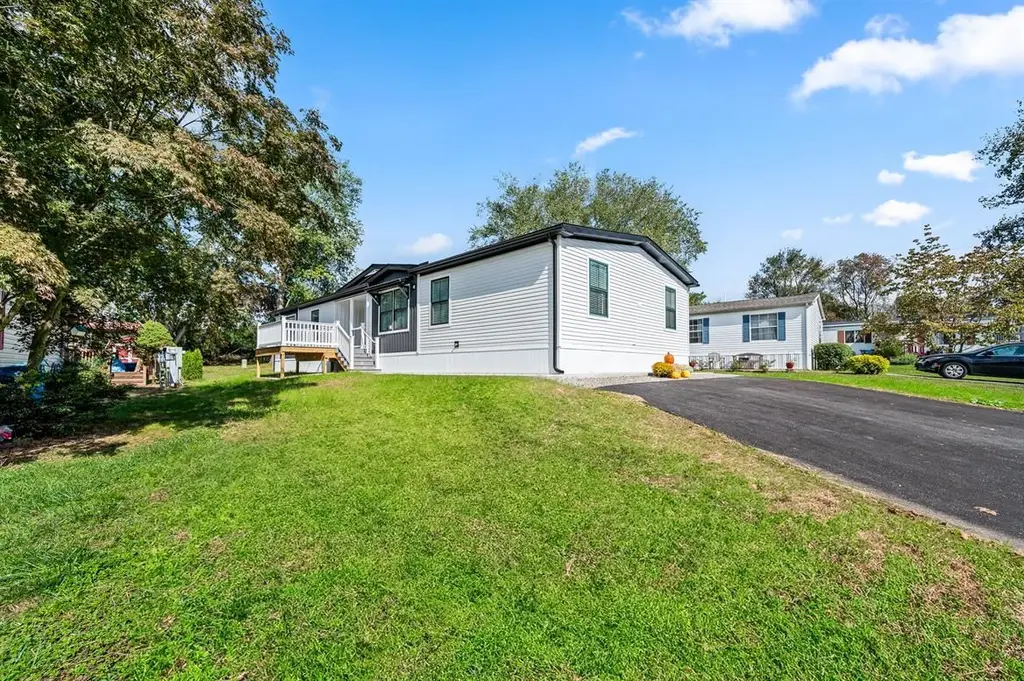
Listing remarks
Come take a tour of this brand new home! This 3 bedroom, 2 bathroom home includes a covered porch, a primary suite and so much more. Call the office to schedule your tour today!
Key facts
- Covered porch
- Primary suite
- Built 2026
Tags
Property features AI
Finance
- Other: Living area approximately 1,568
- Financial info: List price $239,000
Exterior
- Utilities: Central air conditioning
- Home design: Spec home — Colony 48 Oxford Village plan; Single-family property
Interior
- Kitchen: Dishwasher; Refrigerator
- Bedrooms: 3 bedrooms
- Bathrooms: 2 bathrooms
- Heating & cooling: Central air conditioning
- Interior features: Dishwasher; Refrigerator
Neighborhood map
What this means for you Summary
Snapshot
- This is a 3-bed/2.0-bath manufactured listed at $239k.
Deal economics
- At list price, monthly cash flow is $2k ($20k/yr) — positive.
- The deal already cash-flows at list — no discount required.
- Meets the 1% rule at list price ($4k rent vs $239k).
- Recommended offer: $232k (3.0% below list) — sets the bar for market timing.
- Cap rate 14.8% vs local median 1.8% in Lincoln University — top-decile yield for the area; either an underpriced asset or a hidden risk that comps aren't pricing in. Stress-test before assuming the spread holds.
Location & tenants
- Location reads 40/100 on livability (#1,743 in PA) — a working-class tenant base; expect higher turnover. Strengths: cost of living A+, crime A; Watch: schools D-, amenities F, commute F.
- Avon Grove SD (suburban): math 54% / reading 61% proficiency, ranked #63 of 539 in PA (top 12%) — acceptable for families but not a draw, mixed tenant base, ~2y average lease.
- Market conditions: 70 active listings in the ZIP; 1 comparable units currently listed for rent nearby; 1,513 units permitted in Chester County in 2024 (354 in 5+ unit buildings).
Forward outlook
- Local home prices are declining (-3.0%/yr); year-one equity from $2k of loan paydown is wiped out by about $7k of value loss. Plan a longer hold.
- Chester County population projected at +6% by 2050 — modest demand growth; plan on rents tracking national, not racing it.
- At projected returns (-3.0% appreciation + 3.0% rent growth), your $67k cash investment doubles in ~4 years — after that, you're playing with house money.
Negotiation context
- It's been on market 51 days — a 3% lower offer ($232k) is reasonable based on typical stale-listing flexibility.
Risks & watch-outs
- Climate carrying-cost: major wind risk, 27% chance of damaging wind over 30y; extreme-heat days projected 7→15/yr by 2055 (HVAC capex compounding) — expect insurance premiums to compound above CPI over the hold.
Questions for the listing agent
- It's been on market 51 days. Have you received any prior offers? Is the seller open to a 3% concession, seller financing, or rate buy-down credit?
- Is there a deadline driving the sale (1031 exchange, divorce, estate, relocation)? That informs how much negotiation room exists.
- Schools are D-rated, which usually means shorter tenancies and higher turnover. Who's the typical renter profile here, and what's been the actual vacancy rate?
- What's the average days-on-market for RENTAL listings here right now (not sales)? A rising rental-DOM trend means longer vacancies and softer asking-rent achievability than the comps imply.
- What's the recent tenant-quality profile in this submarket — average credit score on applications, eviction rate, late-payment / NSF rate, and stable-employment percentage? A property-management company in the area should have these aggregated.
- How much new for-sale + rental construction is in the pipeline within 1–3 miles? Heavy new supply typically softens prices + rents 12–24 months out; constrained supply supports both.
Investment metrics
- 1% rule
- 1.77% ✓
- Cap rate
- 14.81%
- Cash-on-cash
- 30.43%
- DSCR
- 2.35
- GRM
- 4.7
CMA / ARV
No comps found within radius.
Projected returns pro-forma
-3.0% appreciation · 3.0% rent growth · sell at horizon
- IRR
- 25.1%
- Equity multiple
- 2.04×
- Total profit
- $69,402
- Equity at exit
- $35,636
- IRR
- 32.9%
- Equity multiple
- 3.99×
- Total profit
- $199,846
- Equity at exit
- $20,664
Cash invested: $66,920 (down + closing). Projections, not guarantees.
Landlord ↔ Tenant lean methodology
- Overall (STATE)
- 62 Landlord-Friendly
- State Pennsylvania
- 62 Landlord-Friendly · EVEN
- County
- — inherits STATE
- City
- — inherits STATE
ZIP-level market 19390
- Home prices YoY
- -27.7%
- Active inventory
- 70
- Price-to-rent
- 4.7×
Monthly cashflow live
- Estimated rent
- $4,238 medium interval (Pro) →
- Mortgage (P&I)
- −$1,253
- Tax est. 1.5%
- −$299 /mo · $3,585/yr
- Insurance
- −$100
- HOA
- −$0
- Vacancy / Maint / Mgmt
- −$890
- Net cashflow
- $1,697
Break-even live
UW: 25.0% down · 7.5% · 30yr · 1.5% tax · 5.0% vac · 8.0% maint · 8.0% mgmt
Financing live
Cash to close
- Down payment
- $59,750
- Closing costs
- $7,170
- Reserves months
- —
- Total cash needed
- —
Loan-product check · same deal, 3 products live
Conventional
25% down · 7.5% · 30yr
- Down + closing
- —
- Monthly P&I
- —
- Monthly cashflow
- —
- DSCR
- —
- Eligible?
- —
Personal DTI + credit; lowest rate.
DSCR
20% down · 8.5% · 30yr
- Down + closing
- —
- Monthly P&I
- —
- Monthly cashflow
- —
- DSCR
- —
- Eligible?
- —
No personal income docs; deal must DSCR.
Hard money
10% down · 12.0% · 12mo
- Down + closing
- —
- Monthly P&I
- —
- Monthly cashflow
- —
- DSCR
- —
- Eligible?
- —
Short-term bridge; refi at stabilization.
Rent comps 1 comps
| Address | Beds | Baths | Sqft | Rent | $/sqft | DOM | Units | Dist |
|---|---|---|---|---|---|---|---|---|
| 2000 Greenbriar Ln West Grove, PA | 2.0 | 1.5–2.0 | 2876 | $4,238 | $1.47 | 1d | 1 | 0.74mi |
Listing history 15 events
-
2026-06-18days on market $239,000 Active 51 DOM
-
2026-06-17days on market $239,000 Active 50 DOM
-
2026-06-16days on market $239,000 Active 49 DOM
-
2026-06-15days on market $239,000 Active 48 DOM
-
2026-06-13days on market $239,000 Active 46 DOM
-
2026-06-13days on market $239,000 Active 45 DOM
-
2026-06-09days on market $239,000 Active 42 DOM
-
2026-06-08days on market $239,000 Active 41 DOM
-
2026-06-07days on market $239,000 Active 40 DOM
-
2026-06-04days on market $239,000 Active 37 DOM
-
2026-06-03days on market $239,000 Active 36 DOM
-
2026-06-02days on market $239,000 Active 35 DOM
-
2026-06-01days on market $239,000 Active 34 DOM
-
2026-05-31days on market $239,000 Active 33 DOM
-
2026-04-28$239,000 Active 177-char remark
ⓘ Source: listings_history table (triggers on properties + properties_extension) + one-shot
backfill from property_details.listing_events for pre-trigger history.
Climate risk First Street
- Flood 1/10 Low FEMA zone X (unshaded) · 0% chance over 30 yrs
- Wildfire 3/10 Moderate
- Heat 6/10 Major 7 d/yr ≥101°F today · 15 d/yr by 30 yrs out
- Wind 6/10 Major 27% chance of damaging wind over 30 yrs
- Air quality 2/10 Low 1 unhealthy d/yr today · 3 by 30 yrs out
Nearby sold comps map
Loading sold comps map…
Walkable amenities ~0.75 mi
Loading nearby amenities…
Taxation est. · year 1
- Rental income
- $50,862
- − Mortgage interest
- −$13,388
- − Property taxes
- −$3,585
- − Insurance
- −$1,195
- − Repairs & maintenance
- −$4,069
- − Management
- −$4,069
- − Depreciation
- −$6,953
- Taxable income
- $17,604
- Est. tax owed @ 24.0%
- −$4,225
- After-tax cash flow
- $16,136/yr
For passive investors: Depreciation is non-cash, so a rental often shows a tax loss while cash-flowing — sheltering income. Rental losses are passive: they offset passive income freely, and up to $25,000/yr can offset ordinary (W-2) income if you actively participate and your MAGI is under $100k (phasing out to $0 by $150k); unused losses carry forward. On sale, claimed depreciation is recaptured at up to 25%, and gains may owe capital-gains tax (a 1031 exchange can defer both). Figures are a year-1 estimate at your 24.0% rate — not tax advice; consult a CPA.
Schools (NCES district)
- District
- Avon Grove SD
- NCES district ID
- 4202790
- Math proficiency
- 54% ▼ -13.00%
- Reading proficiency
- 61% ▼ -15.00%
- Median HH income
- $90,335
- Composite
- 52.84/100
- National rank
- #1536
- State rank
- #63 of 539 in PA
Livability — Lincoln University
- Score
- 40/100
- State rank
- #1743
- US rank
- #27315
Category grades
Schools grade is shown separately in the Schools card above.
Census & demographics
- Population (ZIP)
- 12,049
Population outlook (Chester County) Hauer SSP2
- Today (2025)
- 546,756 people
- By 2030
- 559,441 · +2.3%
- By 2040
- 576,377 · +5.4%
- By 2050
- 580,602 · +6.2%
- By 2075
- 581,575 · +6.4%
- By 2100
- 540,922 · -1.1%
Race, ethnicity, and origin ACS 2023
- Neighborhood character
- Predominantly White (72%)
- Race & ethnicity
- White 72% Hispanic / Latino 17% Two or more races 9% Asian 5% Black 2%
- Hispanic origin (detail)
- Mexican 14% Puerto Rican 1%
- Common ancestry
- Romanian 4% Italian 3% Slovak 2%
- Foreign-born
- 9% · Canada, Vietnam, China
- Languages at home
- 86% English-only · Spanish 10% Other Asian/Pacific 1% Other Indo-European 1%
Political lean MEDSL · Chester
- 2024 margin
- D (+14.5) · D 56.7% · R 42.2% · Other 1.0%
- 2008→2024 swing
- +5.2pp toward D · 2008: 9.2pp · 2024: 14.5pp
- All cycles
- 2024: D+14.5 2020: D+17.0 2016: D+9.2 2012: R+0.4 2008: D+9.2
Not yet ingested
- Civics
- —
Market trends
- HPI YoY
- ▼ -102.59%
- Current HPI
- 268.0284
- Rent YoY
- —
- Metro
- —
- State GDP YoY
- ▲ 1.68%
- F500 in state
- 34
Industry mix (Fortune 500 HQ in PA)
| Industry | F500 HQs | Revenue |
|---|---|---|
| Healthcare | 2 | $309B |
|
||
| Insurance | 2 | $27B |
|
||
| Telecommunications / Media | 1 | $124B |
|
||
| Industrial Distribution | 1 | $22B |
|
||
| Financial Services | 1 | $20B |
|
||
| Chemicals / Materials | 1 | $18B |
|
||
Cash-flow waterfall
monthlySold comps — $/sqft
last 12 mo · ≤1 miLoading sold comps…