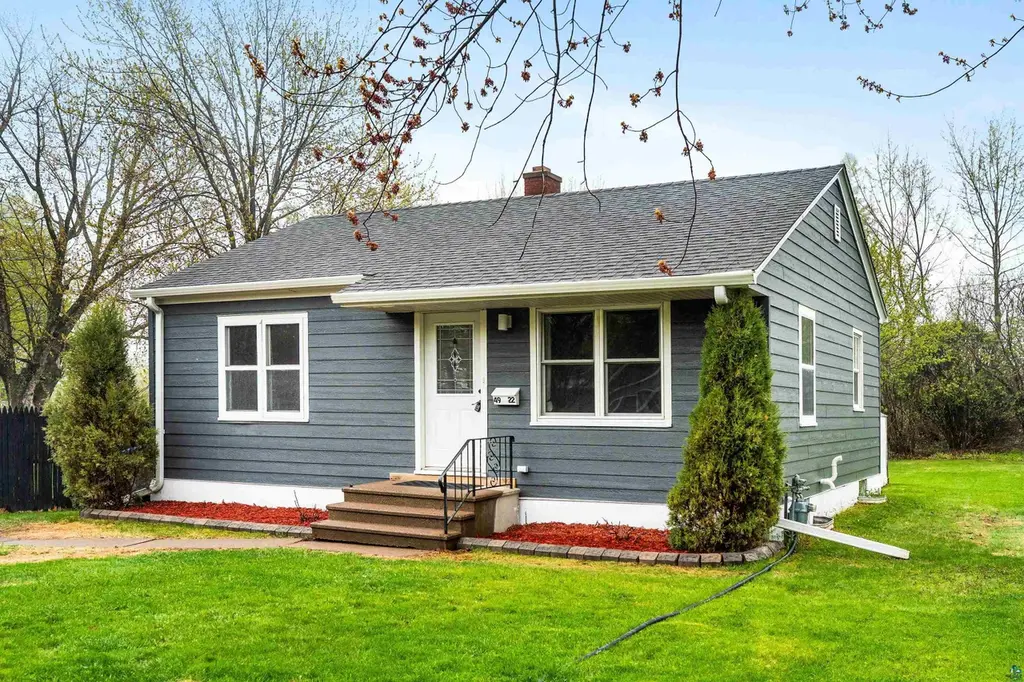
4922 Glenwood St · Duluth, MN
Flood risk 1/10 · Minimal
- FEMA flood zone
- X
- Chance of flooding over 30 yrs
- 0.0%
- Est. flood insurance / yr
- $473 – $860
Fire risk 1/10 · Minimal
- Est. fire insurance / yr
- $888 – $1,650
Heat risk 1/10 · Minimal
- Hot days now (above 90°F)
- 7 days/yr
- Hot days in 30 yrs
- 13 days/yr
Wind risk 1/10 · Minimal
- Chance of severe wind over 30 yrs
- —
Air-quality risk 2/10 · Minimal
- Unhealthy air days now
- 0 days/yr
- Unhealthy air days in 30 yrs
- 1 days/yr
Risk factors via First Street. Map © Google.
Why this score? — see what drove the F grade
The composite is a weighted blend of 9 inputs, each scored 0–100. Each bar is that input's sub-score; the figure is the points it added to the 100-point composite (weight × sub-score).
- Cash flow +12.4/30.0
- Schools +4.2/10.0
- Livability +4.1/5.0
- DSCR +3.7/10.0
- 1% rule +3.1/10.0
- Rent growth +2.5/5.0
- Condition / age +2.5/5.0
- ARV discount +0.6/15.0
- Appreciation +0.0/10.0
$259,000
🖨 Deal sheet (PDF) 📄 Offer letter ✓ Due diligence
Listing remarks MLS
Ready to move in! Clean two bedroom bungalow. Aluminum siding, off-street parking. Conveniently located near schools and the bus line.
Key facts
- Alley access
- Lp smartside siding
- Updated ranch
Tags
Property features AI
Exterior
- Parking: Off-street parking
- Utilities: Public water; Public sewer
- Home design: Single-family detached home; One-story
- Construction: Other construction materials; Full, partially finished basement
- Exterior features: Patio; Fenced yard; Shed
Interior
- Kitchen: Eat-in kitchen
- Bedrooms: Primary bedroom on the main level
- Flooring: Hardwood floors
- Bathrooms: 1 full bathroom
- Heating & cooling: Forced-air heating; Natural gas heating
- Interior features: Eat-in kitchen; Main-level primary bedroom
Neighborhood map
What this means for you Summary
Snapshot
- This is a 2-bed/1.0-bath single-family listed at $259k.
Deal economics
- At list price, monthly cash flow is $-41 ($-494/yr) — negative.
- To cash-flow at today's rent, offer at most $252k (2.8% below list).
- To meet the 1% rule (rent ≥ 1% of price), the offer needs to be $210k (18.9% below list).
- Recommended offer: $210k (18.9% below list) — sets the bar for 1% rule.
- Cap rate 6.1% vs local median 4.9% in Duluth — meaningfully above typical; check what's discounted (condition, days-on-market, listing class) to confirm the premium yield is real.
Location & tenants
- Location reads 82/100 on livability (#36 in MN, #1,060 nationally) — a professional / high-income tenant draw. Strengths: commute A+, cost of living A+, housing A+; Watch: amenities F.
- Duluth Public School District (urban): math 44% / reading 55% proficiency, ranked #132 of 301 in MN (top 44%) — families likely to look elsewhere, expect single-tenant / working-renter base with shorter leases.
- Zoned schools: Lester Park Elementary (math 73% / reading 77%, grade A, #31 of 857 statewide, top 4%, 575 students, 20% FRL); Ordean East Middle School (math 45% / reading 61%, grade C+, #53 of 258 statewide, top 22%, 989 students, 26% FRL); East High School (math 42% / reading 73%, grade C, #59 of 471 statewide, top 13%, 1,494 students, 23% FRL) — zoned schools average 23% FRL vs 39% district-wide (16 pts lower); this property's tenant base skews higher-income than the district average.
- Zoned-school proficiency averages 62% at this address vs 50% district-wide (+12 pts) — the actual schools serving this property are materially stronger than the Duluth Public School District average implies; a family-tenant draw the district grade alone would hide.
- Market conditions: 100 active listings in the ZIP; 1 comparable units currently listed for rent nearby; 639 units permitted in St. Louis County in 2024 (338 in 5+ unit buildings).
Forward outlook
- Local home prices are declining (-3.0%/yr); year-one equity from $2k of loan paydown is wiped out by about $8k of value loss. Plan a longer hold.
Negotiation context
- Only 9 days on market — expect competitive offers; lowballing is unlikely to land.
- 5 sale attempts since 18y ago with the ask held roughly flat each time — persistent listings suggest the price (not the market) is what's stuck; bring a comps-based counter.
- Current owner paid $140k; list at $259k implies a 85% gain — meaningful room to come down on a strong offer.
Risks & watch-outs
- Watch-outs: built in 1948 — expect roof / HVAC / electrical / plumbing capex.
Questions for the listing agent
- What do current leases actually rent for vs. the listed asking? Can we see a recent rent roll and the last 12 months of T-12 income?
- Built in 1948 — when were the roof, HVAC, electrical panel, plumbing, and water heater last replaced?
- Is there a deadline driving the sale (1031 exchange, divorce, estate, relocation)? That informs how much negotiation room exists.
- Schools are B-rated — typically a magnet for longer-tenancy family renters. What's the average tenant stay here, and is there a school-zone premium baked into asking?
- The area grade is low — what's the realistic commute time and amenity access for the typical tenant pool here? Any planned neighborhood developments (good or bad) we should know about?
- What's the average days-on-market for RENTAL listings here right now (not sales)? A rising rental-DOM trend means longer vacancies and softer asking-rent achievability than the comps imply.
- What's the recent tenant-quality profile in this submarket — average credit score on applications, eviction rate, late-payment / NSF rate, and stable-employment percentage? A property-management company in the area should have these aggregated.
- How much new for-sale + rental construction is in the pipeline within 1–3 miles? Heavy new supply typically softens prices + rents 12–24 months out; constrained supply supports both.
Investment metrics
- 1% rule
- 0.81% ✗
- Cap rate
- 6.10%
- Cash-on-cash
- -0.68%
- DSCR
- 0.97
- GRM
- 10.3
CMA / ARV
- ARV (on-the-fly)
- $224,640
- Comps found
- 3
Show comp detail 3 sales within ~0.75 mi
| Address | Dist | Beds/Ba | Sqft | Sold | Price | $/sf | Match |
|---|---|---|---|---|---|---|---|
| 4921 Oneida St | 0.04mi | 2/1.0 | 748 (-4%) | 12mo | $205,000 | $274 | 81 |
| 5307 Glendale St | 0.49mi | 2/1.0 | 864 (+11%) | 14mo | $275,125 | $318 | 48 |
| 801 N 46th Ave Ave E | 0.75mi | 2/1.0 | 864 (+11%) | 22mo | $248,900 | $288 | 29 |
Match score weights: distance 35% · size 25% · config 20% · recency 20%. Top-matched comps best support the ARV.
Projected returns pro-forma
-3.0% appreciation · 3.0% rent growth · sell at horizon
- IRR
- -17.4%
- Equity multiple
- 0.38×
- Total profit
- $-44,613
- Equity at exit
- $38,618
- IRR
- -9.5%
- Equity multiple
- 0.42×
- Total profit
- $-42,317
- Equity at exit
- $22,394
Cash invested: $72,520 (down + closing). Projections, not guarantees.
Landlord ↔ Tenant lean methodology
- Overall (STATE)
- 46 Balanced
- State Minnesota
- 46 Balanced · D+2
- County
- — inherits STATE
- City
- — inherits STATE
ZIP-level market 55804
- Active inventory
- 100
- Price-to-rent
- 10.3×
Monthly cashflow live
- Estimated rent
- $2,100 medium interval (Pro) →
- Mortgage (P&I)
- −$1,358
- Tax from tax record
- −$234 /mo · $2,808/yr
- Insurance
- −$108
- HOA
- −$0
- Vacancy / Maint / Mgmt
- −$441
- Net cashflow
- $-41
Break-even live
Sensitivity live
| Price | -10% $105 | -5% $32 | +0% $-41 | +5% $-114 | +10% $-188 |
|---|---|---|---|---|---|
| Rent | -10% $-207 | -5% $-124 | +0% $-41 | +5% $42 | +10% $125 |
| Rate | -1.0pp $89 | -0.5pp $25 | base $-41 | +0.5pp $-108 | +1.0pp $-177 |
UW: 25.0% down · 7.5% · 30yr · 1.5% tax · 5.0% vac · 8.0% maint · 8.0% mgmt
Financing live
Cash to close
- Down payment
- $64,750
- Closing costs
- $7,770
- Reserves months
- —
- Total cash needed
- —
Loan-product check · same deal, 3 products live
Conventional
25% down · 7.5% · 30yr
- Down + closing
- —
- Monthly P&I
- —
- Monthly cashflow
- —
- DSCR
- —
- Eligible?
- —
Personal DTI + credit; lowest rate.
DSCR
20% down · 8.5% · 30yr
- Down + closing
- —
- Monthly P&I
- —
- Monthly cashflow
- —
- DSCR
- —
- Eligible?
- —
No personal income docs; deal must DSCR.
Hard money
10% down · 12.0% · 12mo
- Down + closing
- —
- Monthly P&I
- —
- Monthly cashflow
- —
- DSCR
- —
- Eligible?
- —
Short-term bridge; refi at stabilization.
Rent comps 1 comps
| Address | Beds | Baths | Sqft | Rent | $/sqft | DOM | Units | Dist |
|---|---|---|---|---|---|---|---|---|
| 5090 London Rd Unit 1 Duluth, MN | 2.0 | 2.0 | 959 | $2,100 | $2.19 | 15d | 1 | 0.58mi |
Listing history 9 events
-
2026-05-20$259,000 Active
-
2020-04-07soldstatus $140,000
-
2020-04-06soldstatus $140,000 134-char remark
Show marketing remark (134 chars)
Ready to move in! Clean two bedroom bungalow. Aluminum siding, off-street parking. Conveniently located near schools and the bus line.
-
2020-03-03$129,900 134-char remark
Show marketing remark (134 chars)
Ready to move in! Clean two bedroom bungalow. Aluminum siding, off-street parking. Conveniently located near schools and the bus line.
-
2012-11-07soldstatus $95,000
-
2012-10-29soldstatus $95,000 230-char remark
Show marketing remark (230 chars)
NEW LISTING! MOVE-IN READY! COZY & CLEAN 2 BR LAKESIDE BUNGALOW. HOME FEATURES NEWER ROOF, ALUM SIDING, OFF ST PARKING & NICE SIZED LEVEL LOT. AFFORDABLE HOME & CONVENIENT LOCATION NEAR SCHOOLS & BUSLINE.
-
2012-06-19$104,900 230-char remark
Show marketing remark (230 chars)
NEW LISTING! MOVE-IN READY! COZY & CLEAN 2 BR LAKESIDE BUNGALOW. HOME FEATURES NEWER ROOF, ALUM SIDING, OFF ST PARKING & NICE SIZED LEVEL LOT. AFFORDABLE HOME & CONVENIENT LOCATION NEAR SCHOOLS & BUSLINE.
-
2009-05-14$116,900
-
2008-09-04$119,900
ⓘ Source: listings_history table (triggers on properties + properties_extension) + one-shot
backfill from property_details.listing_events for pre-trigger history.
Tax reassessment forecast MN · Partial reset (capped growth)
- Current annual tax
- $2,808 · $234/mo
- Projected year-2 tax
- $2,854 · $238/mo
- Expected delta
- +$46/yr (+$4/mo · 1.7%)
ⓘ Screening estimate from a state-policy table — verify with the county assessor before closing.
Climate risk First Street
- Flood 1/10 Low FEMA zone X · 0% chance over 30 yrs
- Wildfire 1/10 Low
- Heat 1/10 Low 7 d/yr ≥90°F today · 13 d/yr by 30 yrs out
- Wind 1/10 Low
- Air quality 2/10 Low 0 unhealthy d/yr today · 1 by 30 yrs out
Nearby sold comps map
Loading sold comps map…
Walkable amenities ~0.75 mi
Loading nearby amenities…
Taxation est. · year 1
- Rental income
- $25,200
- − Mortgage interest
- −$14,508
- − Property taxes
- −$2,808
- − Insurance
- −$1,295
- − Repairs & maintenance
- −$2,016
- − Management
- −$2,016
- − Depreciation
- −$7,535
- Taxable loss
- −$4,978
- Est. tax savings @ 24.0%
- +$1,195
- After-tax cash flow
- $701/yr
For passive investors: Depreciation is non-cash, so a rental often shows a tax loss while cash-flowing — sheltering income. Rental losses are passive: they offset passive income freely, and up to $25,000/yr can offset ordinary (W-2) income if you actively participate and your MAGI is under $100k (phasing out to $0 by $150k); unused losses carry forward. On sale, claimed depreciation is recaptured at up to 25%, and gains may owe capital-gains tax (a 1031 exchange can defer both). Figures are a year-1 estimate at your 24.0% rate — not tax advice; consult a CPA.
Schools (NCES district)
- District
- Duluth Public School District
- NCES district ID
- 2711040
- Math proficiency
- 44% ▼ -10.00%
- Reading proficiency
- 55% ▼ -6.00%
- Median HH income
- $45,692
- Composite
- 41.92/100
- National rank
- #3360
- State rank
- #132 of 301 in MN
Livability — Duluth
- Score
- 82/100
- State rank
- #36
- US rank
- #1060
Category grades
Schools grade is shown separately in the Schools card above.
Census & demographics
- Census place
- Duluth, MN
- City population
- 71,097
- Population (ZIP)
- 16,018
Population outlook (St. Louis County) Hauer SSP2
- Today (2025)
- 202,411 people
- By 2030
- 203,234 · +0.4%
- By 2040
- 202,520 · +0.1%
- By 2050
- 200,853 · -0.8%
- By 2075
- 200,943 · -0.7%
- By 2100
- 192,058 · -5.1%
Race, ethnicity, and origin ACS 2023
- Neighborhood character
- Predominantly White (92%)
- Race & ethnicity
- White 92% Two or more races 5% Hispanic / Latino 1% Asian 1%
- Common ancestry
- Portuguese 14% Scottish 4% Romanian 4%
- Foreign-born
- 3% · Canada
- Languages at home
- 96% English-only · Spanish 1%
Political lean MEDSL · St. Louis
- 2024 margin
- D (+13.7) · D 55.9% · R 42.2% · Other 1.8%
- 2008→2024 swing
- -18.8pp toward R · 2008: 32.5pp · 2024: 13.7pp
- All cycles
- 2024: D+13.7 2020: D+15.6 2016: D+11.8 2012: D+29.6 2008: D+32.5
Not yet ingested
- Civics
- —
Market trends
- HPI YoY
- ▼ -253.94%
- Current HPI
- 199.4064
- Rent YoY
- —
- Metro
- —
- State GDP YoY
- ▲ 2.41%
- F500 in state
- 34
Industry mix (Fortune 500 HQ in MN)
| Industry | F500 HQs | Revenue |
|---|---|---|
| Healthcare | 2 | $407B |
|
||
| Retail | 2 | $150B |
|
||
| Consumer Goods | 2 | $32B |
|
||
| Industrial Machinery | 2 | $6B |
|
||
| Agriculture | 1 | $40B |
|
||
| Healthcare / Medical Devices | 1 | $32B |
|
||
Price history
+116.0% since first listed9 events — show timeline
- 2026-05-20 Listed $259,000 LSAR
- 2020-04-07 Sold (Public Records) $140,000 Public Records
- 2020-04-06 Sold (MLS) $140,000 LSAR
- 2020-03-03 Listed $129,900 LSAR
- 2012-11-07 Sold (Public Records) $95,000 Public Records
- 2012-10-29 Sold (MLS) $95,000 NORTHSTARMLS as Distributed by MLS Grid
- 2012-06-19 Listed $104,900 NORTHSTARMLS as Distributed by MLS Grid
- 2009-05-14 Listed $116,900 NORTHSTARMLS as Distributed by MLS Grid
- 2008-09-04 Listed $119,900 NORTHSTARMLS as Distributed by MLS Grid
Property tax history
+7.7%/yrLatest (2025): $2,808 · +10.6% YoY. Source: county tax records.
Cash-flow waterfall
monthlySold comps — $/sqft
last 12 mo · ≤1 miLoading sold comps…