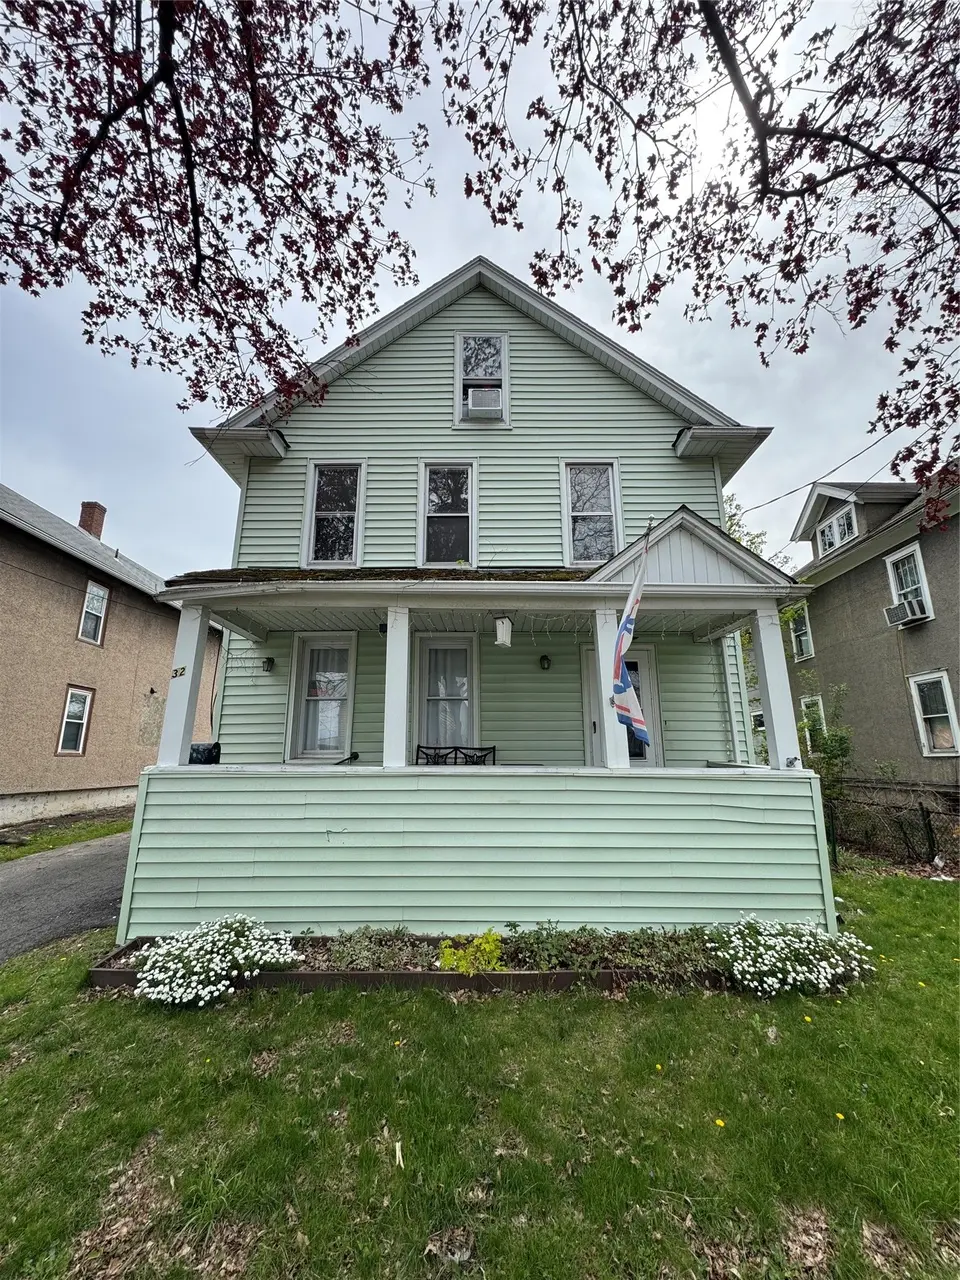
32 St Cyril Ave · Binghamton, NY
Flood risk 8/10 · Major
- FEMA flood zone
- X (shaded)
- Chance of flooding over 30 yrs
- 0.78%
- Est. flood insurance / yr
- $473 – $860
Fire risk 2/10 · Minimal
- Est. fire insurance / yr
- $691 – $1,283
Heat risk 3/10 · Minor
- Hot days now (above 92°F)
- 7 days/yr
- Hot days in 30 yrs
- 16 days/yr
Wind risk 2/10 · Minimal
- Chance of severe wind over 30 yrs
- 1.0%
Air-quality risk 2/10 · Minimal
- Unhealthy air days now
- 0 days/yr
- Unhealthy air days in 30 yrs
- 1 days/yr
Risk factors via First Street. Map © Google.
Why this score? — see what drove the B+ grade
The composite is a weighted blend of 9 inputs, each scored 0–100. Each bar is that input's sub-score; the figure is the points it added to the 100-point composite (weight × sub-score).
- Cash flow +30.0/30.0
- ARV discount +15.0/15.0
- 1% rule +10.0/10.0
- DSCR +10.0/10.0
- Rent growth +5.0/5.0
- Livability +3.9/5.0
- Schools +3.0/10.0
- Condition / age +2.5/5.0
- Appreciation +0.0/10.0
$84,999
🖨 Deal sheet 📄 Offer letter ✓ Due diligence
Listing remarks MLS
This is a FannieMae Home Path property. This property is approved for FannieMae HomePath renovation mortgage. Great space! Hardwoods, large living room, dining room, enclosed porch for warm weather hang outs! Central air!!Easy location off highway, close to shopping, services.
Key facts
- Flat level yard
- Newer roof
- Front porch
Tags
Property features AI
Exterior
- Parking: Detached garage (1 car)
- Utilities: Public water; Public sewer
- Home design: Single-family residence; Two-story home; Residential property
- Construction: Vinyl siding; Built as a two-level structure
- Exterior features: Covered porch; Level lot
Interior
- Kitchen: Cooktop, Range, Refrigerator
- Flooring: Hardwood floors; Vinyl flooring
- Bathrooms: 1 full bathroom
- Heating & cooling: Forced air heating; Wall/window air conditioning unit(s)
- Interior features: Cooktop, Range, Refrigerator, Gas water heater; 8 total rooms
Neighborhood map
What this means for you Summary
Snapshot
- This is a 2-bed/1.0-bath single-family listed at $85k.
Deal economics
- At list price, monthly cash flow is $537 ($6k/yr) — positive.
- The deal already cash-flows at list — no discount required.
- Meets the 1% rule at list price ($1k rent vs $85k).
- Cap rate 14.7% vs local median 6.4% in Binghamton — top-decile yield for the area; either an underpriced asset or a hidden risk that comps aren't pricing in. Stress-test before assuming the spread holds.
Location & tenants
- Location reads 78/100 on livability (#174 in NY, #2,710 nationally) — a middle-class / working-renter tenant base. Strengths: amenities A+, commute A+, cost of living A+; Watch: crime F, employment F.
- Binghamton City School District (urban): math 30% / reading 44% proficiency, ranked #557 of 590 in NY (top 94%) — families likely to look elsewhere, expect single-tenant / working-renter base with shorter leases; 61% free/reduced lunch — lower-income household profile, screen leases tightly.
- Zoned schools: Woodrow Wilson School (math 8% / reading 27%, grade F, #2,004 of 2,108 statewide, top 95%, 352 students, 76% FRL) — zoned schools average 76% FRL vs 61% district-wide (16 pts higher); higher-poverty schools than district average — tighter screening recommended.
- Zoned-school proficiency averages 17% at this address vs 37% district-wide (-20 pts) — the specific schools serving this property underperform the Binghamton City School District average; the district grade overstates school quality for this exact location.
- Market conditions: Rents rising fast (+11.2%/yr); 136 active listings in the ZIP; 25 comparable units currently listed for rent nearby; rentals lingering (median 44d on market — plan ~5-8 weeks vacancy on turnover, expect pricing pressure); 56% of comp listings sitting > 30 days — soft ceiling on asking rent; 340 units permitted in Broome County in 2024 (269 in 5+ unit buildings).
Forward outlook
- Local home prices are declining (-3.0%/yr); year-one equity from $587 of loan paydown is wiped out by about $3k of value loss. Plan a longer hold.
- Broome County population projected at -13% by 2050 — secular population decline; favor cash flow + early exit over multi-decade hold.
- At projected returns (-3.0% appreciation + 8.0% rent growth), your $24k cash investment doubles in ~4 years — after that, you're playing with house money.
Negotiation context
- Only 13 days on market — expect competitive offers; lowballing is unlikely to land.
- 2 sale attempts since 12y ago; this cycle's ask has dropped $10k (10%) from the opening price — seller is motivated, your offer sets the floor, not the list.
- Current owner paid $65k; 31% above their basis — modest negotiation headroom, anchor on the comps not their cost.
Risks & watch-outs
- Watch-outs: flood insurance adds $56/mo; built in 1930 — expect roof / HVAC / electrical / plumbing capex.
- Climate carrying-cost: severe flood risk — expect insurance premiums to compound above CPI over the hold.
Questions for the listing agent
- Built in 1930 — when were the roof, HVAC, electrical panel, plumbing, and water heater last replaced?
- What's the actual annual flood-insurance premium (NFIP or private), and is the property in a SFHA with mandatory coverage?
- Is there a deadline driving the sale (1031 exchange, divorce, estate, relocation)? That informs how much negotiation room exists.
- Schools are D-rated, which usually means shorter tenancies and higher turnover. Who's the typical renter profile here, and what's been the actual vacancy rate?
- Crime grade is F in this area — have there been break-ins, vandalism, or insurance claims at this property in the last 3 years? What carrier currently insures it and at what premium?
- What's the average days-on-market for RENTAL listings here right now (not sales)? A rising rental-DOM trend means longer vacancies and softer asking-rent achievability than the comps imply.
- What's the recent tenant-quality profile in this submarket — average credit score on applications, eviction rate, late-payment / NSF rate, and stable-employment percentage? A property-management company in the area should have these aggregated.
- How much new for-sale + rental construction is in the pipeline within 1–3 miles? Heavy new supply typically softens prices + rents 12–24 months out; constrained supply supports both.
Investment metrics
- 1% rule
- 1.76% ✓
- Cap rate
- 14.65%
- Cash-on-cash
- 29.86%
- DSCR
- 2.33
- GRM
- 4.7
CMA / ARV
- ARV (median comp)
- $108,110
- List price
- $84,999
- Delta
- -21.38%
- Verdict
- UNDERPRICED
- Comps
- 20 within 1.0 mi
Show comp detail 12 sales within ~0.75 mi
| Address | Dist | Beds/Ba | Sqft | Sold | Price | $/sf | Match |
|---|---|---|---|---|---|---|---|
| 39 Elm St | 0.19mi | 3/1.0 (+1) | 1,366 (+2%) | 2mo | $45,000 | $33 | 81 |
| 42 Spring Ave | 0.19mi | 3/1.0 (+1) | 1,386 (+3%) | 14mo | $90,000 | $65 | 69 |
| 184 Oak St | 0.37mi | 3/1.5 (+1) | 1,320 (-2%) | 8mo | $120,000 | $91 | 67 |
| 29 Saint Cyril Ave | 0.02mi | 3/1.0 (+1) | 1,168 (-13%) | 12mo | $127,000 | $109 | 62 |
| 32 May St | 0.36mi | 3/2.5 (+1) | 1,376 (+2%) | 12mo | $170,000 | $124 | 58 |
| 53 Thorp St | 0.35mi | 3/1.5 (+1) | 1,445 (+8%) | 8mo | $135,000 | $93 | 57 |
| 20 Franklin St | 0.59mi | 3/1.5 (+1) | 1,320 (-2%) | 9mo | $100,000 | $76 | 55 |
| 4 Holland Ave | 0.55mi | 3/2.0 (+1) | 1,320 (-2%) | 9mo | $100,000 | $76 | 55 |
| 167 Prospect St | 0.43mi | 3/2.0 (+1) | 1,448 (+8%) | 8mo | $144,000 | $99 | 51 |
| 78 Chestnut St | 0.68mi | 3/2.0 (+1) | 1,445 (+8%) | 8mo | $265,000 | $183 | 40 |
| 43 Clarke St | 0.51mi | 3/1.0 (+1) | 1,158 (-14%) | 13mo | $125,000 | $108 | 37 |
| 40.5 Julian St | 0.69mi | 3/1.5 (+1) | 1,528 (+14%) | 8mo | $180,000 | $118 | 31 |
Match score weights: distance 35% · size 25% · config 20% · recency 20%. Top-matched comps best support the ARV.
Projected returns pro-forma
-3.0% appreciation · 8.0% rent growth · sell at horizon
- IRR
- 26.8%
- Equity multiple
- 2.19×
- Total profit
- $28,352
- Equity at exit
- $12,674
- IRR
- 37.5%
- Equity multiple
- 5.41×
- Total profit
- $104,844
- Equity at exit
- $7,349
Cash invested: $23,800 (down + closing). Projections, not guarantees.
Landlord ↔ Tenant lean methodology
- Overall (STATE)
- 15 Strongly Tenant-Friendly
- State New York
- 15 Strongly Tenant-Friendly · D+10
- County
- — inherits STATE
- City
- — inherits STATE
ZIP-level market 13905
- Home prices YoY
- -31.1%
- Rents YoY
- 11.2%
- Active inventory
- 136
- Price-to-rent
- 4.7×
Monthly cashflow live
- Estimated rent
- $1,493 high interval (Pro) →
- Mortgage (P&I)
- −$446
- Tax est. 1.5%
- −$106 /mo · $1,275/yr
- Insurance
- −$35
- Flood insurance flood zone
- −$56 /mo · $666/yr
- HOA
- −$0
- Vacancy / Maint / Mgmt
- −$314
- Net cashflow
- $537
Break-even live
UW: 25.0% down · 7.5% · 30yr · 1.5% tax · 5.0% vac · 8.0% maint · 8.0% mgmt
Financing live
Cash to close
- Down payment
- $21,250
- Closing costs
- $2,550
- Reserves months
- —
- Total cash needed
- —
Loan-product check · same deal, 3 products live
Conventional
25% down · 7.5% · 30yr
- Down + closing
- —
- Monthly P&I
- —
- Monthly cashflow
- —
- DSCR
- —
- Eligible?
- —
Personal DTI + credit; lowest rate.
DSCR
20% down · 8.5% · 30yr
- Down + closing
- —
- Monthly P&I
- —
- Monthly cashflow
- —
- DSCR
- —
- Eligible?
- —
No personal income docs; deal must DSCR.
Hard money
10% down · 12.0% · 12mo
- Down + closing
- —
- Monthly P&I
- —
- Monthly cashflow
- —
- DSCR
- —
- Eligible?
- —
Short-term bridge; refi at stabilization.
Rent comps 25 comps
| Address | Beds | Baths | Sqft | Rent | $/sqft | DOM | Units | Dist |
|---|---|---|---|---|---|---|---|---|
| 4 Erie St Unit 2 Binghamton, NY | 3.0 | 1.0 | 1075 | $1,200 | $1.12 | 43d | 1 | 0.25mi |
| 46 North St Unit 4 Binghamton, NY | 2.0 | 1.0 | 1000 | $1,600 | $1.60 | 13d | 1 | 0.40mi |
| 167 Oak St Unit 1 Binghamton, NY | 2.0 | 1.0 | 923 | $1,300 | $1.41 | 43d | 1 | 0.41mi |
| 171 Chapin St Unit 3rd FL Binghamton, NY | 2.0 | 1.0 | 1135 | $1,500 | $1.32 | 43d | 1 | 0.43mi |
| 36 Haendel St Unit 1 Binghamton, NY | 3.0 | 1.0 | 1600 | $1,650 | $1.03 | 43d | 1 | 0.63mi |
| 36 Haendel St Unit Second Floor Binghamton, NY | 3.0 | 1.0 | 1200 | $1,450 | $1.21 | 43d | 1 | 0.63mi |
| 53 Seminary Ave Unit 1 Binghamton, NY | 2.0 | 1.0 | 1722 | $925 | $0.54 | 20d | 1 | 0.72mi |
| 263 Main St Binghamton, NY | 2.0 | 1.0 | 920 | $1,200 | $1.30 | 13d | 1 | 0.76mi |
| 186 State St Binghamton, NY | 1.0 | 1.0 | 1600 | $1,950 | $1.22 | 43d | 1 | 0.80mi |
| 16 Highland Ave Unit 1 Binghamton, NY | 3.0 | 1.0 | 1400 | $1,650 | $1.18 | 43d | 1 | 0.84mi |
| 296 Main St Unit 6 Binghamton, NY | 3.0 | 1.0 | 1200 | $1,250 | $1.04 | 13d | 1 | 0.88mi |
| 73 Leroy St Unit 02 Binghamton, NY | 3.0 | 1.0 | 1100 | $1,950 | $1.77 | 43d | 1 | 0.88mi |
| 133 Crestmont Rd Unit 2 Binghamton, NY | 3.0 | 1.0 | 1300 | $1,900 | $1.46 | 43d | 1 | 0.89mi |
| 50 Front St Binghamton, NY | 1.0 | 1.0 | 1092 | $2,450 | $2.24 | 13d | 8 | 0.92mi |
| 80 State St Unit A 3-1 3 Bed Binghamton, NY | 3.0 | 3.0 | 900 | $900 | $1.00 | 43d | 1 | 0.93mi |
| 99 Helen St Unit 2 Binghamton, NY | 3.0 | 1.0 | 1220 | $1,600 | $1.31 | 43d | 1 | 0.99mi |
| 50 Lathrop Ave Unit 2 Binghamton, NY | 3.0 | 1.0 | 1250 | $1,600 | $1.28 | 13d | 1 | 1.00mi |
| 26 Johnson Ave Unit 1 Binghamton, NY | 3.0 | 1.0 | 1633 | $1,600 | $0.98 | 43d | 1 | 1.05mi |
| 26 Doubleday St Binghamton, NY | 2.0 | 1.0 | 1000 | $1,350 | $1.35 | 43d | 1 | 1.07mi |
| 33 Fayette St Unit 22 Binghamton, NY | 2.0 | 1.0 | 1350 | $1,100 | $0.81 | 13d | 1 | 1.15mi |
| 29 Laurel Ave Unit 2 Binghamton, NY | 3.0 | 1.5 | 1500 | $2,250 | $1.50 | 43d | 1 | 1.24mi |
| 86 Conklin Ave Binghamton, NY | 3.0 | 1.0 | 1316 | $1,600 | $1.22 | 13d | 1 | 1.37mi |
| 90 Conklin Ave Unit 4 Binghamton, NY | 1.0 | 1.0 | 1600 | $575 | $0.36 | 13d | 1 | 1.39mi |
| 528 Chenango St Unit 1 Binghamton, NY | 3.0 | 1.0 | 1250 | $1,500 | $1.20 | 13d | 1 | 1.39mi |
| 127 Burbank Ave Unit 2 Johnson City, NY | 2.0 | 1.0 | 1032 | $1,000 | $0.97 | 20d | 1 | 1.44mi |
Listing history 7 events
-
2026-05-12status Pending 1005-char remark
-
2026-05-06price $84,999 1005-char remark
-
2026-04-29$94,900 Active 1005-char remark
-
2015-12-03soldstatus $65,000
-
2014-08-27soldstatus $27,000 277-char remark
Show marketing remark (277 chars)
This is a FannieMae Home Path property. This property is approved for FannieMae HomePath renovation mortgage. Great space! Hardwoods, large living room, dining room, enclosed porch for warm weather hang outs! Central air!!Easy location off highway, close to shopping, services.
-
2014-03-01$29,900 277-char remark
Show marketing remark (277 chars)
This is a FannieMae Home Path property. This property is approved for FannieMae HomePath renovation mortgage. Great space! Hardwoods, large living room, dining room, enclosed porch for warm weather hang outs! Central air!!Easy location off highway, close to shopping, services.
-
2007-10-26soldstatus $65,000
ⓘ Source: listings_history table (triggers on properties + properties_extension) + one-shot
backfill from property_details.listing_events for pre-trigger history.
Climate risk First Street
- Flood 8/10 Severe FEMA zone X (shaded) · 78% chance over 30 yrs
- Wildfire 2/10 Low
- Heat 3/10 Moderate 7 d/yr ≥92°F today · 16 d/yr by 30 yrs out
- Wind 2/10 Low 100% chance of damaging wind over 30 yrs
- Air quality 2/10 Low 0 unhealthy d/yr today · 1 by 30 yrs out
Nearby sold comps map
Loading sold comps map…
Walkable amenities ~0.75 mi
Loading nearby amenities…
Taxation est. · year 1
- Rental income
- $17,918
- − Mortgage interest
- −$4,761
- − Property taxes
- −$1,275
- − Insurance
- −$1,091
- − Repairs & maintenance
- −$1,433
- − Management
- −$1,433
- − Depreciation
- −$2,473
- Taxable income
- $5,450
- Est. tax owed @ 24.0%
- −$1,308
- After-tax cash flow
- $5,131/yr
For passive investors: Depreciation is non-cash, so a rental often shows a tax loss while cash-flowing — sheltering income. Rental losses are passive: they offset passive income freely, and up to $25,000/yr can offset ordinary (W-2) income if you actively participate and your MAGI is under $100k (phasing out to $0 by $150k); unused losses carry forward. On sale, claimed depreciation is recaptured at up to 25%, and gains may owe capital-gains tax (a 1031 exchange can defer both). Figures are a year-1 estimate at your 24.0% rate — not tax advice; consult a CPA.
Schools (NCES district)
- District
- Binghamton City School District
- NCES district ID
- 3604870
- Math proficiency
- 30% ▬ 0.00%
- Reading proficiency
- 44% ▲ 15.00%
- Median HH income
- $30,475
- Composite
- 30.09/100
- National rank
- #6342
- State rank
- #557 of 590 in NY
Livability — Binghamton
- Score
- 78/100
- State rank
- #174
- US rank
- #2710
Category grades
Schools grade is shown separately in the Schools card above.
Census & demographics
- Census place
- Binghamton, NY
- County
- Broome County · 126,805 people
- City population
- 65,170
- Metro
- Binghamton, NY
- Population (ZIP)
- 27,988
- Household income
- $53,362
- Rent vs Own
- Severe rent burden
- 1875.0
Population outlook (Broome County) Hauer SSP2
- Today (2025)
- 187,989 people
- By 2030
- 183,066 · -2.6%
- By 2040
- 172,228 · -8.4%
- By 2050
- 163,161 · -13.2%
- By 2075
- 153,641 · -18.3%
- By 2100
- 140,851 · -25.1%
Race, ethnicity, and origin ACS 2023
- Neighborhood character
- Predominantly White (68%)
- Race & ethnicity
- White 68% Asian 10% Black 10% Hispanic / Latino 7% Two or more races 7%
- Hispanic origin (detail)
- Mexican 2% Puerto Rican 3%
- Common ancestry
- Romanian 5% Lithuanian 3% Iranian 1%
- Foreign-born
- 11% · Canada, China, Vietnam
- Languages at home
- 87% English-only · Other Indo-European 5% Spanish 2% Other Asian/Pacific 1%
Political lean MEDSL · Broome
- 2024 margin
- Toss-up / Even · D 50.2% · R 49.8%
- 2008→2024 swing
- -7.6pp toward R · 2008: 8.0pp · 2024: 0.4pp
- All cycles
- 2024: D+0.4 2020: D+3.5 2016: R+3.7 2012: D+4.6 2008: D+8.0
Not yet ingested
- Civics
- —
Market trends
- HPI YoY
- ▼ -134.70%
- Current HPI
- 298.9847
- Rent YoY
- ▲ 11.19%
- Metro
- Binghamton, NY
- State GDP YoY
- ▲ 2.60%
- F500 in state
- 92
Industry mix (Fortune 500 HQ in NY)
| Industry | F500 HQs | Revenue |
|---|---|---|
| Financial Services | 10 | $950B |
|
||
| Consumer Goods | 9 | $162B |
|
||
| Insurance | 4 | $225B |
|
||
| Telecommunications | 2 | $144B |
|
||
| Pharmaceuticals | 2 | $112B |
|
||
| Media / Entertainment | 2 | $69B |
|
||
Price history
+30.8% since first listed7 events — show timeline
- 2026-05-12 Pending — GBAOR
- 2026-05-06 Price Changed $84,999 GBAOR
- 2026-04-29 Listed $94,900 GBAOR
- 2015-12-03 Sold (Public Records) $65,000 Public Records
- 2014-08-27 Sold (MLS) $27,000 GBAOR
- 2014-03-01 Listed $29,900 GBAOR
- 2007-10-26 Sold (Public Records) $65,000 Public Records
Property tax history
+7.1%/yrLatest (2025): $4,862 · +0.9% YoY. Source: county tax records.
Cash-flow waterfall
monthlySold comps — $/sqft
last 12 mo · ≤1 miLoading sold comps…