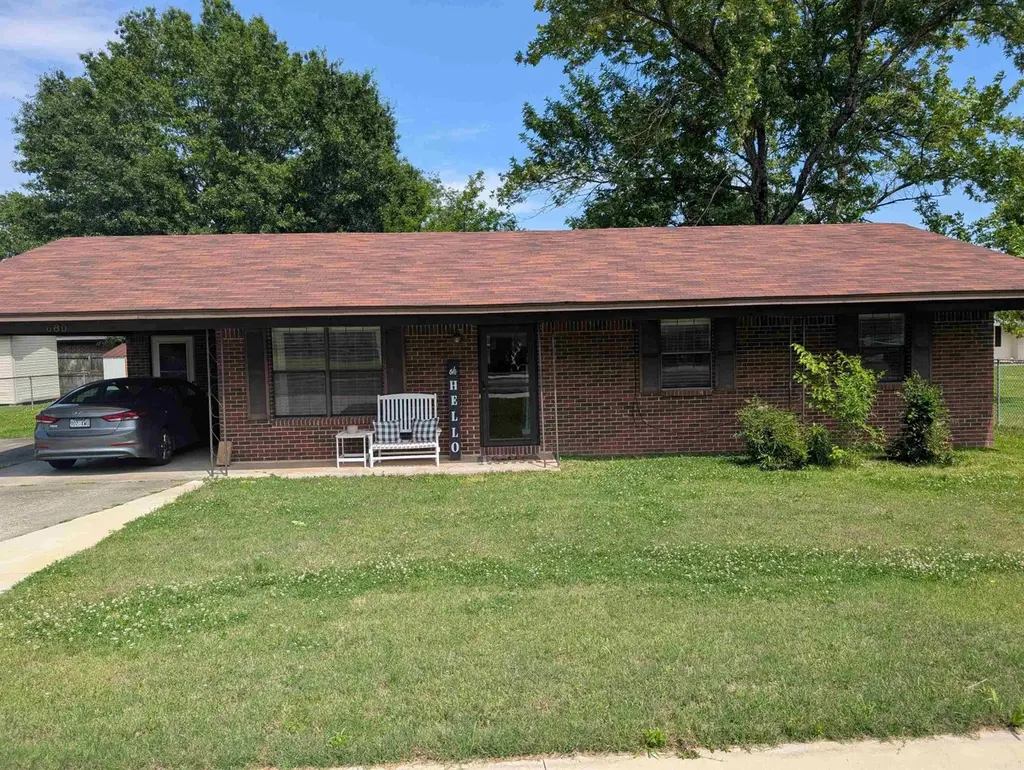
680 E German Ln · Conway, AR
Flood risk 1/10 · Minimal
- FEMA flood zone
- X (unshaded)
- Chance of flooding over 30 yrs
- 0.0%
- Est. flood insurance / yr
- $507 – $1,088
Fire risk 3/10 · Minor
- Est. fire insurance / yr
- $1,499 – $2,785
Heat risk 6/10 · Moderate
- Hot days now (above 111°F)
- 7 days/yr
- Hot days in 30 yrs
- 19 days/yr
Wind risk 4/10 · Minor
- Chance of severe wind over 30 yrs
- 9.0%
Air-quality risk 2/10 · Minimal
- Unhealthy air days now
- 1 days/yr
- Unhealthy air days in 30 yrs
- 1 days/yr
Risk factors via First Street. Map © Google.
Why this score? — see what drove the D+ grade
The composite is a weighted blend of 9 inputs, each scored 0–100. Each bar is that input's sub-score; the figure is the points it added to the 100-point composite (weight × sub-score).
- ARV discount +14.1/15.0
- Cash flow +13.3/30.0
- DSCR +4.0/10.0
- Schools +3.8/10.0
- Livability +3.5/5.0
- 1% rule +2.8/10.0
- Rent growth +2.8/5.0
- Condition / age +2.5/5.0
- Appreciation +0.0/10.0
$232,000
🖨 Deal sheet 📄 Offer letter ✓ Due diligence
Listing remarks MLS
Check out this mostly remolded home with an added 20x20 den and large master bedroom with bay window. All new flooring and paint throughout. Crown molding has been added around windows. New electric Train furnace-2021, AC Unit is 3yrs old. Bonus: 3- 8x10 storage buildings will convey at no value.
Key facts
- Ceiling fans
- Dining area
- Bonus room
Tags
Property features AI
Finance
- Financial info: Financing options include VA, FHA, conventional loans, or cash
Exterior
- Parking: Carport; Parking pads; Space for 4+ cars
- Utilities: Public water; Public sewer; Electric (Co‑op); Cable internet available
- Home design: Brick exterior; Inside city limits
- Construction: Wood shingle roof; Slab foundation
- Exterior features: Fully fenced yard; Paved road access; Level lot
Interior
- Kitchen: Free‑standing stove; Dishwasher
- Flooring: Laminate flooring
- Bathrooms: 2 full bathrooms
- Heating & cooling: Central electric heat; Central electric cooling
- Interior features: Washer connection; Electric dryer connection; Formal living room; Office/study; Workshop/craft room; Bonus room; Laundry room
- Laundry & utility: Washer connection; Electric dryer connection
Neighborhood map
What this means for you Summary
Snapshot
- This is a 3-bed/2.0-bath single-family listed at $232k.
Deal economics
- At list price, monthly cash flow is $-2 ($-23/yr) — negative.
- To cash-flow at today's rent, offer at most $232k (0.1% below list).
- To meet the 1% rule (rent ≥ 1% of price), the offer needs to be $182k (21.5% below list).
- Recommended offer: $182k (21.5% below list) — sets the bar for 1% rule.
- Cap rate 6.3% vs local median 3.9% in Conway — top-decile yield for the area; either an underpriced asset or a hidden risk that comps aren't pricing in. Stress-test before assuming the spread holds.
Location & tenants
- Location reads 69/100 on livability (#71 in AR) — a middle-class / working-renter tenant base. Strengths: cost of living A+, housing A+, schools B; Watch: employment C-, crime F, amenities F.
- Conway School District (urban): math 43% / reading 47% proficiency, ranked #36 of 238 in AR (top 15%) — families likely to look elsewhere, expect single-tenant / working-renter base with shorter leases.
- Market conditions: Rents rising (+1.1%/yr); 187 active listings in the ZIP; 5 comparable units currently listed for rent nearby; rentals at typical pace (median 14d on market — plan ~3-4 weeks tenant-placement turnaround); 865 units permitted in Faulkner County in 2024 (451 in 5+ unit buildings).
- This rent runs 34% of the median local income ($65k/yr) — at the standard rent-burdened threshold; future hikes will face affordability resistance.
Forward outlook
- Local home prices are declining (-3.0%/yr); year-one equity from $2k of loan paydown is wiped out by about $7k of value loss. Plan a longer hold.
- Faulkner County population projected at +32% by 2050 — long-run rental-demand tailwind backs the buy-and-hold thesis.
Negotiation context
- It's been on market 33 days — a 3% lower offer ($225k) is reasonable based on typical stale-listing flexibility.
- 2 sale attempts since 4y ago with the ask held roughly flat each time — persistent listings suggest the price (not the market) is what's stuck; bring a comps-based counter.
- Current owner paid $186k; 25% above their basis — modest negotiation headroom, anchor on the comps not their cost.
Risks & watch-outs
- Climate carrying-cost: extreme-heat days projected 7→19/yr by 2055 (HVAC capex compounding) — expect insurance premiums to compound above CPI over the hold.
Questions for the listing agent
- What do current leases actually rent for vs. the listed asking? Can we see a recent rent roll and the last 12 months of T-12 income?
- It's been on market 33 days. Have you received any prior offers? Is the seller open to a 22% concession, seller financing, or rate buy-down credit?
- Is there a deadline driving the sale (1031 exchange, divorce, estate, relocation)? That informs how much negotiation room exists.
- Schools are B-rated — typically a magnet for longer-tenancy family renters. What's the average tenant stay here, and is there a school-zone premium baked into asking?
- Crime grade is F in this area — have there been break-ins, vandalism, or insurance claims at this property in the last 3 years? What carrier currently insures it and at what premium?
- The area grade is low — what's the realistic commute time and amenity access for the typical tenant pool here? Any planned neighborhood developments (good or bad) we should know about?
- What's the average days-on-market for RENTAL listings here right now (not sales)? A rising rental-DOM trend means longer vacancies and softer asking-rent achievability than the comps imply.
- What's the recent tenant-quality profile in this submarket — average credit score on applications, eviction rate, late-payment / NSF rate, and stable-employment percentage? A property-management company in the area should have these aggregated.
- How much new for-sale + rental construction is in the pipeline within 1–3 miles? Heavy new supply typically softens prices + rents 12–24 months out; constrained supply supports both.
Investment metrics
- 1% rule
- 0.78% ✗
- Cap rate
- 6.28%
- Cash-on-cash
- -0.04%
- DSCR
- 1.00
- GRM
- 10.6
CMA / ARV
- ARV (on-the-fly)
- $271,728
- Comps found
- 12
Show comp detail 12 sales within ~0.75 mi
| Address | Dist | Beds/Ba | Sqft | Sold | Price | $/sf | Match |
|---|---|---|---|---|---|---|---|
| 520 Evening Dr | 0.38mi | 3/2.0 | 1,914 (+4%) | 7mo | $284,800 | $149 | 70 |
| 7 Ginger Dr | 0.27mi | 3/2.0 | 2,004 (+9%) | 3mo | $289,000 | $144 | 70 |
| 1012 Woodside | 0.35mi | 3/1.5 | 1,720 (-6%) | 3mo | $190,000 | $110 | 68 |
| 2130 Shade Tree Dr | 0.41mi | 3/2.0 | 1,760 (-4%) | 7mo | $249,744 | $142 | 68 |
| 7 Jonnathan Dr | 0.24mi | 3/2.0 | 2,000 (+9%) | 9mo | $324,000 | $162 | 67 |
| 60 Sandpiper Ct | 0.19mi | 4/2.0 (+1) | 2,045 (+11%) | 4mo | $280,000 | $137 | 64 |
| 425 Cheyenne Ln | 0.43mi | 3/2.0 | 1,683 (-8%) | 4mo | $255,500 | $152 | 62 |
| 360 Navaho Trl | 0.42mi | 3/2.0 | 1,648 (-10%) | 2mo | $237,500 | $144 | 62 |
| 355 Navajo Trl | 0.46mi | 3/2.0 | 1,668 (-9%) | 6mo | $270,000 | $162 | 58 |
| 30 Hazelwood Rd | 0.43mi | 3/2.0 | 2,101 (+14%) | 2mo | $295,000 | $140 | 54 |
| 29 Gregory Dr | 0.57mi | 3/2.0 | 1,656 (-10%) | 6mo | $245,000 | $148 | 52 |
| 1600 Beautyberry Dr | 0.44mi | 3/2.0 | 1,590 (-13%) | 8mo | $247,500 | $156 | 50 |
Match score weights: distance 35% · size 25% · config 20% · recency 20%. Top-matched comps best support the ARV.
Projected returns pro-forma
-3.0% appreciation · 1.15% rent growth · sell at horizon
- IRR
- -18.3%
- Equity multiple
- 0.37×
- Total profit
- $-41,116
- Equity at exit
- $34,592
- IRR
- -14.3%
- Equity multiple
- 0.24×
- Total profit
- $-49,411
- Equity at exit
- $20,059
Cash invested: $64,960 (down + closing). Projections, not guarantees.
Landlord ↔ Tenant lean methodology
- Overall (STATE)
- 92 Strongly Landlord-Friendly
- State Arkansas
- 92 Strongly Landlord-Friendly · R+14
- County
- — inherits STATE
- City
- — inherits STATE
ZIP-level market 72032
- Home prices YoY
- -17.0%
- Rents YoY
- 1.1%
- Active inventory
- 187
- Price-to-rent
- 10.6×
Monthly cashflow live
- Estimated rent
- $1,820 high interval (Pro) →
- Mortgage (P&I)
- −$1,217
- Tax from tax record
- −$127 /mo · $1,519/yr
- Insurance
- −$97
- HOA
- −$0
- Vacancy / Maint / Mgmt
- −$382
- Net cashflow
- $-2
Break-even live
UW: 25.0% down · 7.5% · 30yr · 1.5% tax · 5.0% vac · 8.0% maint · 8.0% mgmt
Financing live
Cash to close
- Down payment
- $58,000
- Closing costs
- $6,960
- Reserves months
- —
- Total cash needed
- —
Loan-product check · same deal, 3 products live
Conventional
25% down · 7.5% · 30yr
- Down + closing
- —
- Monthly P&I
- —
- Monthly cashflow
- —
- DSCR
- —
- Eligible?
- —
Personal DTI + credit; lowest rate.
DSCR
20% down · 8.5% · 30yr
- Down + closing
- —
- Monthly P&I
- —
- Monthly cashflow
- —
- DSCR
- —
- Eligible?
- —
No personal income docs; deal must DSCR.
Hard money
10% down · 12.0% · 12mo
- Down + closing
- —
- Monthly P&I
- —
- Monthly cashflow
- —
- DSCR
- —
- Eligible?
- —
Short-term bridge; refi at stabilization.
Rent comps 5 comps
| Address | Beds | Baths | Sqft | Rent | $/sqft | DOM | Units | Dist |
|---|---|---|---|---|---|---|---|---|
| 1425 Ola St Conway, AR | 3.0 | 2.0 | 1268 | $2,600 | $2.05 | 23d | 1 | 0.67mi |
| 2010 RichSmith Ln Conway, AR | 1.0–3.0 | 1.0–2.0 | 1018 | $1,310 | $1.29 | 14d | 10 | 0.89mi |
| 1725 Raden St Conway, AR | 4.0 | 2.0 | 1476 | $1,775 | $1.20 | 14d | 1 | 1.06mi |
| 1725 Ryder St Conway, AR | 4.0 | 2.0 | 1476 | $1,725 | $1.17 | 14d | 1 | 1.16mi |
| 1725 Ryder St Conway, AR | 4.0 | 2.0 | 1476 | $1,775 | $1.20 | 23d | 1 | 1.16mi |
Listing history 19 events
-
2026-06-18days on market $232,000 Active 33 DOM
-
2026-06-17days on market $232,000 Active 32 DOM
-
2026-06-16days on market $232,000 Active 31 DOM
-
2026-06-15days on market $232,000 Active 30 DOM
-
2026-06-14days on market $232,000 Active 28 DOM
-
2026-06-10days on market $232,000 Active 25 DOM
-
2026-06-09days on market $232,000 Active 24 DOM
-
2026-06-08statusdays on market $232,000 Active 23 DOM
-
2026-06-07days on market $232,000 Price Change 22 DOM
-
2026-06-03days on market $232,000 Price Change 18 DOM
-
2026-06-02pricestatusdays on market $232,000 Price Change 17 DOM
-
2026-06-01days on market $239,900 Active 16 DOM
-
2026-05-31days on market $239,900 Active 15 DOM
-
2026-05-31days on market $239,900 Active 14 DOM
-
2026-05-15$239,900 New Listing
-
2022-02-17soldstatus $186,000
-
2022-02-16soldstatus $186,000 Sold 297-char remark
Show marketing remark (297 chars)
Check out this mostly remolded home with an added 20x20 den and large master bedroom with bay window. All new flooring and paint throughout. Crown molding has been added around windows. New electric Train furnace-2021, AC Unit is 3yrs old. Bonus: 3- 8x10 storage buildings will convey at no value.
-
2022-01-11historical 297-char remark
Show marketing remark (297 chars)
Check out this mostly remolded home with an added 20x20 den and large master bedroom with bay window. All new flooring and paint throughout. Crown molding has been added around windows. New electric Train furnace-2021, AC Unit is 3yrs old. Bonus: 3- 8x10 storage buildings will convey at no value.
-
2022-01-10$185,500 297-char remark
Show marketing remark (297 chars)
Check out this mostly remolded home with an added 20x20 den and large master bedroom with bay window. All new flooring and paint throughout. Crown molding has been added around windows. New electric Train furnace-2021, AC Unit is 3yrs old. Bonus: 3- 8x10 storage buildings will convey at no value.
ⓘ Source: listings_history table (triggers on properties + properties_extension) + one-shot
backfill from property_details.listing_events for pre-trigger history.
Tax reassessment forecast AR · Resets to sale price
- Current annual tax
- $1,519 · $127/mo
- Projected year-2 tax
- $1,519 · $127/mo
- Expected delta
- $0/yr ($0/mo · 0.0%)
ⓘ Screening estimate from a state-policy table — verify with the county assessor before closing.
Climate risk First Street
- Flood 1/10 Low FEMA zone X (unshaded) · 0% chance over 30 yrs
- Wildfire 3/10 Moderate
- Heat 6/10 Major 7 d/yr ≥111°F today · 19 d/yr by 30 yrs out
- Wind 4/10 Moderate 9% chance of damaging wind over 30 yrs
- Air quality 2/10 Low 1 unhealthy d/yr today · 1 by 30 yrs out
Nearby sold comps map
Loading sold comps map…
Walkable amenities ~0.75 mi
Loading nearby amenities…
Taxation est. · year 1
- Rental income
- $21,843
- − Mortgage interest
- −$12,996
- − Property taxes
- −$1,519
- − Insurance
- −$1,160
- − Repairs & maintenance
- −$1,747
- − Management
- −$1,747
- − Depreciation
- −$6,749
- Taxable loss
- −$4,076
- Est. tax savings @ 24.0%
- +$978
- After-tax cash flow
- $955/yr
For passive investors: Depreciation is non-cash, so a rental often shows a tax loss while cash-flowing — sheltering income. Rental losses are passive: they offset passive income freely, and up to $25,000/yr can offset ordinary (W-2) income if you actively participate and your MAGI is under $100k (phasing out to $0 by $150k); unused losses carry forward. On sale, claimed depreciation is recaptured at up to 25%, and gains may owe capital-gains tax (a 1031 exchange can defer both). Figures are a year-1 estimate at your 24.0% rate — not tax advice; consult a CPA.
Schools (NCES district)
- District
- Conway School District
- NCES district ID
- 0504590
- Math proficiency
- 43% ▼ -17.00%
- Reading proficiency
- 47% ▼ -9.00%
- Median HH income
- $46,270
- Composite
- 38.27/100
- National rank
- #4236
- State rank
- #36 of 238 in AR
Livability — Conway
- Score
- 69/100
- State rank
- #71
- US rank
- #8673
Category grades
Schools grade is shown separately in the Schools card above.
Census & demographics
- Census place
- Conway, AR
- County
- Faulkner County · 103,634 people
- City population
- 84,754
- Metro
- Little Rock-North Little Rock-Conway, AR
- Population (ZIP)
- 34,469
- Household income
- $64,695
- Rent vs Own
- Severe rent burden
- 916.0
Population outlook (Faulkner County) Hauer SSP2
- Today (2025)
- 138,985 people
- By 2030
- 148,264 · +6.7%
- By 2040
- 166,010 · +19.4%
- By 2050
- 183,362 · +31.9%
- By 2075
- 224,593 · +61.6%
- By 2100
- 250,603 · +80.3%
Race, ethnicity, and origin ACS 2023
- Neighborhood character
- Predominantly White (72%)
- Race & ethnicity
- White 72% Black 15% Hispanic / Latino 8% Two or more races 4%
- Hispanic origin (detail)
- Mexican 5%
- Common ancestry
- Slovak 1% Serbian 1% Lithuanian 1%
- Foreign-born
- 5% · Canada
- Languages at home
- 93% English-only · Spanish 6%
Political lean MEDSL · Faulkner
- 2024 margin
- Solid R (+32.3) · D 32.6% · R 64.9% · Other 2.5%
- 2008→2024 swing
- -7.1pp toward R · 2008: -25.3pp · 2024: -32.3pp
- All cycles
- 2024: R+32.3 2020: R+29.5 2016: R+31.6 2012: R+31.7 2008: R+25.3
Not yet ingested
- Civics
- —
Market trends
- HPI YoY
- ▼ -48.15%
- Current HPI
- 234.6331
- Rent YoY
- ▲ 1.15%
- Metro
- Little Rock-North Little Rock-Conway, AR
- State GDP YoY
- ▲ 3.80%
- F500 in state
- 10
Industry mix (Fortune 500 HQ in AR)
| Industry | F500 HQs | Revenue |
|---|---|---|
| Retail | 1 | $681B |
|
||
| Food / Agriculture | 1 | $53B |
|
||
| Retail / Energy | 1 | $22B |
|
||
| Transportation / Logistics | 1 | $12B |
|
||
| Energy | 1 | $4B |
|
||
Price history
+29.3% since first listed5 events — show timeline
- 2026-05-15 Listed $239,900 CARMLS
- 2022-02-17 Sold (Public Records) $186,000 Public Records
- 2022-02-16 Sold (MLS) $186,000 CARMLS
- 2022-01-11 Listing Removed — CARMLS
- 2022-01-10 Listed $185,500 CARMLS
Property tax history
+6.2%/yrLatest (2025): $1,519 · +9.1% YoY. Source: county tax records.
Cash-flow waterfall
monthlySold comps — $/sqft
last 12 mo · ≤1 miLoading sold comps…