6700 N Meridian Ave Unit G · Oklahoma City, OK
Flood risk 1/10 · Minimal
- FEMA flood zone
- X (unshaded)
- Chance of flooding over 30 yrs
- 0.0%
- Est. flood insurance / yr
- $507 – $1,088
Fire risk 1/10 · Minimal
- Est. fire insurance / yr
- $2,463 – $4,575
Heat risk 6/10 · Moderate
- Hot days now (above 106°F)
- 7 days/yr
- Hot days in 30 yrs
- 19 days/yr
Wind risk 2/10 · Minimal
- Chance of severe wind over 30 yrs
- 2.0%
Air-quality risk 2/10 · Minimal
- Unhealthy air days now
- 1 days/yr
- Unhealthy air days in 30 yrs
- 2 days/yr
Risk factors via First Street. Map © Google.
Why this score? — see what drove the D grade
The composite is a weighted blend of 9 inputs, each scored 0–100. Each bar is that input's sub-score; the figure is the points it added to the 100-point composite (weight × sub-score).
- Cash flow +11.8/30.0
- ARV discount +7.5/15.0
- 1% rule +6.8/10.0
- Livability +4.0/5.0
- Rent growth +3.6/5.0
- DSCR +3.5/10.0
- Condition / age +2.5/5.0
- Schools +1.3/10.0
- Appreciation +0.0/10.0
$86,900
🖨 Deal sheet 📄 Offer letter ✓ Due diligence
Listing remarks
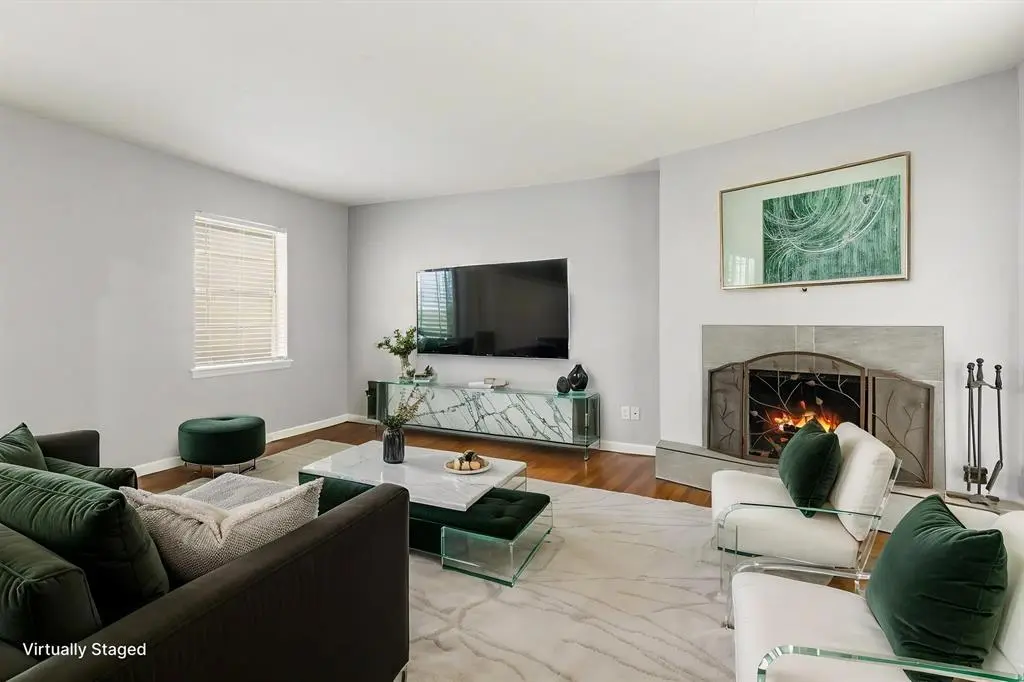
Updated Top-Floor Corner Condo with Direct Access to Lake Hefner Trail This cozy, quality 1-bedroom, 1-bath upstairs corner condo offers 781 sq ft of comfortable, low-maintenance ownership in a highly desirable NW OKC location. Thoughtfully updated with fresh paint, new baseboards, new flooring, modern lighting, and tile flooring in the entryway, kitchen, bathroom, and primary closet/utility space, along with a newly tiled shower and bath area, this home is truly move-in ready. Enjoy added privacy and natural light as a top-floor corner unit, along with a private balcony perfect for relaxing. The living area features a charming wood-burning fireplace, creating a warm and inviting space. Th
Key facts
- Private balcony
- Extensive storage
- $288 HOA
Tags
Property features AI
Finance
- Other: Existing property; No storm shelter; Not homestead; Occupied: No; Home warranty: No
- Financial info: Loan financing available; First right of refusal applies to condo
- HOA & community: Mandatory association dues; Association fee covers common area maintenance, exterior maintenance and partial utilities
Exterior
- Utilities: Cable available; Electricity available; Natural gas available; High-speed internet available; Public water/sewer
- Home design: Condominium (residential); Upper-level unit; East-facing; Corner lot
- Construction: Brick, concrete, frame and vinyl siding construction; Composition roof; Slab foundation
- Exterior features: Balcony; Private fenced pool
Interior
- Kitchen: Built-in electric range; Built-in electric oven
- Bedrooms: 1 bedroom (upper unit)
- Flooring: Combination of laminate and tile
- Bathrooms: 1 full bathroom
- Heating & cooling: Electric heating
- Interior features: Dishwasher; Disposal; Built-in microwave; Refrigerator; Water heater; No in-law/secondary suite; Combo, laminate and tile flooring
- Laundry & utility: Washer and dryer included
Neighborhood map
What this means for you Summary
Snapshot
- This is a 1-bed/1.0-bath condo listed at $87k.
Deal economics
- At list price, monthly cash flow is $-24 ($-284/yr) — negative.
- To cash-flow at today's rent, offer at most $83k (4.8% below list).
- Meets the 1% rule at list price ($1k rent vs $87k).
- Recommended offer: $83k (4.8% below list) — sets the bar for cash-flow.
- Cap rate 6.0% vs local median 3.7% in Oklahoma City — top-decile yield for the area; either an underpriced asset or a hidden risk that comps aren't pricing in. Stress-test before assuming the spread holds.
Location & tenants
- Location reads 80/100 on livability (#3 in OK, #1,635 nationally) — a professional / high-income tenant draw. Strengths: amenities A+, commute A+, cost of living A+; Watch: crime F.
- Putnam City (urban): math 12% / reading 16% proficiency, ranked #227 of 270 in OK (top 84%) — low school quality limits family demand, transient renter base, plan for 1-2y turnover; 65% free/reduced lunch — lower-income household profile, screen leases tightly.
- Zoned schools: Coronado Heights Es (math 18% / reading 18%, grade F, #534 of 845 statewide, top 64%, 460 students, 0% FRL); Putnam City Hs (math 12% / reading 23%, grade F, #307 of 447 statewide, top 69%, 2,014 students, 0% FRL) — zoned schools average 0% FRL vs 65% district-wide (65 pts lower); this property's tenant base skews higher-income than the district average.
- Market conditions: Rents rising fast (+4.3%/yr); 137 active listings in the ZIP; 26 comparable units currently listed for rent nearby; rentals at typical pace (median 21d on market — plan ~3-4 weeks tenant-placement turnaround); solid renter incomes; 5,365 units permitted in Oklahoma County in 2024 (569 in 5+ unit buildings).
- This rent is only 15% of the median local income ($81k/yr) — well below the 30% rent-burden line; pricing power to push rent on renewal without tenant pushback.
Forward outlook
- Local home prices are declining (-3.0%/yr); year-one equity from $601 of loan paydown is wiped out by about $3k of value loss. Plan a longer hold.
- Oklahoma County population projected at +41% by 2050 — long-run rental-demand tailwind backs the buy-and-hold thesis.
Negotiation context
- It's been on market 42 days — a 3% lower offer ($84k) is reasonable based on typical stale-listing flexibility.
- Current owner paid $30k; list at $87k implies a 190% gain — meaningful room to come down on a strong offer.
Risks & watch-outs
- Watch-outs: HOA is 28% of rent.
- Climate carrying-cost: extreme-heat days projected 7→19/yr by 2055 (HVAC capex compounding) — expect insurance premiums to compound above CPI over the hold.
Questions for the listing agent
- What do current leases actually rent for vs. the listed asking? Can we see a recent rent roll and the last 12 months of T-12 income?
- It's been on market 42 days. Have you received any prior offers? Is the seller open to a 5% concession, seller financing, or rate buy-down credit?
- Built in 1970 — when were the roof, HVAC, electrical panel, plumbing, and water heater last replaced?
- What does the HOA fee cover, when was the last increase, and are there any pending special assessments or reserve-fund shortfalls?
- Any open or pending special assessments — roof, HVAC, plumbing, elevator, façade? What's the per-unit balance and payoff schedule, and is the seller paying it off at close or rolling it to the buyer?
- Is there a deadline driving the sale (1031 exchange, divorce, estate, relocation)? That informs how much negotiation room exists.
- Schools are F-rated, which usually means shorter tenancies and higher turnover. Who's the typical renter profile here, and what's been the actual vacancy rate?
- Crime grade is F in this area — have there been break-ins, vandalism, or insurance claims at this property in the last 3 years? What carrier currently insures it and at what premium?
- The area grade is low — what's the realistic commute time and amenity access for the typical tenant pool here? Any planned neighborhood developments (good or bad) we should know about?
- What's the average days-on-market for RENTAL listings here right now (not sales)? A rising rental-DOM trend means longer vacancies and softer asking-rent achievability than the comps imply.
- What's the recent tenant-quality profile in this submarket — average credit score on applications, eviction rate, late-payment / NSF rate, and stable-employment percentage? A property-management company in the area should have these aggregated.
- How much new apartment / multifamily construction is in the pipeline within 1–3 miles? Heavy new supply (>2% of stock underway) typically softens rents 12–24 months out; light construction supports rent growth.
Investment metrics
- 1% rule
- 1.18% ✓
- Cap rate
- 5.97%
- Cash-on-cash
- -1.17%
- DSCR
- 0.95
- GRM
- 7.0
CMA / ARV
No comps found within radius.
Projected returns pro-forma
-3.0% appreciation · 4.27% rent growth · sell at horizon
- IRR
- -16.0%
- Equity multiple
- 0.42×
- Total profit
- $-14,098
- Equity at exit
- $12,957
- IRR
- -4.6%
- Equity multiple
- 0.67×
- Total profit
- $-7,967
- Equity at exit
- $7,514
Cash invested: $24,332 (down + closing). Projections, not guarantees.
Landlord ↔ Tenant lean methodology
- Overall (STATE)
- 83 Strongly Landlord-Friendly
- State Oklahoma
- 83 Strongly Landlord-Friendly · R+20
- County
- — inherits STATE
- City
- — inherits STATE
ZIP-level market 73116
- Rents YoY
- 4.3%
- Active inventory
- 137
- Price-to-rent
- 7.0×
Monthly cashflow live
- Estimated rent
- $1,028 high interval (Pro) →
- Mortgage (P&I)
- −$456
- Tax from tax record
- −$55 /mo · $666/yr
- Insurance
- −$36
- HOA
- −$288
- Vacancy / Maint / Mgmt
- −$216
- Net cashflow
- $-24
Break-even live
UW: 25.0% down · 7.5% · 30yr · 1.5% tax · 5.0% vac · 8.0% maint · 8.0% mgmt
Financing live
Cash to close
- Down payment
- $21,725
- Closing costs
- $2,607
- Reserves months
- —
- Total cash needed
- —
Loan-product check · same deal, 3 products live
Conventional
25% down · 7.5% · 30yr
- Down + closing
- —
- Monthly P&I
- —
- Monthly cashflow
- —
- DSCR
- —
- Eligible?
- —
Personal DTI + credit; lowest rate.
DSCR
20% down · 8.5% · 30yr
- Down + closing
- —
- Monthly P&I
- —
- Monthly cashflow
- —
- DSCR
- —
- Eligible?
- —
No personal income docs; deal must DSCR.
Hard money
10% down · 12.0% · 12mo
- Down + closing
- —
- Monthly P&I
- —
- Monthly cashflow
- —
- DSCR
- —
- Eligible?
- —
Short-term bridge; refi at stabilization.
Rent comps 26 comps
| Address | Beds | Baths | Sqft | Rent | $/sqft | DOM | Units | Dist |
|---|---|---|---|---|---|---|---|---|
| 6300 N Meridian Ave Oklahoma City, OK | 2.0 | 1.0–2.0 | 773 | $778 | $1.01 | 2d | 19 | 0.30mi |
| 6300 N Meridian Ave Unit 6306-201 Oklahoma City, OK | 1.0 | 1.0 | 700 | $700 | $1.00 | 4d | 1 | 0.31mi |
| 6300 N Meridian Ave Unit 6312-102 Oklahoma City, OK | 1.0 | 1.0 | 700 | $700 | $1.00 | 21d | 1 | 0.31mi |
| 6300 N Meridian Ave Unit 6322-204 Oklahoma City, OK | 2.0 | 2.0 | 944 | $860 | $0.91 | 14d | 1 | 0.31mi |
| 6932 Labelle Dr Warr Acres, OK | 1.0 | 2.0 | 1120 | $1,595 | $1.42 | 17d | 1 | 0.54mi |
| 6932 Labelle Dr Warr Acres, OK | 1.0 | 2.0 | 1120 | $1,595 | $1.42 | 23d | 1 | 0.54mi |
| 7036 Labelle Dr Warr Acres, OK | 1.0 | 2.0 | 1120 | $1,595 | $1.42 | 11d | 1 | 0.58mi |
| 5418 N Meridian Ave Oklahoma City, OK | 2.0 | 1.0–2.0 | 690 | $825 | $1.20 | 2d | 14 | 1.01mi |
| 7215 N Macarthur Blvd Unit 4 Warr Acres, OK | 1.0 | 1.0 | 700 | $595 | $0.85 | 3d | 1 | 1.11mi |
| 5304 Willow Cliff Rd Oklahoma City, OK | 1.0 | 1.0 | 800 | $847 | $1.06 | 11d | 1 | 1.19mi |
| 5304 Willow Cliff Rd Oklahoma City, OK | 1.0 | 1.0 | 800 | $847 | $1.06 | 21d | 1 | 1.19mi |
| 5304 Willow Cliff Rd Oklahoma City, OK | 2.0 | 2.0 | 1060 | $1,086 | $1.02 | 4d | 1 | 1.19mi |
| 5304 Willow Cliff Rd Oklahoma City, OK | 1.0 | 1.0 | 800 | $847 | $1.06 | 23d | 1 | 1.19mi |
| 4204 NW 51st St Unit 2 Oklahoma City, OK | 2.0 | 2.0 | 1005 | $1,495 | $1.49 | 23d | 1 | 1.22mi |
| 6103 NW 63rd St Oklahoma City, OK | 1.0 | 1.0 | 696 | $795 | $1.14 | 23d | 1 | 1.28mi |
| 5560 N Portland Ave Oklahoma City, OK | 1.0–2.0 | 1.0–2.0 | 955 | $875 | $0.92 | 1d | 50 | 1.33mi |
| 5577 NW 50th St Oklahoma City, OK | 1.0–2.0 | 1.0–2.0 | 725 | $689 | $0.95 | 3d | 6 | 1.37mi |
| 6054 Northwest Expy Oklahoma City, OK | 2.0 | 1.5 | 1122 | $995 | $0.89 | 23d | 1 | 1.40mi |
| 6056 Northwest Expy Unit 1 Warr Acres, OK | 2.0 | 1.5 | 1122 | $995 | $0.89 | 23d | 1 | 1.40mi |
| 6060 NW Expressway Unit C Oklahoma City, OK | 1.0 | 1.0 | 816 | $795 | $0.97 | 23d | 1 | 1.41mi |
| 6032 NW Expressway Unit D Oklahoma City, OK | 2.0 | 1.5 | 989 | $895 | $0.90 | 23d | 1 | 1.41mi |
| 6024 NW Expressway Unit C Oklahoma City, OK | 1.0 | 1.0 | 816 | $795 | $0.97 | 23d | 1 | 1.41mi |
| 6026 NW Expressway Unit C Oklahoma City, OK | 1.0 | 1.0 | 816 | $795 | $0.97 | 23d | 1 | 1.41mi |
| 6034 NW Expressway Unit B Oklahoma City, OK | 2.0 | 1.5 | 989 | $895 | $0.90 | 2d | 1 | 1.42mi |
| 6066 Northwest Expy Warr Acres, OK | 2.0 | 1.5 | 1122 | $1,145 | $1.02 | 23d | 1 | 1.44mi |
| 3801 NW 51st St Oklahoma City, OK | 2.0 | 1.0 | 818 | $1,100 | $1.34 | 23d | 1 | 1.46mi |
HOA detail condo
- Monthly dues
- $288 · $3,456/yr
- Assessments
- None detected in remarks — confirm with the listing agent.
Listing history 17 events
-
2026-06-18days on market $86,900 Active 42 DOM
-
2026-06-17days on market $86,900 Active 41 DOM
-
2026-06-16days on market $86,900 Active 40 DOM
-
2026-06-15days on market $86,900 Active 39 DOM
-
2026-06-13days on market $86,900 Active 37 DOM
-
2026-06-13days on market $86,900 Active 36 DOM
-
2026-06-09days on market $86,900 Active 33 DOM
-
2026-06-08days on market $86,900 Active 32 DOM
-
2026-06-07days on market $86,900 Active 31 DOM
-
2026-06-03days on market $86,900 Active 27 DOM
-
2026-06-02days on market $86,900 Active 26 DOM
-
2026-06-01days on market $86,900 Active 25 DOM
-
2026-05-31days on market $86,900 Active 24 DOM
-
2026-05-05$89,900 Active
-
2004-04-02soldstatus $30,000
-
2002-06-12soldstatus $25,000
-
1998-02-23soldstatus $20,000
ⓘ Source: listings_history table (triggers on properties + properties_extension) + one-shot
backfill from property_details.listing_events for pre-trigger history.
Tax reassessment forecast OK · Resets to sale price
- Current annual tax
- $666 · $55/mo
- Projected year-2 tax
- $782 · $65/mo
- Expected delta
- +$116/yr (+$10/mo · 17.5%)
ⓘ Screening estimate from a state-policy table — verify with the county assessor before closing.
Climate risk First Street
- Flood 1/10 Low FEMA zone X (unshaded) · 0% chance over 30 yrs
- Wildfire 1/10 Low
- Heat 6/10 Major 7 d/yr ≥106°F today · 19 d/yr by 30 yrs out
- Wind 2/10 Low 2% chance of damaging wind over 30 yrs
- Air quality 2/10 Low 1 unhealthy d/yr today · 2 by 30 yrs out
Nearby sold comps map
Loading sold comps map…
Walkable amenities ~0.75 mi
Loading nearby amenities…
Taxation est. · year 1
- Rental income
- $12,330
- − Mortgage interest
- −$4,868
- − Property taxes
- −$666
- − Insurance
- −$434
- − Repairs & maintenance
- −$986
- − Management
- −$986
- − HOA
- −$3,456
- − Depreciation
- −$2,528
- Taxable loss
- −$1,594
- Est. tax savings @ 24.0%
- +$383
- After-tax cash flow
- $99/yr
For passive investors: Depreciation is non-cash, so a rental often shows a tax loss while cash-flowing — sheltering income. Rental losses are passive: they offset passive income freely, and up to $25,000/yr can offset ordinary (W-2) income if you actively participate and your MAGI is under $100k (phasing out to $0 by $150k); unused losses carry forward. On sale, claimed depreciation is recaptured at up to 25%, and gains may owe capital-gains tax (a 1031 exchange can defer both). Figures are a year-1 estimate at your 24.0% rate — not tax advice; consult a CPA.
Schools (NCES district)
- District
- Putnam City
- NCES district ID
- 4025290
- Math proficiency
- 12% ▼ -18.00%
- Reading proficiency
- 16% ▼ -14.00%
- Median HH income
- $46,657
- Composite
- 12.61/100
- National rank
- #9614
- State rank
- #227 of 270 in OK
Livability — Oklahoma City
- Score
- 80/100
- State rank
- #3
- US rank
- #1635
Category grades
Schools grade is shown separately in the Schools card above.
Census & demographics
- Census place
- Oklahoma City, OK
- County
- Oklahoma County · 771,644 people
- City population
- 498,656
- Metro
- Oklahoma City, OK
- Population (ZIP)
- 10,211
- Household income
- $81,226
- Rent vs Own
- Severe rent burden
- 262.0
Population outlook (Oklahoma County) Hauer SSP2
- Today (2025)
- 911,875 people
- By 2030
- 982,413 · +7.7%
- By 2040
- 1,130,468 · +24.0%
- By 2050
- 1,288,422 · +41.3%
- By 2075
- 1,711,482 · +87.7%
- By 2100
- 2,088,448 · +129.0%
Race, ethnicity, and origin ACS 2023
- Neighborhood character
- Predominantly White (72%)
- Race & ethnicity
- White 72% Two or more races 14% Hispanic / Latino 8% Black 5% Asian 3% Native American 2%
- Hispanic origin (detail)
- Mexican 6%
- Common ancestry
- Italian 3% Slovak 3% Lithuanian 2%
- Foreign-born
- 7% · Canada, South Korea, Philippines
- Languages at home
- 90% English-only · Spanish 6% Other Asian/Pacific 2% Arabic 1%
Political lean MEDSL · Oklahoma
- 2024 margin
- Toss-up / Even · D 48.0% · R 49.7% · Other 2.3%
- 2008→2024 swing
- +15.1pp toward D · 2008: -16.8pp · 2024: -1.7pp
- All cycles
- 2024: R+1.7 2020: R+1.1 2016: R+10.5 2012: R+16.7 2008: R+16.8
Not yet ingested
- Civics
- —
Market trends
- HPI YoY
- ▼ -260.29%
- Current HPI
- 258.0304
- Rent YoY
- ▲ 4.27%
- Metro
- Oklahoma City, OK
- State GDP YoY
- ▲ 1.55%
- F500 in state
- 6
Industry mix (Fortune 500 HQ in OK)
| Industry | F500 HQs | Revenue |
|---|---|---|
| Energy | 3 | $48B |
|
||
Price history
+349.5% since first listed4 events — show timeline
- 2026-05-05 Listed $89,900 MLSOK
- 2004-04-02 Sold (Public Records) $30,000 Public Records
- 2002-06-12 Sold (Public Records) $25,000 Public Records
- 1998-02-23 Sold (Public Records) $20,000 Public Records
Property tax history
+2.8%/yrLatest (2025): $666 · +5.7% YoY. Source: county tax records.
Cash-flow waterfall
monthlySold comps — $/sqft
last 12 mo · ≤1 miLoading sold comps…