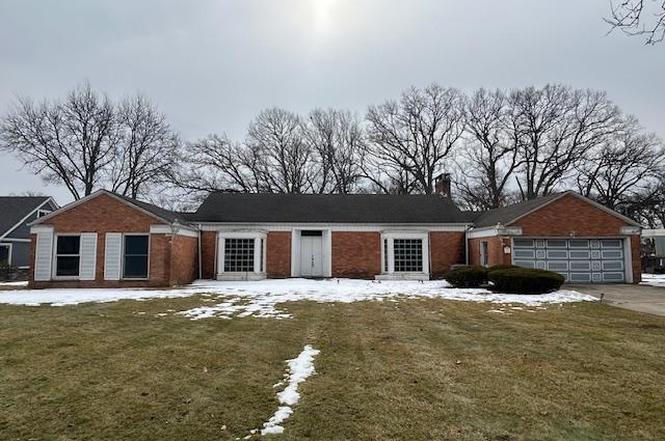
2001 W 64th Pl · Merrillville, IN
Flood risk 1/10 · Minimal
- FEMA flood zone
- X (unshaded)
- Chance of flooding over 30 yrs
- 0.0%
- Est. flood insurance / yr
- $473 – $860
Fire risk 1/10 · Minimal
- Est. fire insurance / yr
- $717 – $1,331
Heat risk 2/10 · Minimal
- Hot days now (above 101°F)
- 7 days/yr
- Hot days in 30 yrs
- 15 days/yr
Wind risk 2/10 · Minimal
- Chance of severe wind over 30 yrs
- 1.0%
Air-quality risk 3/10 · Minor
- Unhealthy air days now
- 2 days/yr
- Unhealthy air days in 30 yrs
- 3 days/yr
Risk factors via First Street. Map © Google.
Why this score? — see what drove the B grade
The composite is a weighted blend of 9 inputs, each scored 0–100. Each bar is that input's sub-score; the figure is the points it added to the 100-point composite (weight × sub-score).
- Cash flow +28.7/30.0
- ARV discount +13.8/15.0
- DSCR +10.0/10.0
- 1% rule +7.1/10.0
- Livability +3.8/5.0
- Rent growth +3.5/5.0
- Schools +2.6/10.0
- Condition / age +2.5/5.0
- Appreciation +0.0/10.0
$299,000
🖨 Deal sheet 📄 Offer letter ✓ Due diligence
Listing remarks MLS
FORE! FORE! FORE! Relax and enjoy the beautiful view of Innsbrook Country Club Golf Course from the privacy of this spacetastic ALL BRICK RANCH nestled on a scenic . 61 acre lot in stately Brookwood Subdivision. THEY DON'T MAKE'M LIKE THIS ANYMORE!! Quality constructed with features not found in this price range of new construction. Double dr front entry to big foyer. Oversized formal living rm with masonary woodburning fireplace and bumped out front windows. Formal dining rm for executive entertaining with fantastic view of golf course. Huge eatin kitchen w/ loads of wood cabinets; builtin dishwasher/electric cooktop/ovens & warmer oven & refrig. Laundry cabinets w/ washer/dryer remaining. TWO MASTER BEDRM SUITES. Take your pick. .golf course view or front view. .each has master full bath and generous closets. Third bedrm has cedar closet and wood parquet flr. Sizeable family rm has masonary gas log fireplace, sliders to glass enclosed sun rm. Most windows replaced & roof 2 yrs
Key facts
- 0.6 acre lot
- 2 garage spots
- Built 1956
Property features AI
Exterior
- Parking: Attached garage; Driveway; 2 garage spaces
- Utilities: Public water and well; Public sewer
- Home design: One-level home; Built in 1956; Property listed as fixer
- Construction: Has basement (unfinished)
- Exterior features: Golf course views; Trees/woods view; Enclosed patio/porch
Interior
- Kitchen: Refrigerator; Eat-in kitchen
- Bedrooms: Primary bedroom; Bedroom 2; Bedroom 3
- Flooring: Carpet; Vinyl; Tile
- Bathrooms: 2 full bathrooms; 1 half bathroom
- Heating & cooling: Forced air heating (natural gas); Central air conditioning
- Interior features: Double vanity; Soaking tub; His and hers closets; Eat-in kitchen; Two fireplaces located in the great room and living room; Unfinished basement
- Laundry & utility: Washer; Dryer; Laundry on main level
Neighborhood map
What this means for you Summary
Snapshot
- This is a 3-bed/2.5-bath single-family listed at $299k.
Deal economics
- At list price, monthly cash flow is $994 ($12k/yr) — positive.
- The deal already cash-flows at list — no discount required.
- Meets the 1% rule at list price ($4k rent vs $299k).
- Recommended offer: $281k (6.0% below list) — sets the bar for market timing.
- Cap rate 10.3% vs local median 4.7% in Merrillville — top-decile yield for the area; either an underpriced asset or a hidden risk that comps aren't pricing in. Stress-test before assuming the spread holds.
Location & tenants
- Location reads 76/100 on livability (#50 in IN, #3,393 nationally) — a middle-class / working-renter tenant base. Strengths: commute A+, cost of living A+, housing A+; Watch: schools D+, amenities F, health & safety D-.
- Merrillville Community School Corporation (suburban): math 22% / reading 36% proficiency, ranked #240 of 301 in IN (top 80%) — low school quality limits family demand, transient renter base, plan for 1-2y turnover.
- Market conditions: Rents rising fast (+4.1%/yr); 264 active listings in the ZIP; 3 comparable units currently listed for rent nearby; rentals lingering (median 44d on market — plan ~5-8 weeks vacancy on turnover, expect pricing pressure); 67% of comp listings sitting > 30 days — soft ceiling on asking rent; 1,642 units permitted in Lake County in 2024 (14 in 5+ unit buildings).
- At $3,633/mo this rent would consume 68% of the median local household income ($64k/yr) (locally 1644% of renters already pay >50% of income on rent) — very limited rent-growth headroom before tenants either downsize or default.
Forward outlook
- Local home prices are declining (-3.0%/yr); year-one equity from $2k of loan paydown is wiped out by about $9k of value loss. Plan a longer hold.
- Lake County population projected to shrink 7% by 2050 — rents likely to lag national; underwrite the cash flow, not the appreciation.
- At projected returns (-3.0% appreciation + 4.1% rent growth), your $84k cash investment doubles in ~8 years — after that, you're playing with house money.
Negotiation context
- It's been on market 79 days — a 6% lower offer ($281k) is reasonable based on typical stale-listing flexibility.
- 2 sale attempts since 22y ago with the ask held roughly flat each time — persistent listings suggest the price (not the market) is what's stuck; bring a comps-based counter.
Risks & watch-outs
- Watch-outs: built in 1956 — expect roof / HVAC / electrical / plumbing capex.
Questions for the listing agent
- It's been on market 79 days. Have you received any prior offers? Is the seller open to a 6% concession, seller financing, or rate buy-down credit?
- Built in 1956 — when were the roof, HVAC, electrical panel, plumbing, and water heater last replaced?
- Why hasn't it sold? Are there any deal-killer items the seller is aware of (foundation, flood, title, zoning, code violations)?
- Is there a deadline driving the sale (1031 exchange, divorce, estate, relocation)? That informs how much negotiation room exists.
- Schools are D-rated, which usually means shorter tenancies and higher turnover. Who's the typical renter profile here, and what's been the actual vacancy rate?
- What's the average days-on-market for RENTAL listings here right now (not sales)? A rising rental-DOM trend means longer vacancies and softer asking-rent achievability than the comps imply.
- What's the recent tenant-quality profile in this submarket — average credit score on applications, eviction rate, late-payment / NSF rate, and stable-employment percentage? A property-management company in the area should have these aggregated.
- How much new for-sale + rental construction is in the pipeline within 1–3 miles? Heavy new supply typically softens prices + rents 12–24 months out; constrained supply supports both.
Investment metrics
- 1% rule
- 1.21% ✓
- Cap rate
- 10.28%
- Cash-on-cash
- 14.24%
- DSCR
- 1.63
- GRM
- 6.9
CMA / ARV
- ARV (on-the-fly)
- $347,475
- Comps found
- 12
Show comp detail 12 sales within ~0.75 mi
| Address | Dist | Beds/Ba | Sqft | Sold | Price | $/sf | Match |
|---|---|---|---|---|---|---|---|
| 2001 W 64th Pl | 0.00mi | 3/2.5 | 3,161 (+12%) | 0mo | $306,500 | $97 | 80 |
| 6420 Arthur St | 0.06mi | 3/2.5 | 2,574 (-9%) | 10mo | $340,000 | $132 | 73 |
| 1655 W 63rd Ave | 0.31mi | 4/3.0 (+1) | 3,069 (+9%) | 4mo | $347,000 | $113 | 61 |
| 2595 W 65th Ave | 0.45mi | 4/2.5 (+1) | 2,524 (-11%) | 3mo | $349,000 | $138 | 54 |
| 2607 W 60th Dr | 0.68mi | 3/2.5 | 2,664 (-6%) | 11mo | $191,500 | $72 | 49 |
| 5950 Hayes Pl | 0.63mi | 3/1.0 | 2,538 (-10%) | 2mo | $240,000 | $95 | 46 |
| 941 W 66th Ave | 0.63mi | 4/2.5 (+1) | 2,970 (+5%) | 16mo | $312,900 | $105 | 44 |
| 2895 W 65th Ave | 0.71mi | 4/2.5 (+1) | 2,750 (-3%) | 17mo | $370,000 | $135 | 43 |
| 1790 W 60th Pl | 0.59mi | 4/2.0 (+1) | 2,624 (-7%) | 14mo | $289,900 | $110 | 42 |
| 1941 W 60th Pl | 0.54mi | 4/2.5 (+1) | 2,464 (-13%) | 11mo | $302,900 | $123 | 39 |
| 6374 Marshall Ct | 0.62mi | 3/2.0 | 2,452 (-13%) | 9mo | $337,500 | $138 | 39 |
| 1830 W 60th Pl | 0.58mi | 4/2.0 (+1) | 2,492 (-12%) | 9mo | $314,000 | $126 | 38 |
Match score weights: distance 35% · size 25% · config 20% · recency 20%. Top-matched comps best support the ARV.
Projected returns pro-forma
-3.0% appreciation · 4.1% rent growth · sell at horizon
- IRR
- 5.7%
- Equity multiple
- 1.23×
- Total profit
- $18,846
- Equity at exit
- $44,582
- IRR
- 16.0%
- Equity multiple
- 2.37×
- Total profit
- $114,717
- Equity at exit
- $25,852
Cash invested: $83,720 (down + closing). Projections, not guarantees.
Landlord ↔ Tenant lean methodology
- Overall (STATE)
- 90 Strongly Landlord-Friendly
- State Indiana
- 90 Strongly Landlord-Friendly · R+11
- County
- — inherits STATE
- City
- — inherits STATE
ZIP-level market 46410
- Rents YoY
- 4.1%
- Active inventory
- 264
- Price-to-rent
- 6.9×
Monthly cashflow live
- Estimated rent
- $3,633 medium interval (Pro) →
- Mortgage (P&I)
- −$1,568
- Tax from tax record
- −$184 /mo · $2,202/yr
- Insurance
- −$125
- HOA
- −$0
- Vacancy / Maint / Mgmt
- −$763
- Net cashflow
- $994
Break-even live
UW: 25.0% down · 7.5% · 30yr · 1.5% tax · 5.0% vac · 8.0% maint · 8.0% mgmt
Financing live
Cash to close
- Down payment
- $74,750
- Closing costs
- $8,970
- Reserves months
- —
- Total cash needed
- —
Loan-product check · same deal, 3 products live
Conventional
25% down · 7.5% · 30yr
- Down + closing
- —
- Monthly P&I
- —
- Monthly cashflow
- —
- DSCR
- —
- Eligible?
- —
Personal DTI + credit; lowest rate.
DSCR
20% down · 8.5% · 30yr
- Down + closing
- —
- Monthly P&I
- —
- Monthly cashflow
- —
- DSCR
- —
- Eligible?
- —
No personal income docs; deal must DSCR.
Hard money
10% down · 12.0% · 12mo
- Down + closing
- —
- Monthly P&I
- —
- Monthly cashflow
- —
- DSCR
- —
- Eligible?
- —
Short-term bridge; refi at stabilization.
Rent comps 3 comps
| Address | Beds | Baths | Sqft | Rent | $/sqft | DOM | Units | Dist |
|---|---|---|---|---|---|---|---|---|
| 1865 W 64th Pl Merrillville, IN | 4.0 | 2.0 | 2034 | $4,900 | $2.41 | 43d | 1 | 0.05mi |
| 6092 Cleveland St Merrillville, IN | 3.0 | 2.5 | 3136 | $3,000 | $0.96 | 43d | 1 | 0.53mi |
| 3023 W 63rd Ln Merrillville, IN | 4.0 | 3.0 | 2500 | $2,800 | $1.12 | 3d | 1 | 0.81mi |
Listing history 3 events
-
2026-05-01status Pending
-
2026-02-11$299,000 Active
-
2004-01-15$199,900 1019-char remark
Show marketing remark (1019 chars)
FORE! FORE! FORE! Relax and enjoy the beautiful view of Innsbrook Country Club Golf Course from the privacy of this spacetastic ALL BRICK RANCH nestled on a scenic . 61 acre lot in stately Brookwood Subdivision. THEY DON'T MAKE'M LIKE THIS ANYMORE!! Quality constructed with features not found in this price range of new construction. Double dr front entry to big foyer. Oversized formal living rm with masonary woodburning fireplace and bumped out front windows. Formal dining rm for executive entertaining with fantastic view of golf course. Huge eatin kitchen w/ loads of wood cabinets; builtin dishwasher/electric cooktop/ovens & warmer oven & refrig. Laundry cabinets w/ washer/dryer remaining. TWO MASTER BEDRM SUITES. Take your pick. .golf course view or front view. .each has master full bath and generous closets. Third bedrm has cedar closet and wood parquet flr. Sizeable family rm has masonary gas log fireplace, sliders to glass enclosed sun rm. Most windows replaced & roof 2 yrs
ⓘ Source: listings_history table (triggers on properties + properties_extension) + one-shot
backfill from property_details.listing_events for pre-trigger history.
Tax reassessment forecast IN · Partial reset (capped growth)
- Current annual tax
- $2,202 · $184/mo
- Projected year-2 tax
- $2,372 · $198/mo
- Expected delta
- +$170/yr (+$14/mo · 7.7%)
ⓘ Screening estimate from a state-policy table — verify with the county assessor before closing.
Climate risk First Street
- Flood 1/10 Low FEMA zone X (unshaded) · 0% chance over 30 yrs
- Wildfire 1/10 Low
- Heat 2/10 Low 7 d/yr ≥101°F today · 15 d/yr by 30 yrs out
- Wind 2/10 Low 100% chance of damaging wind over 30 yrs
- Air quality 3/10 Moderate 2 unhealthy d/yr today · 3 by 30 yrs out
Nearby sold comps map
Loading sold comps map…
Walkable amenities ~0.75 mi
Loading nearby amenities…
Taxation est. · year 1
- Rental income
- $43,593
- − Mortgage interest
- −$16,749
- − Property taxes
- −$2,202
- − Insurance
- −$1,495
- − Repairs & maintenance
- −$3,487
- − Management
- −$3,487
- − Depreciation
- −$8,698
- Taxable income
- $7,474
- Est. tax owed @ 24.0%
- −$1,794
- After-tax cash flow
- $10,132/yr
For passive investors: Depreciation is non-cash, so a rental often shows a tax loss while cash-flowing — sheltering income. Rental losses are passive: they offset passive income freely, and up to $25,000/yr can offset ordinary (W-2) income if you actively participate and your MAGI is under $100k (phasing out to $0 by $150k); unused losses carry forward. On sale, claimed depreciation is recaptured at up to 25%, and gains may owe capital-gains tax (a 1031 exchange can defer both). Figures are a year-1 estimate at your 24.0% rate — not tax advice; consult a CPA.
Schools (NCES district)
- District
- Merrillville Community School Corporation
- NCES district ID
- 1809690
- Math proficiency
- 22% ▼ -17.00%
- Reading proficiency
- 36% ▼ -8.00%
- Median HH income
- $54,401
- Composite
- 25.74/100
- National rank
- #7375
- State rank
- #240 of 301 in IN
Livability — Merrillville
- Score
- 76/100
- State rank
- #50
- US rank
- #3393
Category grades
Schools grade is shown separately in the Schools card above.
Census & demographics
- Census place
- Merrillville, IN
- County
- Lake County · 422,878 people
- City population
- 39,243
- Metro
- Chicago-Naperville-Elgin, IL-IN-WI
- Population (ZIP)
- 39,243
- Household income
- $64,127
- Rent vs Own
- Severe rent burden
- 1644.0
Population outlook (Lake County) Hauer SSP2
- Today (2025)
- 484,026 people
- By 2030
- 478,091 · -1.2%
- By 2040
- 462,974 · -4.3%
- By 2050
- 449,894 · -7.1%
- By 2075
- 436,169 · -9.9%
- By 2100
- 426,607 · -11.9%
Race, ethnicity, and origin ACS 2023
- Neighborhood character
- Diverse neighborhood (Simpson 0.66)
- Race & ethnicity
- Black 46% White 32% Hispanic / Latino 16% Two or more races 9% Asian 2%
- Hispanic origin (detail)
- Mexican 11% Puerto Rican 3%
- Common ancestry
- Romanian 4% Iranian 2% Italian 1%
- Foreign-born
- 7% · Canada
- Languages at home
- 88% English-only · Spanish 7% Other Indo-European 2%
Political lean MEDSL · Lake
- 2024 margin
- Lean D (+5.6) · D 52.1% · R 46.5% · Other 1.5%
- 2008→2024 swing
- -28.6pp toward R · 2008: 34.3pp · 2024: 5.6pp
- All cycles
- 2024: D+5.6 2020: D+15.1 2016: D+20.6 2012: D+31.0 2008: D+34.3
Not yet ingested
- Civics
- —
Market trends
- HPI YoY
- ▼ -180.11%
- Current HPI
- 240.8833
- Rent YoY
- ▲ 4.10%
- Metro
- Chicago-Naperville-Elgin, IL-IN-WI
- State GDP YoY
- ▲ 2.90%
- F500 in state
- 18
Industry mix (Fortune 500 HQ in IN)
| Industry | F500 HQs | Revenue |
|---|---|---|
| Industrial Machinery | 2 | $37B |
|
||
| Healthcare | 1 | $177B |
|
||
| Pharmaceuticals | 1 | $45B |
|
||
| Metals / Steel | 1 | $18B |
|
||
| Agriculture | 1 | $17B |
|
||
| Packaging | 1 | $12B |
|
||
Price history
+49.6% since first listed3 events — show timeline
- 2026-05-01 Pending — NIRA MLS as Distributed by MLS Grid
- 2026-02-11 Listed $299,000 NIRA MLS as Distributed by MLS Grid
- 2004-01-15 Listed $199,900 NIRA MLS as Distributed by MLS Grid
Property tax history
+0.8%/yrLatest (2024): $2,202 · +6.2% YoY. Source: county tax records.
Cash-flow waterfall
monthlySold comps — $/sqft
last 12 mo · ≤1 miLoading sold comps…