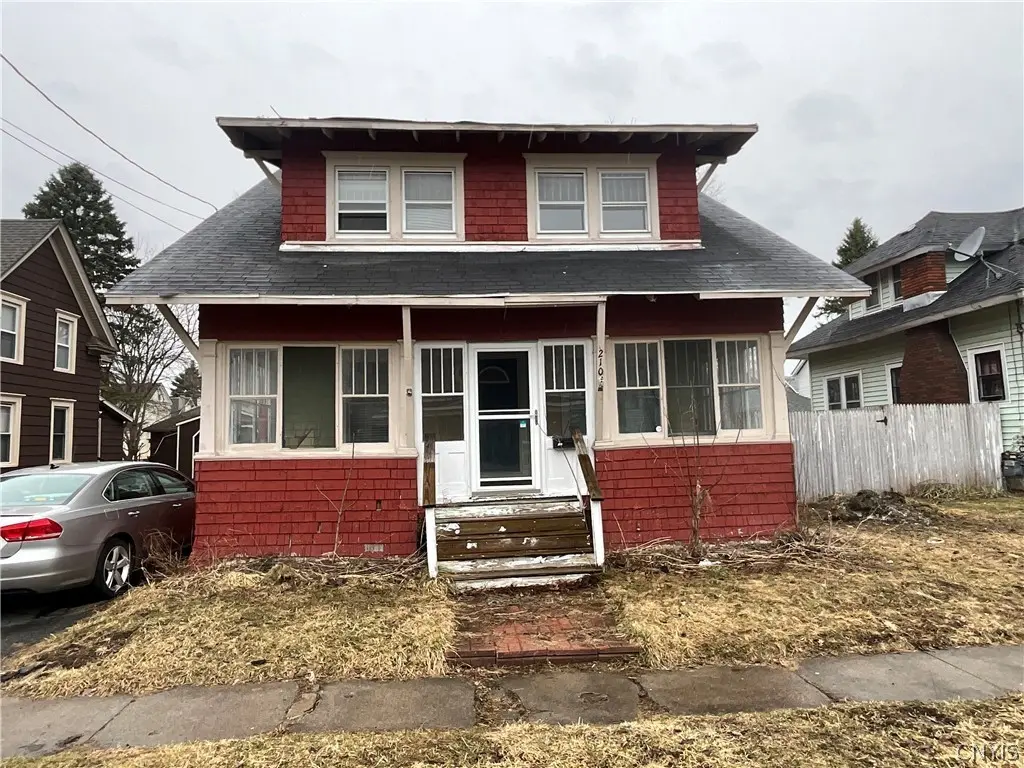
210 S Rutland St · Watertown, NY
Flood risk 6/10 · Moderate
- FEMA flood zone
- X
- Chance of flooding over 30 yrs
- 0.68%
- Est. flood insurance / yr
- $473 – $860
Fire risk 1/10 · Minimal
- Est. fire insurance / yr
- $691 – $1,283
Heat risk 2/10 · Minimal
- Hot days now (above 91°F)
- 7 days/yr
- Hot days in 30 yrs
- 16 days/yr
Wind risk 1/10 · Minimal
- Chance of severe wind over 30 yrs
- —
Air-quality risk 2/10 · Minimal
- Unhealthy air days now
- 1 days/yr
- Unhealthy air days in 30 yrs
- 1 days/yr
Risk factors via First Street. Map © Google.
Why this score? — see what drove the C grade
The composite is a weighted blend of 9 inputs, each scored 0–100. Each bar is that input's sub-score; the figure is the points it added to the 100-point composite (weight × sub-score).
- Cash flow +19.0/30.0
- ARV discount +12.5/15.0
- DSCR +6.0/10.0
- 1% rule +5.1/10.0
- Rent growth +5.0/5.0
- Schools +3.7/10.0
- Livability +3.4/5.0
- Condition / age +2.5/5.0
- Appreciation +0.0/10.0
$139,000
🖨 Deal sheet 📄 Offer letter ✓ Due diligence
Listing remarks MLS
Opportunity awaits in this 3-bedroom, 1.5-bath two-story home in Watertown! Offering a functional layout with spacious living areas and great potential, this property is ideal for investors or buyers looking to put their personal touch on a home. Conveniently located near local amenities, shopping, and Fort Drum. Being sold as-is—bring your vision and make it your own!
Key facts
- 2,970 sq ft lot
- Garage
- Built 1920
Neighborhood map
What this means for you Summary
Snapshot
- This is a 3-bed/1.5-bath single-family listed at $139k.
Deal economics
- At list price, monthly cash flow is $145 ($2k/yr) — positive.
- The deal already cash-flows at list — no discount required.
- Meets the 1% rule at list price ($1k rent vs $139k).
- Recommended offer: $131k (6.0% below list) — sets the bar for market timing.
- Cap rate 7.5% vs local median 6.2% in Watertown — meaningfully above typical; check what's discounted (condition, days-on-market, listing class) to confirm the premium yield is real.
Location & tenants
- Location reads 68/100 on livability (#540 in NY) — a middle-class / working-renter tenant base. Strengths: health & safety A+, cost of living A-, housing A-; Watch: amenities C-, schools D, crime F.
- Watertown City School District (urban): math 34% / reading 54% proficiency, ranked #481 of 590 in NY (top 82%) — families likely to look elsewhere, expect single-tenant / working-renter base with shorter leases.
- Market conditions: Rents rising fast (+10.0%/yr); 223 active listings in the ZIP; 14 comparable units currently listed for rent nearby; rentals lingering (median 44d on market — plan ~5-8 weeks vacancy on turnover, expect pricing pressure); 100% of comp listings sitting > 30 days — soft ceiling on asking rent; 196 units permitted in Jefferson County in 2024 (0 in 5+ unit buildings).
Forward outlook
- Local home prices are declining (-3.0%/yr); year-one equity from $961 of loan paydown is wiped out by about $4k of value loss. Plan a longer hold.
- Jefferson County population projected at -12% by 2050 — secular population decline; favor cash flow + early exit over multi-decade hold.
- At projected returns (-3.0% appreciation + 8.0% rent growth), your $39k cash investment doubles in ~10 years — after that, you're playing with house money.
Negotiation context
- It's been on market 85 days — a 6% lower offer ($131k) is reasonable based on typical stale-listing flexibility.
- 4 sale attempts since 19y ago with the ask held roughly flat each time — persistent listings suggest the price (not the market) is what's stuck; bring a comps-based counter.
Risks & watch-outs
- Watch-outs: built in 1920 — expect roof / HVAC / electrical / plumbing capex.
- Climate carrying-cost: major flood risk — expect insurance premiums to compound above CPI over the hold.
Questions for the listing agent
- It's been on market 85 days. Have you received any prior offers? Is the seller open to a 6% concession, seller financing, or rate buy-down credit?
- Built in 1920 — when were the roof, HVAC, electrical panel, plumbing, and water heater last replaced?
- Why hasn't it sold? Are there any deal-killer items the seller is aware of (foundation, flood, title, zoning, code violations)?
- Is there a deadline driving the sale (1031 exchange, divorce, estate, relocation)? That informs how much negotiation room exists.
- Schools are D-rated, which usually means shorter tenancies and higher turnover. Who's the typical renter profile here, and what's been the actual vacancy rate?
- Crime grade is F in this area — have there been break-ins, vandalism, or insurance claims at this property in the last 3 years? What carrier currently insures it and at what premium?
- What's the average days-on-market for RENTAL listings here right now (not sales)? A rising rental-DOM trend means longer vacancies and softer asking-rent achievability than the comps imply.
- What's the recent tenant-quality profile in this submarket — average credit score on applications, eviction rate, late-payment / NSF rate, and stable-employment percentage? A property-management company in the area should have these aggregated.
- How much new for-sale + rental construction is in the pipeline within 1–3 miles? Heavy new supply typically softens prices + rents 12–24 months out; constrained supply supports both.
Investment metrics
- 1% rule
- 1.01% ✓
- Cap rate
- 7.54%
- Cash-on-cash
- 4.46%
- DSCR
- 1.20
- GRM
- 8.3
CMA / ARV
- ARV (median comp)
- $156,567
- List price
- $139,000
- Delta
- -11.22%
- Verdict
- UNDERPRICED
- Comps
- 20 within 1.0 mi
Show comp detail 12 sales within ~0.75 mi
| Address | Dist | Beds/Ba | Sqft | Sold | Price | $/sf | Match |
|---|---|---|---|---|---|---|---|
| 443 Flower Ave E | 0.10mi | 3/1.0 | 1,270 (+8%) | 7mo | $210,000 | $165 | 75 |
| 1 Academy Pl | 0.36mi | 3/1.5 | 1,244 (+5%) | 2mo | $85,000 | $68 | 73 |
| 607 S Hamilton St | 0.41mi | 3/1.5 | 1,142 (-3%) | 4mo | $179,900 | $158 | 72 |
| 1105 Salina St | 0.32mi | 3/1.5 | 1,248 (+6%) | 6mo | $220,681 | $177 | 70 |
| 603 Emerson St | 0.31mi | 3/1.0 | 1,100 (-7%) | 8mo | $128,000 | $116 | 66 |
| 405 Brainard St | 0.29mi | 3/1.0 | 1,308 (+11%) | 4mo | $146,000 | $112 | 64 |
| 415 Thompson Blvd | 0.46mi | 3/1.0 | 1,240 (+5%) | 6mo | $185,000 | $149 | 64 |
| 236 Colorado Ave | 0.64mi | 3/1.0 | 1,252 (+6%) | 2mo | $210,000 | $168 | 57 |
| 384 Broadway Ave W | 0.37mi | 3/1.5 | 1,339 (+13%) | 6mo | $235,000 | $176 | 55 |
| 643 S Hamilton St | 0.48mi | 3/1.0 | 1,335 (+13%) | 1mo | $261,700 | $196 | 53 |
| 1214 Academy St | 0.47mi | 3/1.0 | 1,344 (+14%) | 6mo | $261,000 | $194 | 48 |
| 127 Wyoming Ave | 0.61mi | 3/1.0 | 1,344 (+14%) | 6mo | $150,000 | $112 | 42 |
Match score weights: distance 35% · size 25% · config 20% · recency 20%. Top-matched comps best support the ARV.
Projected returns pro-forma
-3.0% appreciation · 8.0% rent growth · sell at horizon
- IRR
- -3.8%
- Equity multiple
- 0.85×
- Total profit
- $-5,882
- Equity at exit
- $20,725
- IRR
- 10.9%
- Equity multiple
- 2.04×
- Total profit
- $40,535
- Equity at exit
- $12,018
Cash invested: $38,920 (down + closing). Projections, not guarantees.
Landlord ↔ Tenant lean methodology
- Overall (STATE)
- 15 Strongly Tenant-Friendly
- State New York
- 15 Strongly Tenant-Friendly · D+10
- County
- — inherits STATE
- City
- — inherits STATE
ZIP-level market 13601
- Home prices YoY
- -5.6%
- Rents YoY
- 10.0%
- Active inventory
- 223
- Price-to-rent
- 8.3×
Monthly cashflow live
- Estimated rent
- $1,401 high interval (Pro) →
- Mortgage (P&I)
- −$729
- Tax from tax record
- −$175 /mo · $2,104/yr
- Insurance
- −$58
- HOA
- −$0
- Vacancy / Maint / Mgmt
- −$294
- Net cashflow
- $145
Break-even live
UW: 25.0% down · 7.5% · 30yr · 1.5% tax · 5.0% vac · 8.0% maint · 8.0% mgmt
Financing live
Cash to close
- Down payment
- $34,750
- Closing costs
- $4,170
- Reserves months
- —
- Total cash needed
- —
Loan-product check · same deal, 3 products live
Conventional
25% down · 7.5% · 30yr
- Down + closing
- —
- Monthly P&I
- —
- Monthly cashflow
- —
- DSCR
- —
- Eligible?
- —
Personal DTI + credit; lowest rate.
DSCR
20% down · 8.5% · 30yr
- Down + closing
- —
- Monthly P&I
- —
- Monthly cashflow
- —
- DSCR
- —
- Eligible?
- —
No personal income docs; deal must DSCR.
Hard money
10% down · 12.0% · 12mo
- Down + closing
- —
- Monthly P&I
- —
- Monthly cashflow
- —
- DSCR
- —
- Eligible?
- —
Short-term bridge; refi at stabilization.
Rent comps 14 comps
| Address | Beds | Baths | Sqft | Rent | $/sqft | DOM | Units | Dist |
|---|---|---|---|---|---|---|---|---|
| 816 Boyd St Unit 1 Watertown, NY | 2.0 | 1.0 | 980 | $1,500 | $1.53 | 43d | 1 | 0.05mi |
| 911 State St Unit 3 Watertown, NY | 3.0 | 1.0 | 1200 | $995 | $0.83 | 43d | 1 | 0.18mi |
| 927 State St Watertown, NY | 2.0 | 1.0 | 900 | $1,000 | $1.11 | 43d | 1 | 0.19mi |
| 123 State Pl Watertown, NY | 3.0 | 1.5 | 1500 | $1,750 | $1.17 | 43d | 1 | 0.23mi |
| 720 Cadwell St Watertown, NY | 2.0 | 1.5 | 1300 | $995 | $0.77 | 43d | 1 | 0.29mi |
| 1029 Gill St Watertown, NY | 3.0 | 1.0 | 1275 | $1,950 | $1.53 | 43d | 1 | 0.41mi |
| 328 Clay St Unit 3 Watertown, NY | 3.0 | 2.0 | 1500 | $1,650 | $1.10 | 43d | 1 | 0.43mi |
| 311 High St Watertown, NY | 2.0 | 1.0 | 851 | $1,200 | $1.41 | 43d | 1 | 0.46mi |
| 256 Michigan Ave Watertown, NY | 2.0–4.0 | 1.0–2.5 | 1435 | $1,440 | $1.00 | 43d | 9 | 0.74mi |
| 159 Mullin St Unit 2 Watertown, NY | 2.0 | 1.0 | 900 | $1,200 | $1.33 | 43d | 1 | 0.77mi |
| 109 Spring Ave Watertown, NY | 2.0 | 1.0 | 1344 | $1,200 | $0.89 | 43d | 1 | 0.84mi |
| 611 Cooper St Watertown, NY | 3.0 | 1.0 | 1190 | $1,495 | $1.26 | 43d | 1 | 0.92mi |
| 1815 Olmstead Dr Watertown, NY | 2.0–4.0 | 1.0–2.0 | 1380 | $1,462 | $1.06 | 43d | 6 | 1.14mi |
| 136 N Meadow St Unit A Watertown, NY | 2.0 | 1.0 | 1000 | $995 | $0.99 | 43d | 1 | 1.15mi |
Listing history 26 events
-
2026-06-19days on market $139,000 Active 85 DOM
-
2026-06-18days on market $139,000 Active 84 DOM
-
2026-06-17days on market $139,000 Active 83 DOM
-
2026-06-16days on market $139,000 Active 82 DOM
-
2026-06-15days on market $139,000 Active 81 DOM
-
2026-06-14days on market $139,000 Active 79 DOM
-
2026-06-12days on market $139,000 Active 78 DOM
-
2026-06-09days on market $139,000 Active 75 DOM
-
2026-06-08days on market $139,000 Active 74 DOM
-
2026-06-07days on market $139,000 Active 73 DOM
-
2026-06-05days on market $139,000 Active 70 DOM
-
2026-06-03days on market $139,000 Active 69 DOM
-
2026-06-02days on market $139,000 Active 68 DOM
-
2026-06-01days on market $139,000 Active 67 DOM
-
2026-05-31days on market $139,000 Active 66 DOM
-
2026-05-30days on market $139,000 Active 65 DOM
-
2026-03-26$139,000 Active 377-char remark
Show marketing remark (377 chars)
Opportunity awaits in this 3-bedroom, 1.5-bath two-story home in Watertown! Offering a functional layout with spacious living areas and great potential, this property is ideal for investors or buyers looking to put their personal touch on a home. Conveniently located near local amenities, shopping, and Fort Drum. Being sold as-is—bring your vision and make it your own!
-
2020-12-21soldstatus $134,000
-
2020-12-17soldstatus $134,000 470-char remark
Show marketing remark (470 chars)
Wow! This is a remodeled home that needs nothing. The home boasts hard wood floors throughout. Walk into your kitchen with butcher block counter tops and all appliances. Then walk into your living room, dining room open concept space with plenty of space. You also have your own garage and a nice shed with a totally fenced in yard. Walk upstairs to 3 bedrooms and full sized bath - and you have it all. Oh, did I mention a great 3 season porch! This one will not last!
-
2020-08-11$134,000 470-char remark
Show marketing remark (470 chars)
Wow! This is a remodeled home that needs nothing. The home boasts hard wood floors throughout. Walk into your kitchen with butcher block counter tops and all appliances. Then walk into your living room, dining room open concept space with plenty of space. You also have your own garage and a nice shed with a totally fenced in yard. Walk upstairs to 3 bedrooms and full sized bath - and you have it all. Oh, did I mention a great 3 season porch! This one will not last!
-
2015-10-26soldstatus $125,000
-
2014-07-31$124,900
-
2007-05-14soldstatus $121,370
-
2007-05-14soldstatus $121,370
-
2007-03-24$115,000
-
2004-12-08soldstatus $88,800
ⓘ Source: listings_history table (triggers on properties + properties_extension) + one-shot
backfill from property_details.listing_events for pre-trigger history.
Tax reassessment forecast NY · Partial reset (capped growth)
- Current annual tax
- $2,104 · $175/mo
- Projected year-2 tax
- $2,227 · $186/mo
- Expected delta
- +$123/yr (+$10/mo · 5.8%)
ⓘ Screening estimate from a state-policy table — verify with the county assessor before closing.
Climate risk First Street
- Flood 6/10 Major FEMA zone X · 68% chance over 30 yrs
- Wildfire 1/10 Low
- Heat 2/10 Low 7 d/yr ≥91°F today · 16 d/yr by 30 yrs out
- Wind 1/10 Low
- Air quality 2/10 Low 1 unhealthy d/yr today · 1 by 30 yrs out
Nearby sold comps map
Loading sold comps map…
Walkable amenities ~0.75 mi
Loading nearby amenities…
Taxation est. · year 1
- Rental income
- $16,813
- − Mortgage interest
- −$7,786
- − Property taxes
- −$2,104
- − Insurance
- −$695
- − Repairs & maintenance
- −$1,345
- − Management
- −$1,345
- − Depreciation
- −$4,044
- Taxable loss
- −$506
- Est. tax savings @ 24.0%
- +$121
- After-tax cash flow
- $1,858/yr
For passive investors: Depreciation is non-cash, so a rental often shows a tax loss while cash-flowing — sheltering income. Rental losses are passive: they offset passive income freely, and up to $25,000/yr can offset ordinary (W-2) income if you actively participate and your MAGI is under $100k (phasing out to $0 by $150k); unused losses carry forward. On sale, claimed depreciation is recaptured at up to 25%, and gains may owe capital-gains tax (a 1031 exchange can defer both). Figures are a year-1 estimate at your 24.0% rate — not tax advice; consult a CPA.
Schools (NCES district)
- District
- Watertown City School District
- NCES district ID
- 3630120
- Math proficiency
- 34% ▼ -10.00%
- Reading proficiency
- 54% ▲ 12.00%
- Median HH income
- $40,919
- Composite
- 36.86/100
- National rank
- #4551
- State rank
- #481 of 590 in NY
Livability — Watertown
- Score
- 68/100
- State rank
- #540
- US rank
- #9700
Category grades
Schools grade is shown separately in the Schools card above.
Census & demographics
- Census place
- Watertown, NY
- County
- Jefferson County · 47,417 people
- City population
- 36,839
- Metro
- Watertown-Fort Drum, NY
- Population (ZIP)
- 36,839
- Household income
- $58,791
- Rent vs Own
- Severe rent burden
- 1634.0
Population outlook (Jefferson County) Hauer SSP2
- Today (2025)
- 111,748 people
- By 2030
- 109,370 · -2.1%
- By 2040
- 103,828 · -7.1%
- By 2050
- 98,523 · -11.8%
- By 2075
- 91,422 · -18.2%
- By 2100
- 78,214 · -30.0%
Race, ethnicity, and origin ACS 2023
- Neighborhood character
- Predominantly White (82%)
- Race & ethnicity
- White 82% Two or more races 7% Hispanic / Latino 6% Black 4% Asian 2%
- Hispanic origin (detail)
- Mexican 2% Puerto Rican 2%
- Common ancestry
- Lithuanian 7% Romanian 3% Slovak 2%
- Foreign-born
- 4% · Canada
- Languages at home
- 94% English-only · Spanish 3% Other Indo-European 1% German/W. Germanic 1%
Political lean MEDSL · Jefferson
- 2024 margin
- Strong R (+23.6) · D 38.2% · R 61.8%
- 2008→2024 swing
- -18.3pp toward R · 2008: -5.3pp · 2024: -23.6pp
- All cycles
- 2024: R+23.6 2020: R+19.0 2016: R+22.4 2012: R+2.9 2008: R+5.3
Not yet ingested
- Civics
- —
Market trends
- HPI YoY
- ▼ -18.86%
- Current HPI
- 316.636
- Rent YoY
- ▲ 9.96%
- Metro
- Watertown-Fort Drum, NY
- State GDP YoY
- ▲ 2.60%
- F500 in state
- 92
Industry mix (Fortune 500 HQ in NY)
| Industry | F500 HQs | Revenue |
|---|---|---|
| Financial Services | 10 | $950B |
|
||
| Consumer Goods | 9 | $162B |
|
||
| Insurance | 4 | $225B |
|
||
| Telecommunications | 2 | $144B |
|
||
| Pharmaceuticals | 2 | $112B |
|
||
| Media / Entertainment | 2 | $69B |
|
||
Price history
+56.5% since first listed10 events — show timeline
- 2026-03-26 Listed $139,000 CNYIS
- 2020-12-21 Sold (Public Records) $134,000 Public Records
- 2020-12-17 Sold (MLS) $134,000 CNYIS
- 2020-08-11 Listed $134,000 CNYIS
- 2015-10-26 Sold (MLS) $125,000 CNYIS
- 2014-07-31 Listed $124,900 CNYIS
- 2007-05-14 Sold (Public Records) $121,370 Public Records
- 2007-05-14 Sold (MLS) $121,370 CNYIS
- 2007-03-24 Listed $115,000 CNYIS
- 2004-12-08 Sold (Public Records) $88,800 Public Records
Property tax history
+27.2%/yrLatest (2025): $2,104 · +2.0% YoY. Source: county tax records.
Cash-flow waterfall
monthlySold comps — $/sqft
last 12 mo · ≤1 miLoading sold comps…