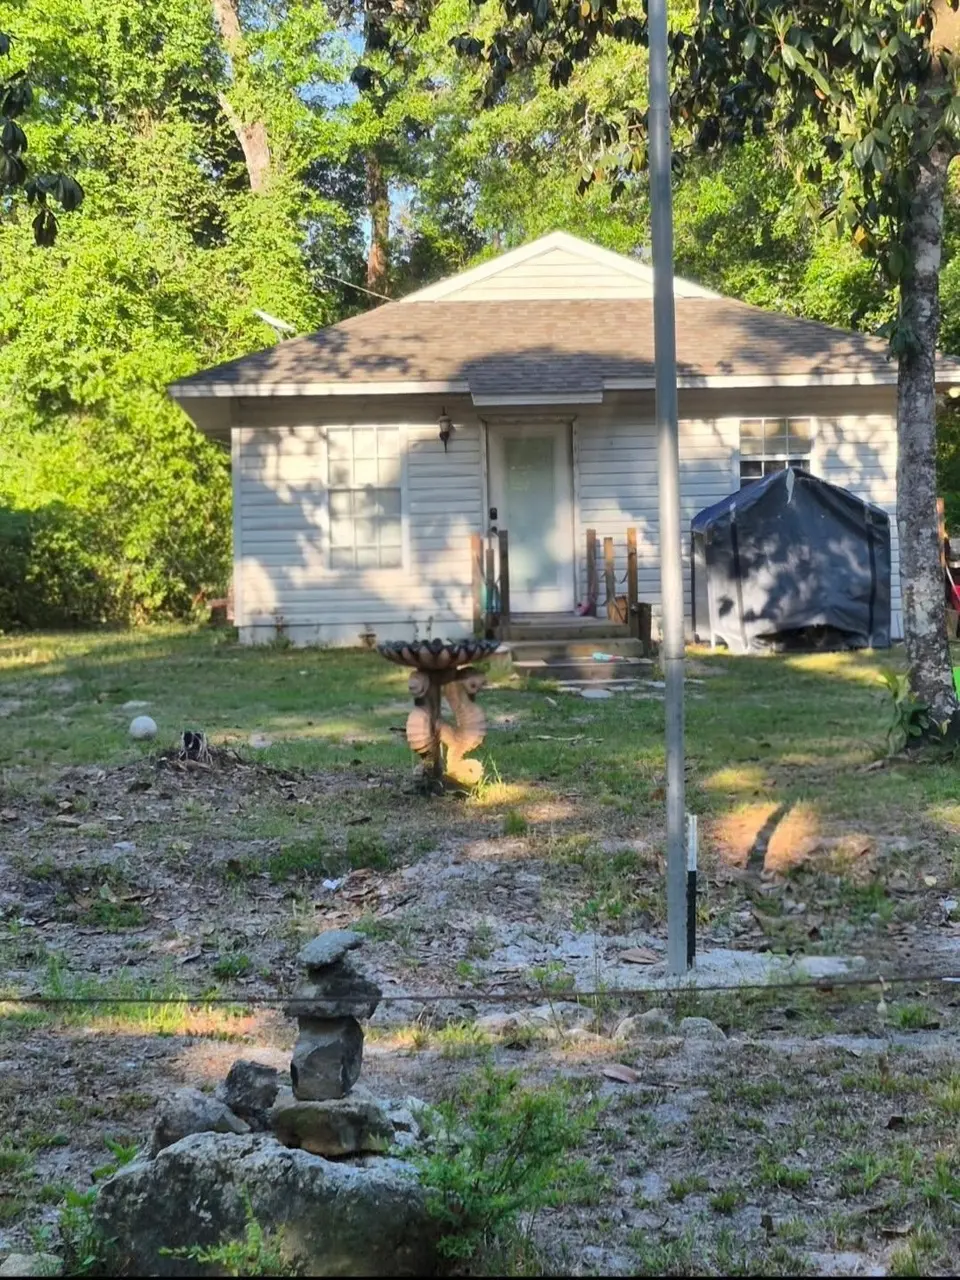
26 Deloriss Dr · St. Marks, FL
Flood risk 7/10 · Major
- FEMA flood zone
- AE
- Chance of flooding over 30 yrs
- 0.76%
- Est. flood insurance / yr
- $1,737 – $8,500
Fire risk 6/10 · Moderate
- Est. fire insurance / yr
- $947 – $1,759
Heat risk 9/10 · Severe
- Hot days now (above 111°F)
- 7 days/yr
- Hot days in 30 yrs
- 21 days/yr
Wind risk 9/10 · Severe
- Chance of severe wind over 30 yrs
- 99.0%
Air-quality risk 3/10 · Minor
- Unhealthy air days now
- 3 days/yr
- Unhealthy air days in 30 yrs
- 3 days/yr
Risk factors via First Street. Map © Google.
Why this score? — see what drove the B grade
The composite is a weighted blend of 9 inputs, each scored 0–100. Each bar is that input's sub-score; the figure is the points it added to the 100-point composite (weight × sub-score).
- Cash flow +25.9/30.0
- ARV discount +15.0/15.0
- DSCR +8.7/10.0
- 1% rule +6.4/10.0
- Schools +4.8/10.0
- Rent growth +3.3/5.0
- Appreciation +2.7/10.0
- Livability +2.5/5.0
- Condition / age +2.5/5.0
$120,000
🖨 Deal sheet 📄 Offer letter ✓ Due diligence
Listing remarks MLS
THIS WAS NOT AN ARMS LENGHT TRANSACTION-SOLD PRE LISTING TO CURRENT TENANTS IN AS IS CONDITION WITH ALL FAULTS
Key facts
- Natural attractions
- Coastal retreat
- Short-term rental
Tags
Property features AI
Finance
- Other: Lot approximately 0.3 acres
- Financial info: Offered for sale
Exterior
- Parking: Parking space(s)
- Utilities: Septic tank
- Home design: Single-story home
- Construction: Vinyl siding
- Exterior features: Unimproved road access
Interior
- Kitchen: Oven; Range
- Bedrooms: Bedroom 2: 11x11; Additional bedroom: 12x11
- Flooring: Carpet; Laminate; Tile
- Bathrooms: 1 full bathroom
- Heating & cooling: Central heating; Electric heating; Heat pump; Central air conditioning; Ceiling fans; Electric cooling
- Interior features: Carpet, laminate, and tile flooring
Neighborhood map
What this means for you Summary
Snapshot
- This is a 2-bed/1.0-bath single-family listed at $120k.
Deal economics
- At list price, monthly cash flow is $-132 ($-2k/yr) — negative.
- To cash-flow at today's rent, offer at most $97k (19.5% below list).
- Meets the 1% rule at list price ($1k rent vs $120k).
- Recommended offer: $97k (19.5% below list) — sets the bar for cash-flow.
Location & tenants
- Location reads: area grade B — affects rentability + tenant quality, not the cash-flow math above.
- Wakulla (rural): math 56% / reading 56% proficiency, ranked #18 of 73 in FL (top 25%) — acceptable for families but not a draw, mixed tenant base, ~2y average lease.
- Market conditions: Rents rising (+3.2%/yr); 346 active listings in the ZIP; solid renter incomes; 468 units permitted in Wakulla County in 2024 (0 in 5+ unit buildings).
Forward outlook
- Local home prices are declining (-3.0%/yr); year-one equity from $830 of loan paydown is wiped out by about $4k of value loss. Plan a longer hold.
Negotiation context
- It's been on market 34 days — a 3% lower offer ($116k) is reasonable based on typical stale-listing flexibility.
- 2 sale attempts since 3y ago with the ask held roughly flat each time — persistent listings suggest the price (not the market) is what's stuck; bring a comps-based counter.
- Current owner paid $91k; 31% above their basis — modest negotiation headroom, anchor on the comps not their cost.
Risks & watch-outs
- Watch-outs: flood insurance adds $427/mo.
- Climate carrying-cost: in FEMA flood zone AE (mandatory federal flood insurance); severe wind risk, 99% chance of damaging wind over 30y; major wildfire risk; extreme-heat days projected 7→21/yr by 2055 (HVAC capex compounding) — expect insurance premiums to compound above CPI over the hold.
Questions for the listing agent
- What do current leases actually rent for vs. the listed asking? Can we see a recent rent roll and the last 12 months of T-12 income?
- It's been on market 34 days. Have you received any prior offers? Is the seller open to a 19% concession, seller financing, or rate buy-down credit?
- What's the actual annual flood-insurance premium (NFIP or private), and is the property in a SFHA with mandatory coverage?
- Is there a deadline driving the sale (1031 exchange, divorce, estate, relocation)? That informs how much negotiation room exists.
- What's the average days-on-market for RENTAL listings here right now (not sales)? A rising rental-DOM trend means longer vacancies and softer asking-rent achievability than the comps imply.
- What's the recent tenant-quality profile in this submarket — average credit score on applications, eviction rate, late-payment / NSF rate, and stable-employment percentage? A property-management company in the area should have these aggregated.
- How much new for-sale + rental construction is in the pipeline within 1–3 miles? Heavy new supply typically softens prices + rents 12–24 months out; constrained supply supports both.
Investment metrics
- 1% rule
- 1.14% ✓
- Cap rate
- 9.24%
- Cash-on-cash
- 10.51%
- DSCR
- 1.47
- GRM
- 7.3
CMA / ARV
- ARV (on-the-fly)
- $215,040
- Comps found
- 1
Show comp detail 1 sale within ~0.75 mi
| Address | Dist | Beds/Ba | Sqft | Sold | Price | $/sf | Match |
|---|---|---|---|---|---|---|---|
| 27 Whippoorwill Ln | 0.58mi | 1/1.0 (-1) | 768 (0%) | 8mo | $215,000 | $280 | 62 |
Match score weights: distance 35% · size 25% · config 20% · recency 20%. Top-matched comps best support the ARV.
Projected returns pro-forma
-3.0% appreciation · 3.18% rent growth · sell at horizon
- IRR
- -23.7%
- Equity multiple
- 0.19×
- Total profit
- $-27,365
- Equity at exit
- $17,892
- IRR
- -17.2%
- Equity multiple
- 0.03×
- Total profit
- $-32,621
- Equity at exit
- $10,375
Cash invested: $33,600 (down + closing). Projections, not guarantees.
Landlord ↔ Tenant lean methodology
- Overall (STATE)
- 87 Strongly Landlord-Friendly
- State Florida
- 87 Strongly Landlord-Friendly · R+3
- County
- — inherits STATE
- City
- — inherits STATE
ZIP-level market 32327
- Home prices YoY
- -1.5%
- Rents YoY
- 3.2%
- Active inventory
- 346
- Price-to-rent
- 7.3×
Monthly cashflow live
- Estimated rent
- $1,364 medium interval (Pro) →
- Mortgage (P&I)
- −$629
- Tax from tax record
- −$104 /mo · $1,244/yr
- Insurance
- −$50
- Flood insurance flood zone
- −$427 /mo · $5,118/yr
- HOA
- −$0
- Vacancy / Maint / Mgmt
- −$286
- Net cashflow
- $-132
Break-even live
UW: 25.0% down · 7.5% · 30yr · 1.5% tax · 5.0% vac · 8.0% maint · 8.0% mgmt
Financing live
Cash to close
- Down payment
- $30,000
- Closing costs
- $3,600
- Reserves months
- —
- Total cash needed
- —
Loan-product check · same deal, 3 products live
Conventional
25% down · 7.5% · 30yr
- Down + closing
- —
- Monthly P&I
- —
- Monthly cashflow
- —
- DSCR
- —
- Eligible?
- —
Personal DTI + credit; lowest rate.
DSCR
20% down · 8.5% · 30yr
- Down + closing
- —
- Monthly P&I
- —
- Monthly cashflow
- —
- DSCR
- —
- Eligible?
- —
No personal income docs; deal must DSCR.
Hard money
10% down · 12.0% · 12mo
- Down + closing
- —
- Monthly P&I
- —
- Monthly cashflow
- —
- DSCR
- —
- Eligible?
- —
Short-term bridge; refi at stabilization.
Listing history 19 events
-
2026-06-18days on market $120,000 Active 34 DOM
-
2026-06-17days on market $120,000 Active 33 DOM
-
2026-06-16days on market $120,000 Active 32 DOM
-
2026-06-15days on market $120,000 Active 31 DOM
-
2026-06-14days on market $120,000 Active 29 DOM
-
2026-06-10days on market $120,000 Active 26 DOM
-
2026-06-09days on market $120,000 Active 25 DOM
-
2026-06-08days on market $120,000 Active 24 DOM
-
2026-06-07days on market $120,000 Active 23 DOM
-
2026-06-05days on market $120,000 Active 20 DOM
-
2026-06-03days on market $120,000 Active 19 DOM
-
2026-06-02days on market $120,000 Active 18 DOM
-
2026-06-01days on market $120,000 Active 17 DOM
-
2026-05-31days on market $120,000 Active 16 DOM
-
2026-05-30days on market $120,000 Active 15 DOM
-
2026-05-15$120,000 Active
-
2023-03-20soldstatus $91,400 110-char remark
Show marketing remark (110 chars)
THIS WAS NOT AN ARMS LENGHT TRANSACTION-SOLD PRE LISTING TO CURRENT TENANTS IN AS IS CONDITION WITH ALL FAULTS
-
2023-03-20$91,400 110-char remark
Show marketing remark (110 chars)
THIS WAS NOT AN ARMS LENGHT TRANSACTION-SOLD PRE LISTING TO CURRENT TENANTS IN AS IS CONDITION WITH ALL FAULTS
-
2022-12-28soldstatus $250,000
ⓘ Source: listings_history table (triggers on properties + properties_extension) + one-shot
backfill from property_details.listing_events for pre-trigger history.
Tax reassessment forecast FL · Resets to sale price
- Current annual tax
- $1,244 · $104/mo
- Projected year-2 tax
- $1,244 · $104/mo
- Expected delta
- $0/yr ($0/mo · 0.0%)
ⓘ Screening estimate from a state-policy table — verify with the county assessor before closing.
Climate risk First Street
- Flood 7/10 Severe FEMA zone AE · 76% chance over 30 yrs
- Wildfire 6/10 Major
- Heat 9/10 Extreme 7 d/yr ≥111°F today · 21 d/yr by 30 yrs out
- Wind 9/10 Extreme 99% chance of damaging wind over 30 yrs
- Air quality 3/10 Moderate 3 unhealthy d/yr today · 3 by 30 yrs out
Nearby sold comps map
Loading sold comps map…
Walkable amenities ~0.75 mi
Loading nearby amenities…
Taxation est. · year 1
- Rental income
- $16,364
- − Mortgage interest
- −$6,722
- − Property taxes
- −$1,244
- − Insurance
- −$5,718
- − Repairs & maintenance
- −$1,309
- − Management
- −$1,309
- − Depreciation
- −$3,491
- Taxable loss
- −$3,430
- Est. tax savings @ 24.0%
- +$823
- After-tax cash flow
- $-764/yr
For passive investors: Depreciation is non-cash, so a rental often shows a tax loss while cash-flowing — sheltering income. Rental losses are passive: they offset passive income freely, and up to $25,000/yr can offset ordinary (W-2) income if you actively participate and your MAGI is under $100k (phasing out to $0 by $150k); unused losses carry forward. On sale, claimed depreciation is recaptured at up to 25%, and gains may owe capital-gains tax (a 1031 exchange can defer both). Figures are a year-1 estimate at your 24.0% rate — not tax advice; consult a CPA.
Schools (NCES district)
- District
- Wakulla
- NCES district ID
- 1201950
- Math proficiency
- 56% ▼ -7.00%
- Reading proficiency
- 56% ▼ -5.00%
- Median HH income
- $53,740
- Composite
- 48.12/100
- National rank
- #2183
- State rank
- #18 of 73 in FL
Livability — St. Marks
No livability data for this city. (Only ~50 U.S. cities are tracked.)
Census & demographics
- County
- Wakulla County · 31,445 people
- City population
- 273
- Metro
- Tallahassee, FL
- Population (ZIP)
- 31,445
- Household income
- $84,138
- Rent vs Own
- Severe rent burden
- 360.0
Population outlook (Wakulla County) Hauer SSP2
- Today (2025)
- 32,809 people
- By 2030
- 33,165 · +1.1%
- By 2040
- 33,245 · +1.3%
- By 2050
- 32,539 · -0.8%
- By 2075
- 29,676 · -9.5%
- By 2100
- 22,931 · -30.1%
Race, ethnicity, and origin ACS 2023
- Neighborhood character
- Predominantly White (75%)
- Race & ethnicity
- White 75% Black 15% Two or more races 6% Hispanic / Latino 5%
- Hispanic origin (detail)
- Mexican 1% Puerto Rican 1%
- Common ancestry
- Italian 5% Slovak 2% Serbian 2%
- Foreign-born
- 3% · Canada
- Languages at home
- 94% English-only · Spanish 3% Other Indo-European 1%
Political lean MEDSL · Wakulla
- 2024 margin
- Solid R (+44.4) · D 27.4% · R 71.8%
- 2008→2024 swing
- -19.5pp toward R · 2008: -24.8pp · 2024: -44.4pp
- All cycles
- 2024: R+44.4 2020: R+40.9 2016: R+40.1 2012: R+28.1 2008: R+24.8
Not yet ingested
- Civics
- —
Market trends
- HPI YoY
- ▼ -4.59%
- Current HPI
- 302.1883
- Rent YoY
- ▲ 3.18%
- Metro
- Tallahassee, FL
- State GDP YoY
- ▲ 3.28%
- F500 in state
- 36
Industry mix (Fortune 500 HQ in FL)
| Industry | F500 HQs | Revenue |
|---|---|---|
| Industrial Technology | 2 | $29B |
|
||
| Insurance | 2 | $17B |
|
||
| Retail | 1 | $60B |
|
||
| Technology Distribution | 1 | $58B |
|
||
| Homebuilding | 1 | $35B |
|
||
| Technology Manufacturing | 1 | $35B |
|
||
Price history
-52.0% since first listed4 events — show timeline
- 2026-05-15 Listed $120,000 CATRS
- 2023-03-20 Listed $91,400 CATRS
- 2023-03-20 Sold (MLS) $91,400 CATRS
- 2022-12-28 Sold (Public Records) $250,000 Public Records
Property tax history
+2.7%/yrLatest (2025): $1,244 · +5.1% YoY. Source: county tax records.
Cash-flow waterfall
monthlySold comps — $/sqft
last 12 mo · ≤1 miLoading sold comps…