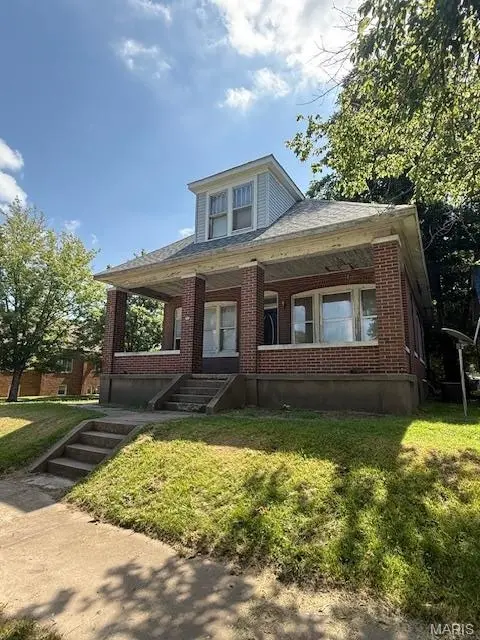
700 Ellis S · Cape Girardeau, MO
Flood risk 1/10 · Minimal
- FEMA flood zone
- X (unshaded)
- Chance of flooding over 30 yrs
- 0.0%
- Est. flood insurance / yr
- $507 – $1,088
Fire risk 1/10 · Minimal
- Est. fire insurance / yr
- $1,054 – $1,958
Heat risk 5/10 · Moderate
- Hot days now (above 108°F)
- 7 days/yr
- Hot days in 30 yrs
- 21 days/yr
Wind risk 2/10 · Minimal
- Chance of severe wind over 30 yrs
- 3.0%
Air-quality risk 2/10 · Minimal
- Unhealthy air days now
- 0 days/yr
- Unhealthy air days in 30 yrs
- 2 days/yr
Risk factors via First Street. Map © Google.
Why this score? — see what drove the B- grade
The composite is a weighted blend of 9 inputs, each scored 0–100. Each bar is that input's sub-score; the figure is the points it added to the 100-point composite (weight × sub-score).
- Cash flow +30.0/30.0
- 1% rule +10.0/10.0
- DSCR +10.0/10.0
- ARV discount +7.8/15.0
- Livability +3.2/5.0
- Schools +3.1/10.0
- Rent growth +2.5/5.0
- Condition / age +2.5/5.0
- Appreciation +0.0/10.0
$75,000
🖨 Deal sheet 📄 Offer letter ✓ Due diligence
Listing remarks MLS
This all brick two story home on a corner lot has been recently renovated. Inside you'll find a formal living an dining room with beautifully painted hardwood floors. The living, kitchen, dining, as well as, one bath and one bedroom are on the main level. Upstairs has three large bedrooms with hardwood floors and one full bath. There is a lovely concrete covered front porch for you to enjoy year round. Alley access via the back of the home for off street parking.
Key facts
- Dining room
- Formal living room
- Recently renovated
Tags
Neighborhood map
What this means for you Summary
Snapshot
- This is a 4-bed/2.0-bath single-family listed at $75k.
Deal economics
- At list price, monthly cash flow is $661 ($8k/yr) — positive.
- The deal already cash-flows at list — no discount required.
- Meets the 1% rule at list price ($1k rent vs $75k).
- Recommended offer: $66k (12.0% below list) — sets the bar for market timing.
- Cap rate 16.9% vs local median 3.9% in Cape Girardeau — top-decile yield for the area; either an underpriced asset or a hidden risk that comps aren't pricing in. Stress-test before assuming the spread holds.
Location & tenants
- Location reads 64/100 on livability (#297 in MO) — a middle-class / working-renter tenant base. Strengths: cost of living A+, housing A+; Watch: schools C-, employment D+, crime F.
- Cape Girardeau 63 (urban): math 33% / reading 42% proficiency, ranked #188 of 324 in MO (top 58%) — families likely to look elsewhere, expect single-tenant / working-renter base with shorter leases; 60% free/reduced lunch — lower-income household profile, screen leases tightly.
- Market conditions: 41 active listings in the ZIP; lower-income renter base — watch delinquency; 81 units permitted in Cape Girardeau County in 2024 (0 in 5+ unit buildings).
- This rent runs 44% of the median local income ($39k/yr) — at the standard rent-burdened threshold; future hikes will face affordability resistance.
Forward outlook
- Local home prices are declining (-3.0%/yr); year-one equity from $519 of loan paydown is wiped out by about $2k of value loss. Plan a longer hold.
- Cape Girardeau County population projected at +17% by 2050 — long-run rental-demand tailwind backs the buy-and-hold thesis.
- At projected returns (-3.0% appreciation + 3.0% rent growth), your $21k cash investment doubles in ~4 years — after that, you're playing with house money.
Negotiation context
- It's been on market 342 days — a 12% lower offer ($66k) is reasonable based on typical stale-listing flexibility.
- 2 sale attempts since 2y ago; this cycle's ask has dropped $22k (23%) from the opening price — seller is motivated, your offer sets the floor, not the list.
Risks & watch-outs
- Watch-outs: built in 1920 — expect roof / HVAC / electrical / plumbing capex.
- Climate carrying-cost: extreme-heat days projected 7→21/yr by 2055 (HVAC capex compounding) — expect insurance premiums to compound above CPI over the hold.
Questions for the listing agent
- It's been on market 342 days. Have you received any prior offers? Is the seller open to a 12% concession, seller financing, or rate buy-down credit?
- Built in 1920 — when were the roof, HVAC, electrical panel, plumbing, and water heater last replaced?
- Why hasn't it sold? Are there any deal-killer items the seller is aware of (foundation, flood, title, zoning, code violations)?
- Is there a deadline driving the sale (1031 exchange, divorce, estate, relocation)? That informs how much negotiation room exists.
- Crime grade is F in this area — have there been break-ins, vandalism, or insurance claims at this property in the last 3 years? What carrier currently insures it and at what premium?
- What's the average days-on-market for RENTAL listings here right now (not sales)? A rising rental-DOM trend means longer vacancies and softer asking-rent achievability than the comps imply.
- What's the recent tenant-quality profile in this submarket — average credit score on applications, eviction rate, late-payment / NSF rate, and stable-employment percentage? A property-management company in the area should have these aggregated.
- How much new for-sale + rental construction is in the pipeline within 1–3 miles? Heavy new supply typically softens prices + rents 12–24 months out; constrained supply supports both.
Investment metrics
- 1% rule
- 1.88% ✓
- Cap rate
- 16.86%
- Cash-on-cash
- 37.75%
- DSCR
- 2.68
- GRM
- 4.4
CMA / ARV
- ARV (median comp)
- $75,427
- List price
- $75,000
- Delta
- -0.57%
- Verdict
- FAIR
- Comps
- 20 within 1.0 mi
Show comp detail 12 sales within ~0.75 mi
| Address | Dist | Beds/Ba | Sqft | Sold | Price | $/sf | Match |
|---|---|---|---|---|---|---|---|
| 718 Morgan Oak St | 0.32mi | 4/1.5 | 2,152 (-2%) | 4mo | $99,900 | $46 | 77 |
| 516 S Sprigg St | 0.20mi | 5/2.5 (+1) | 2,097 (-4%) | 13mo | $150,000 | $72 | 66 |
| 1317 Bloomfield St | 0.54mi | 3/1.0 (-1) | 2,174 (-0%) | 6mo | $139,000 | $64 | 60 |
| 622 S Park Ave | 0.41mi | 3/1.0 (-1) | 2,112 (-3%) | 10mo | $109,900 | $52 | 58 |
| 1425 Cousin St | 0.56mi | 4/2.0 | 2,138 (-2%) | 15mo | $50,000 | $23 | 58 |
| 1219 Merriwether St | 0.71mi | 3/2.5 (-1) | 2,201 (+1%) | 6mo | $120,000 | $55 | 53 |
| 1506 Jefferson Ave | 0.63mi | 3/2.0 (-1) | 2,320 (+6%) | 3mo | $219,000 | $94 | 53 |
| 317 S Louisiana St | 0.67mi | 5/2.5 (+1) | 2,157 (-1%) | 11mo | $199,900 | $93 | 51 |
| 1210 S Sprigg St | 0.46mi | 3/1.5 (-1) | 2,352 (+8%) | 12mo | $80,000 | $34 | 49 |
| 1201 Good Hope St | 0.53mi | 4/2.0 | 1,940 (-11%) | 15mo | $35,000 | $18 | 44 |
| 229 S West End Blvd | 0.64mi | 3/2.5 (-1) | 2,488 (+14%) | 2mo | $195,000 | $78 | 38 |
| 1610 Bloomfield Rd | 0.74mi | 3/1.5 (-1) | 2,424 (+11%) | 8mo | $199,900 | $82 | 34 |
Match score weights: distance 35% · size 25% · config 20% · recency 20%. Top-matched comps best support the ARV.
Projected returns pro-forma
-3.0% appreciation · 3.0% rent growth · sell at horizon
- IRR
- 33.7%
- Equity multiple
- 2.42×
- Total profit
- $29,903
- Equity at exit
- $11,183
- IRR
- 40.6%
- Equity multiple
- 4.82×
- Total profit
- $80,145
- Equity at exit
- $6,485
Cash invested: $21,000 (down + closing). Projections, not guarantees.
Landlord ↔ Tenant lean methodology
- Overall (STATE)
- 81 Strongly Landlord-Friendly
- State Missouri
- 81 Strongly Landlord-Friendly · R+10
- County
- — inherits STATE
- City
- — inherits STATE
ZIP-level market 63703
- Home prices YoY
- -29.3%
- Active inventory
- 41
- Price-to-rent
- 4.4×
Monthly cashflow live
- Estimated rent
- $1,413 medium interval (Pro) →
- Mortgage (P&I)
- −$393
- Tax from tax record
- −$31 /mo · $374/yr
- Insurance
- −$31
- HOA
- −$0
- Vacancy / Maint / Mgmt
- −$297
- Net cashflow
- $661
Break-even live
UW: 25.0% down · 7.5% · 30yr · 1.5% tax · 5.0% vac · 8.0% maint · 8.0% mgmt
Financing live
Cash to close
- Down payment
- $18,750
- Closing costs
- $2,250
- Reserves months
- —
- Total cash needed
- —
Loan-product check · same deal, 3 products live
Conventional
25% down · 7.5% · 30yr
- Down + closing
- —
- Monthly P&I
- —
- Monthly cashflow
- —
- DSCR
- —
- Eligible?
- —
Personal DTI + credit; lowest rate.
DSCR
20% down · 8.5% · 30yr
- Down + closing
- —
- Monthly P&I
- —
- Monthly cashflow
- —
- DSCR
- —
- Eligible?
- —
No personal income docs; deal must DSCR.
Hard money
10% down · 12.0% · 12mo
- Down + closing
- —
- Monthly P&I
- —
- Monthly cashflow
- —
- DSCR
- —
- Eligible?
- —
Short-term bridge; refi at stabilization.
Listing history 21 events
-
2026-06-19days on market $75,000 Active 342 DOM
-
2026-06-18days on market $75,000 Active 341 DOM
-
2026-06-17days on market $75,000 Active 340 DOM
-
2026-06-16days on market $75,000 Active 339 DOM
-
2026-06-15days on market $75,000 Active 338 DOM
-
2026-06-14days on market $75,000 Active 336 DOM
-
2026-06-13days on market $75,000 Active 335 DOM
-
2026-06-10days on market $75,000 Active 333 DOM
-
2026-06-09days on market $75,000 Active 332 DOM
-
2026-06-08days on market $75,000 Active 331 DOM
-
2026-06-07days on market $75,000 Active 330 DOM
-
2026-06-05days on market $75,000 Active 327 DOM
-
2026-06-03days on market $75,000 Active 326 DOM
-
2026-06-02days on market $75,000 Active 325 DOM
-
2026-06-01days on market $75,000 Active 324 DOM
-
2026-05-31days on market $75,000 Active 323 DOM
-
2026-05-30days on market $75,000 Active 322 DOM
-
2026-04-02price $75,000 467-char remark
Show marketing remark (467 chars)
This all brick two story home on a corner lot has been recently renovated. Inside you'll find a formal living an dining room with beautifully painted hardwood floors. The living, kitchen, dining, as well as, one bath and one bedroom are on the main level. Upstairs has three large bedrooms with hardwood floors and one full bath. There is a lovely concrete covered front porch for you to enjoy year round. Alley access via the back of the home for off street parking.
-
2025-07-12$97,500 Active 467-char remark
Show marketing remark (467 chars)
This all brick two story home on a corner lot has been recently renovated. Inside you'll find a formal living an dining room with beautifully painted hardwood floors. The living, kitchen, dining, as well as, one bath and one bedroom are on the main level. Upstairs has three large bedrooms with hardwood floors and one full bath. There is a lovely concrete covered front porch for you to enjoy year round. Alley access via the back of the home for off street parking.
-
2024-11-01historical
-
2024-07-23$69,900 Active
ⓘ Source: listings_history table (triggers on properties + properties_extension) + one-shot
backfill from property_details.listing_events for pre-trigger history.
Tax reassessment forecast MO · Resets to sale price
- Current annual tax
- $374 · $31/mo
- Projected year-2 tax
- $728 · $61/mo
- Expected delta
- +$354/yr (+$29/mo · 94.5%)
ⓘ Screening estimate from a state-policy table — verify with the county assessor before closing.
Climate risk First Street
- Flood 1/10 Low FEMA zone X (unshaded) · 0% chance over 30 yrs
- Wildfire 1/10 Low
- Heat 5/10 Major 7 d/yr ≥108°F today · 21 d/yr by 30 yrs out
- Wind 2/10 Low 3% chance of damaging wind over 30 yrs
- Air quality 2/10 Low 0 unhealthy d/yr today · 2 by 30 yrs out
Nearby sold comps map
Loading sold comps map…
Walkable amenities ~0.75 mi
Loading nearby amenities…
Taxation est. · year 1
- Rental income
- $16,957
- − Mortgage interest
- −$4,201
- − Property taxes
- −$374
- − Insurance
- −$375
- − Repairs & maintenance
- −$1,357
- − Management
- −$1,357
- − Depreciation
- −$2,182
- Taxable income
- $7,112
- Est. tax owed @ 24.0%
- −$1,707
- After-tax cash flow
- $6,220/yr
For passive investors: Depreciation is non-cash, so a rental often shows a tax loss while cash-flowing — sheltering income. Rental losses are passive: they offset passive income freely, and up to $25,000/yr can offset ordinary (W-2) income if you actively participate and your MAGI is under $100k (phasing out to $0 by $150k); unused losses carry forward. On sale, claimed depreciation is recaptured at up to 25%, and gains may owe capital-gains tax (a 1031 exchange can defer both). Figures are a year-1 estimate at your 24.0% rate — not tax advice; consult a CPA.
Schools (NCES district)
- District
- Cape Girardeau 63
- NCES district ID
- 2907120
- Math proficiency
- 33% ▼ -6.00%
- Reading proficiency
- 42% ▼ -7.00%
- Median HH income
- $40,543
- Composite
- 31.49/100
- National rank
- #5974
- State rank
- #188 of 324 in MO
Livability — Cape Girardeau
- Score
- 64/100
- State rank
- #297
- US rank
- #13759
Category grades
Schools grade is shown separately in the Schools card above.
Census & demographics
- Census place
- Cape Girardeau, MO
- County
- Cape Girardeau County · 75,175 people
- City population
- 47,546
- Metro
- Cape Girardeau, MO-IL
- Population (ZIP)
- 8,201
- Household income
- $38,695
- Rent vs Own
- Severe rent burden
- 617.0
Population outlook (Cape Girardeau County) Hauer SSP2
- Today (2025)
- 84,807 people
- By 2030
- 88,016 · +3.8%
- By 2040
- 93,914 · +10.7%
- By 2050
- 99,541 · +17.4%
- By 2075
- 114,527 · +35.0%
- By 2100
- 121,718 · +43.5%
Race, ethnicity, and origin ACS 2023
- Neighborhood character
- Predominantly White (69%)
- Race & ethnicity
- White 69% Black 19% Two or more races 5% Hispanic / Latino 5%
- Hispanic origin (detail)
- Mexican 4% Puerto Rican 1%
- Common ancestry
- Slovak 2% Lithuanian 2% Italian 2%
- Foreign-born
- 4% · Canada, Jamaica
- Languages at home
- 94% English-only · Spanish 3% Russian/Polish/Slavic 1% Other Indo-European 1%
Political lean MEDSL · Cape Girardeau
- 2024 margin
- Solid R (+46.5) · D 26.2% · R 72.7% · Other 1.1%
- 2008→2024 swing
- -12.9pp toward R · 2008: -33.6pp · 2024: -46.5pp
- All cycles
- 2024: R+46.5 2020: R+45.0 2016: R+50.1 2012: R+43.8 2008: R+33.6
Not yet ingested
- Civics
- —
Market trends
- HPI YoY
- ▼ -63.10%
- Current HPI
- 152.013
- Rent YoY
- —
- Metro
- Cape Girardeau, MO-IL
- State GDP YoY
- ▲ 1.84%
- F500 in state
- 20
Industry mix (Fortune 500 HQ in MO)
| Industry | F500 HQs | Revenue |
|---|---|---|
| Healthcare | 1 | $163B |
|
||
| Insurance | 1 | $21B |
|
||
| Industrial Technology | 1 | $17B |
|
||
| Retail | 1 | $16B |
|
||
| Industrial Distribution | 1 | $10B |
|
||
| Utilities | 1 | $9B |
|
||
Price history
+7.3% since first listed4 events — show timeline
- 2026-04-02 Price Changed $75,000 MARIS as Distributed by MLS Grid
- 2025-07-12 Listed $97,500 MARIS as Distributed by MLS Grid
- 2024-11-01 Delisted — MARIS as Distributed by MLS Grid
- 2024-07-23 Listed $69,900 MARIS as Distributed by MLS Grid
Property tax history
+1.2%/yrLatest (2025): $374 · +5.4% YoY. Source: county tax records.
Cash-flow waterfall
monthlySold comps — $/sqft
last 12 mo · ≤1 miLoading sold comps…