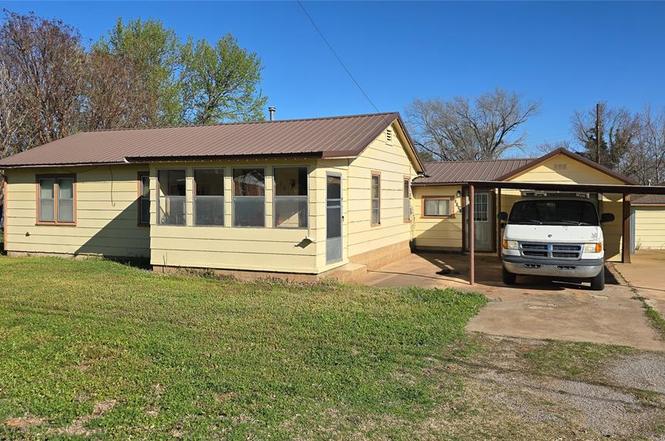
1212 12th St · Maysville, OK
Flood risk 1/10 · Minimal
- FEMA flood zone
- X (unshaded)
- Chance of flooding over 30 yrs
- 0.0%
- Est. flood insurance / yr
- $507 – $1,088
Fire risk 6/10 · Moderate
- Est. fire insurance / yr
- $2,463 – $4,575
Heat risk 6/10 · Moderate
- Hot days now (above 109°F)
- 7 days/yr
- Hot days in 30 yrs
- 19 days/yr
Wind risk 3/10 · Minor
- Chance of severe wind over 30 yrs
- 9.0%
Air-quality risk 1/10 · Minimal
- Unhealthy air days now
- 0 days/yr
- Unhealthy air days in 30 yrs
- 0 days/yr
Risk factors via First Street. Map © Google.
Why this score? — see what drove the B+ grade
The composite is a weighted blend of 9 inputs, each scored 0–100. Each bar is that input's sub-score; the figure is the points it added to the 100-point composite (weight × sub-score).
- Cash flow +25.8/30.0
- ARV discount +15.0/15.0
- Appreciation +9.8/10.0
- DSCR +8.6/10.0
- 1% rule +6.2/10.0
- Livability +3.1/5.0
- Rent growth +2.5/5.0
- Condition / age +2.5/5.0
- Schools +1.8/10.0
$95,000
🖨 Deal sheet 📄 Offer letter ✓ Due diligence
Listing remarks
Investment opportunity at 1212 12th St, Maysville! Situated on 3 well-maintained lots, this property features 2 separate buildings offering excellent potential for rental income, multi-generational living, or future development. The primary home includes 2 bedrooms and 1.5 bathrooms with two living areas, a kitchen, and laundry room, providing plenty of space for comfortable living. The property also features a two-car carport, side deck, and storm shelter. The second building includes 2 bedrooms, 1 bathroom, a living area, and a one-car garage. While it will require some repairs, it presents a great opportunity for investors or buyers looking to add value and create a second residence, gue
Key facts
- Two living areas
- Well maintained lots
- Two car carport
Tags
Property features AI
Finance
- Other: Assessor-listed living area; Located in Hollowaygray Addition; Occupied
- Financial info: Loan qualifying available
- HOA & community: No mandatory association dues
Exterior
- Parking: Detached or attached 1-car garage
- Security: Below-ground storm shelter
- Home design: Single family residence; One-level property; Residential property
- Construction: Frame construction; Metal roof; Combination foundation; Built (existing)
- Exterior features: Open deck; Porch; Outdoor storage; Interior lot
Interior
- Bedrooms: Four bedrooms
- Bathrooms: Two full bathrooms; One half bathroom
- Interior features: Two living areas; No fireplace
Neighborhood map
What this means for you Summary
Snapshot
- This is a 2-bed/1.0-bath single-family listed at $95k.
Deal economics
- At list price, monthly cash flow is $231 ($3k/yr) — positive.
- The deal already cash-flows at list — no discount required.
- Meets the 1% rule at list price ($1k rent vs $95k).
- Recommended offer: $86k (9.0% below list) — sets the bar for market timing.
Location & tenants
- Location reads 61/100 on livability (#302 in OK) — a middle-class / working-renter tenant base. Strengths: cost of living A+, housing A+; Watch: amenities F, commute F, health & safety F.
- Maysville (rural): math 20% / reading 15% proficiency, ranked #442 of 513 in OK (top 86%) — low school quality limits family demand, transient renter base, plan for 1-2y turnover; 61% free/reduced lunch — lower-income household profile, screen leases tightly.
- Zoned schools: Maysville Es (math 8% / reading 17%, grade F, #652 of 845 statewide, top 79%, 254 students, 0% FRL); Maysville Hs (math 30% / reading 50%, grade F, #25 of 447 statewide, top 8%, 70 students, 0% FRL) — zoned schools average 0% FRL vs 61% district-wide (61 pts lower); this property's tenant base skews higher-income than the district average.
- Market conditions: 23 active listings in the ZIP; 1 units permitted in Garvin County in 2024 (0 in 5+ unit buildings).
Forward outlook
- In year one you build about $10k of equity ($657 loan paydown + $9k appreciation (9.6% local appreciation)).
- Garvin County population projected at +8% by 2050 — modest demand growth; plan on rents tracking national, not racing it.
- At projected returns (9.6% appreciation + 3.0% rent growth), your $27k cash investment doubles in ~3 years — after that, you're playing with house money.
- By year 4, paydown + projected appreciation supports a ~$35k cash-out refi (75% LTV) — recoverable capital for the next deal without selling this one.
Negotiation context
- It's been on market 97 days — a 9% lower offer ($86k) is reasonable based on typical stale-listing flexibility.
- 2 sale attempts since 3y ago with the ask held roughly flat each time — persistent listings suggest the price (not the market) is what's stuck; bring a comps-based counter.
- Current owner paid $55k; list at $95k implies a 73% gain — meaningful room to come down on a strong offer.
Risks & watch-outs
- Climate carrying-cost: major wildfire risk; extreme-heat days projected 7→19/yr by 2055 (HVAC capex compounding) — expect insurance premiums to compound above CPI over the hold.
Questions for the listing agent
- It's been on market 97 days. Have you received any prior offers? Is the seller open to a 9% concession, seller financing, or rate buy-down credit?
- Built in 1966 — when were the roof, HVAC, electrical panel, plumbing, and water heater last replaced?
- Why hasn't it sold? Are there any deal-killer items the seller is aware of (foundation, flood, title, zoning, code violations)?
- Is there a deadline driving the sale (1031 exchange, divorce, estate, relocation)? That informs how much negotiation room exists.
- Schools are F-rated, which usually means shorter tenancies and higher turnover. Who's the typical renter profile here, and what's been the actual vacancy rate?
- What's the average days-on-market for RENTAL listings here right now (not sales)? A rising rental-DOM trend means longer vacancies and softer asking-rent achievability than the comps imply.
- What's the recent tenant-quality profile in this submarket — average credit score on applications, eviction rate, late-payment / NSF rate, and stable-employment percentage? A property-management company in the area should have these aggregated.
- How much new for-sale + rental construction is in the pipeline within 1–3 miles? Heavy new supply typically softens prices + rents 12–24 months out; constrained supply supports both.
Investment metrics
- 1% rule
- 1.12% ✓
- Cap rate
- 9.21%
- Cash-on-cash
- 10.41%
- DSCR
- 1.46
- GRM
- 7.5
CMA / ARV
- ARV (on-the-fly)
- $186,858
- Comps found
- 4
Show comp detail 4 sales within ~0.75 mi
| Address | Dist | Beds/Ba | Sqft | Sold | Price | $/sf | Match |
|---|---|---|---|---|---|---|---|
| 817 Park View Dr | 0.30mi | 2/1.0 | 1,550 (+4%) | 8mo | $103,000 | $66 | 72 |
| 12918 N County Road 3130 | 0.44mi | 2/1.0 | 1,308 (-12%) | 6mo | $337,500 | $258 | 55 |
| 901 Ripley St | 0.70mi | 3/1.0 (+1) | 1,392 (-6%) | 11mo | $175,000 | $126 | 43 |
| 207 Elm St | 0.72mi | 2/2.0 | 1,430 (-4%) | 16mo | $170,000 | $119 | 43 |
Match score weights: distance 35% · size 25% · config 20% · recency 20%. Top-matched comps best support the ARV.
Projected returns pro-forma
9.64% appreciation · 3.0% rent growth · sell at horizon
- IRR
- 31.2%
- Equity multiple
- 3.41×
- Total profit
- $64,102
- Equity at exit
- $83,109
- IRR
- 27.1%
- Equity multiple
- 7.64×
- Total profit
- $176,599
- Equity at exit
- $176,659
Cash invested: $26,600 (down + closing). Projections, not guarantees.
Landlord ↔ Tenant lean methodology
- Overall (STATE)
- 83 Strongly Landlord-Friendly
- State Oklahoma
- 83 Strongly Landlord-Friendly · R+20
- County
- — inherits STATE
- City
- — inherits STATE
ZIP-level market 73057
- Home prices YoY
- 4.2%
- Active inventory
- 23
- Price-to-rent
- 7.5×
Monthly cashflow live
- Estimated rent
- $1,061 medium interval (Pro) →
- Mortgage (P&I)
- −$498
- Tax from tax record
- −$70 /mo · $839/yr
- Insurance
- −$40
- HOA
- −$0
- Vacancy / Maint / Mgmt
- −$223
- Net cashflow
- $231
Break-even live
UW: 25.0% down · 7.5% · 30yr · 1.5% tax · 5.0% vac · 8.0% maint · 8.0% mgmt
Financing live
Cash to close
- Down payment
- $23,750
- Closing costs
- $2,850
- Reserves months
- —
- Total cash needed
- —
Loan-product check · same deal, 3 products live
Conventional
25% down · 7.5% · 30yr
- Down + closing
- —
- Monthly P&I
- —
- Monthly cashflow
- —
- DSCR
- —
- Eligible?
- —
Personal DTI + credit; lowest rate.
DSCR
20% down · 8.5% · 30yr
- Down + closing
- —
- Monthly P&I
- —
- Monthly cashflow
- —
- DSCR
- —
- Eligible?
- —
No personal income docs; deal must DSCR.
Hard money
10% down · 12.0% · 12mo
- Down + closing
- —
- Monthly P&I
- —
- Monthly cashflow
- —
- DSCR
- —
- Eligible?
- —
Short-term bridge; refi at stabilization.
Listing history 19 events
-
2026-06-18days on market $95,000 Active 97 DOM
-
2026-06-17days on market $95,000 Active 96 DOM
-
2026-06-16days on market $95,000 Active 95 DOM
-
2026-06-15days on market $95,000 Active 94 DOM
-
2026-06-13days on market $95,000 Active 92 DOM
-
2026-06-12days on market $95,000 Active 91 DOM
-
2026-06-09days on market $95,000 Active 88 DOM
-
2026-06-08days on market $95,000 Active 87 DOM
-
2026-06-08days on market $95,000 Active 86 DOM
-
2026-06-05days on market $95,000 Active 84 DOM
-
2026-06-04days on market $95,000 Active 82 DOM
-
2026-06-02days on market $95,000 Active 81 DOM
-
2026-06-01days on market $95,000 Active 80 DOM
-
2026-05-31days on market $95,000 Active 79 DOM
-
2026-03-13$95,000 Active
-
2024-03-01historical
-
2023-11-01$115,000 Active
-
2009-10-09soldstatus $55,000
-
2006-05-03soldstatus $49,500
ⓘ Source: listings_history table (triggers on properties + properties_extension) + one-shot
backfill from property_details.listing_events for pre-trigger history.
Tax reassessment forecast OK · Resets to sale price
- Current annual tax
- $839 · $70/mo
- Projected year-2 tax
- $855 · $71/mo
- Expected delta
- +$16/yr (+$1/mo · 1.9%)
ⓘ Screening estimate from a state-policy table — verify with the county assessor before closing.
Climate risk First Street
- Flood 1/10 Low FEMA zone X (unshaded) · 0% chance over 30 yrs
- Wildfire 6/10 Major
- Heat 6/10 Major 7 d/yr ≥109°F today · 19 d/yr by 30 yrs out
- Wind 3/10 Moderate 9% chance of damaging wind over 30 yrs
- Air quality 1/10 Low 0 unhealthy d/yr today · 0 by 30 yrs out
Nearby sold comps map
Loading sold comps map…
Walkable amenities ~0.75 mi
Loading nearby amenities…
Taxation est. · year 1
- Rental income
- $12,737
- − Mortgage interest
- −$5,321
- − Property taxes
- −$839
- − Insurance
- −$475
- − Repairs & maintenance
- −$1,019
- − Management
- −$1,019
- − Depreciation
- −$2,764
- Taxable income
- $1,300
- Est. tax owed @ 24.0%
- −$312
- After-tax cash flow
- $2,458/yr
For passive investors: Depreciation is non-cash, so a rental often shows a tax loss while cash-flowing — sheltering income. Rental losses are passive: they offset passive income freely, and up to $25,000/yr can offset ordinary (W-2) income if you actively participate and your MAGI is under $100k (phasing out to $0 by $150k); unused losses carry forward. On sale, claimed depreciation is recaptured at up to 25%, and gains may owe capital-gains tax (a 1031 exchange can defer both). Figures are a year-1 estimate at your 24.0% rate — not tax advice; consult a CPA.
Schools (NCES district)
- District
- Maysville
- NCES district ID
- 4019380
- Math proficiency
- 20% ▲ 10.00%
- Reading proficiency
- 15% ▼ -5.00%
- Median HH income
- $38,652
- Composite
- 18.11/100
- National rank
- #14076
- State rank
- #442 of 513 in OK
Livability — Maysville
- Score
- 61/100
- State rank
- #302
- US rank
- #17823
Category grades
Schools grade is shown separately in the Schools card above.
Census & demographics
- Census place
- Maysville, OK
- Population (ZIP)
- 2,210
Population outlook (Garvin County) Hauer SSP2
- Today (2025)
- 28,277 people
- By 2030
- 28,619 · +1.2%
- By 2040
- 29,478 · +4.2%
- By 2050
- 30,384 · +7.5%
- By 2075
- 34,074 · +20.5%
- By 2100
- 36,099 · +27.7%
Race, ethnicity, and origin ACS 2023
- Neighborhood character
- Predominantly White (79%)
- Race & ethnicity
- White 79% Two or more races 12% Native American 7% Hispanic / Latino 2%
- Common ancestry
- Lithuanian 8% European 3% Italian 2%
- Foreign-born
- 0%
- Languages at home
- 99% English-only · Spanish 1%
Political lean MEDSL · Garvin
- 2024 margin
- Solid R (+66.1) · D 16.4% · R 82.5% · Other 1.1%
- 2008→2024 swing
- -22.5pp toward R · 2008: -43.6pp · 2024: -66.1pp
- All cycles
- 2024: R+66.1 2020: R+64.2 2016: R+60.7 2012: R+46.1 2008: R+43.6
Not yet ingested
- Civics
- —
Market trends
- HPI YoY
- ▲ 9.64%
- Current HPI
- 240.7465
- Rent YoY
- —
- Metro
- —
- State GDP YoY
- ▲ 1.55%
- F500 in state
- 6
Industry mix (Fortune 500 HQ in OK)
| Industry | F500 HQs | Revenue |
|---|---|---|
| Energy | 3 | $48B |
|
||
Price history
+91.9% since first listed5 events — show timeline
- 2026-03-13 Listed $95,000 MLSOK
- 2024-03-01 Listing Removed — MLSOK
- 2023-11-01 Listed $115,000 MLSOK
- 2009-10-09 Sold (Public Records) $55,000 Public Records
- 2006-05-03 Sold (Public Records) $49,500 Public Records
Property tax history
+5.1%/yrLatest (2025): $839 · +6.1% YoY. Source: county tax records.
Cash-flow waterfall
monthlySold comps — $/sqft
last 12 mo · ≤1 miLoading sold comps…