 🏗️ New Construction
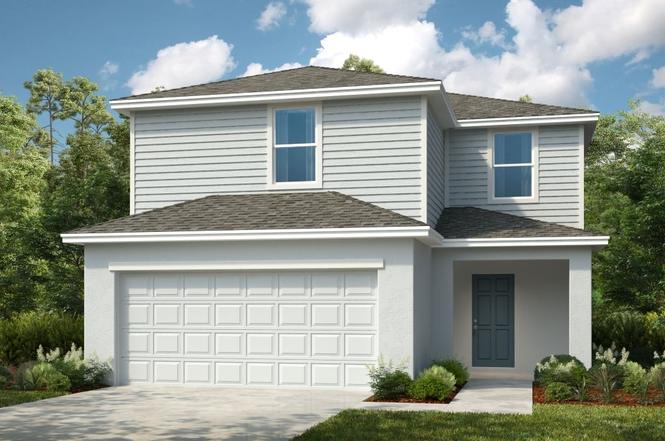
Dove Plan · Ruskin, FL
Flood risk No data
- FEMA flood zone
- —
- Chance of flooding over 30 yrs
- —
- Est. flood insurance / yr
- —
Fire risk No data
- Est. fire insurance / yr
- —
Heat risk No data
- Hot days now (above threshold)
- —
- Hot days in 30 yrs
- —
Wind risk No data
- Chance of severe wind over 30 yrs
- —
Air-quality risk No data
- Unhealthy air days now
- —
- Unhealthy air days in 30 yrs
- —
Risk factors via First Street. Map © Google.
Why this score? — see what drove the D- grade
The composite is a weighted blend of 9 inputs, each scored 0–100. Each bar is that input's sub-score; the figure is the points it added to the 100-point composite (weight × sub-score).
- Cash flow +9.8/30.0
- ARV discount +7.5/15.0
- Schools +4.4/10.0
- Livability +3.6/5.0
- 1% rule +2.9/10.0
- DSCR +2.8/10.0
- Condition / age +2.5/5.0
- Rent growth +1.8/5.0
- Appreciation +0.0/10.0
$328,999
🖨 Deal sheet 📄 Offer letter ✓ Due diligence
Listing remarks
Introducing The Dove - a beautifully designed two-story home offering 1,850 square feet of modern living space with 3 bedrooms, 2.5 bathrooms, and a 2-car garage. On the first floor, you'll enjoy an open-concept layout featuring a spacious great room, dining area, and a stylish kitchen with a large island-perfect for entertaining. Step outside to your private patio for seamless indoor/outdoor Florida living. A convenient half bath off the foyer and direct access to the 2-car garage complete this level. Upstairs, your primary suite retreat includes a spacious bathroom with a walk-in shower, dual vanity sinks, and a generous walk-in closet. The second floor also offers two secondary bedrooms,
Key facts
- Stylish kitchen
- Private patio
- Walk-in shower
Tags
Property features AI
Finance
- Financial info: List price $328,999
Exterior
- Parking: 2 total parking spaces; 2-car garage
- Home design: New construction plan named Dove; Single-family residence (Plan)
Interior
- Bedrooms: 3 bedrooms
- Bathrooms: 2 full bathrooms and 1 half bathroom
- Interior features: Open living area (1850 total living area)
Neighborhood map
What this means for you Summary
Snapshot
- This is a 3-bed/2.5-bath single-family listed at $329k.
Deal economics
- At list price, monthly cash flow is $-234 ($-3k/yr) — negative.
- The deal already cash-flows at list — no discount required.
- To meet the 1% rule (rent ≥ 1% of price), the offer needs to be $289k (12.1% below list).
- Recommended offer: $289k (12.1% below list) — sets the bar for 1% rule.
Location & tenants
- Location reads 71/100 on livability (#392 in FL) — a middle-class / working-renter tenant base. Strengths: cost of living A+, housing A+, commute B+; Watch: schools F, amenities F, health & safety F.
- Manatee (suburban): math 54% / reading 50% proficiency, ranked #26 of 73 in FL (top 36%) — acceptable for families but not a draw, mixed tenant base, ~2y average lease.
- Market conditions: Rents soft (-3.0%/yr); 1160 active listings in the ZIP; 6 comparable units currently listed for rent nearby; rentals at typical pace (median 20d on market — plan ~3-4 weeks tenant-placement turnaround); solid renter incomes; 7,472 units permitted in Manatee County in 2024 (1,782 in 5+ unit buildings).
- This rent runs 45% of the median local income ($78k/yr) — at the standard rent-burdened threshold; future hikes will face affordability resistance.
Forward outlook
- Local home prices are declining (-3.0%/yr); year-one equity from $3k of loan paydown is wiped out by about $11k of value loss. Plan a longer hold.
- Manatee County population projected at +43% by 2050 — long-run rental-demand tailwind backs the buy-and-hold thesis.
Negotiation context
- It's been on market 103 days — a 9% lower offer ($299k) is reasonable based on typical stale-listing flexibility.
Questions for the listing agent
- What do current leases actually rent for vs. the listed asking? Can we see a recent rent roll and the last 12 months of T-12 income?
- It's been on market 103 days. Have you received any prior offers? Is the seller open to a 12% concession, seller financing, or rate buy-down credit?
- Why hasn't it sold? Are there any deal-killer items the seller is aware of (foundation, flood, title, zoning, code violations)?
- Is there a deadline driving the sale (1031 exchange, divorce, estate, relocation)? That informs how much negotiation room exists.
- Schools are F-rated, which usually means shorter tenancies and higher turnover. Who's the typical renter profile here, and what's been the actual vacancy rate?
- The area grade is low — what's the realistic commute time and amenity access for the typical tenant pool here? Any planned neighborhood developments (good or bad) we should know about?
- What's the average days-on-market for RENTAL listings here right now (not sales)? A rising rental-DOM trend means longer vacancies and softer asking-rent achievability than the comps imply.
- What's the recent tenant-quality profile in this submarket — average credit score on applications, eviction rate, late-payment / NSF rate, and stable-employment percentage? A property-management company in the area should have these aggregated.
- How much new for-sale + rental construction is in the pipeline within 1–3 miles? Heavy new supply typically softens prices + rents 12–24 months out; constrained supply supports both.
Investment metrics
- 1% rule
- 0.79% ✗
- Cap rate
- 5.52%
- Cash-on-cash
- -2.75%
- DSCR
- 0.88
- GRM
- 10.5
CMA / ARV
- ARV (on-the-fly)
- $364,450
- Comps found
- 11
Show comp detail 11 sales within ~0.75 mi
| Address | Dist | Beds/Ba | Sqft | Sold | Price | $/sf | Match |
|---|---|---|---|---|---|---|---|
| 8932 Killbarry Ln | 0.01mi | 3/2.5 | 1,853 (+0%) | 7mo | $350,000 | $189 | 94 |
| 13815 Shellmore Ave | 0.22mi | 3/2.5 | 1,853 (+0%) | 2mo | $325,000 | $175 | 88 |
| 9328 Chiswell Trl | 0.26mi | 3/2.5 | 1,853 (+0%) | 4mo | $325,999 | $176 | 84 |
| 13423 Shellmore Ave | 0.10mi | 3/2.5 | 1,964 (+6%) | 1mo | $339,030 | $173 | 84 |
| 13709 Iona Ave | 0.60mi | 3/2.0 | 1,843 (-0%) | 1mo | $520,000 | $282 | 69 |
| 13412 Shellmore Ave | 0.13mi | 4/2.0 (+1) | 1,607 (-13%) | 1mo | $345,500 | $215 | 65 |
| 13808 Shellmore Ave | 0.21mi | 3/2.0 | 1,603 (-13%) | 2mo | $315,999 | $197 | 64 |
| 13705 Shellmore Ave | 0.22mi | 3/2.0 | 1,603 (-13%) | 3mo | $300,999 | $188 | 63 |
| 13427 Shellmore Ave | 0.10mi | 4/2.0 (+1) | 1,607 (-13%) | 6mo | $331,000 | $206 | 62 |
| 9138 Dalera Cv | 0.20mi | 4/2.0 (+1) | 1,607 (-13%) | 3mo | $325,000 | $202 | 60 |
| 13713 Iona Ave | 0.60mi | 3/3.0 | 2,085 (+13%) | 1mo | $550,000 | $264 | 48 |
Match score weights: distance 35% · size 25% · config 20% · recency 20%. Top-matched comps best support the ARV.
Projected returns pro-forma
-3.0% appreciation · 0.0% rent growth · sell at horizon
- IRR
- -24.3%
- Equity multiple
- 0.19×
- Total profit
- $-82,392
- Equity at exit
- $54,341
- IRR
- -31.5%
- Equity multiple
- -0.21×
- Total profit
- $-123,513
- Equity at exit
- $31,511
Cash invested: $102,046 (down + closing). Projections, not guarantees.
Landlord ↔ Tenant lean methodology
- Overall (STATE)
- 87 Strongly Landlord-Friendly
- State Florida
- 87 Strongly Landlord-Friendly · R+3
- County
- — inherits STATE
- City
- — inherits STATE
ZIP-level market 34221
- Rents YoY
- -3.0%
- Active inventory
- 1160
- Price-to-rent
- 9.5×
Monthly cashflow live
- Estimated rent
- $2,892 high interval (Pro) →
- Mortgage (P&I)
- −$1,911
- Tax est. 1.5%
- −$456 /mo · $5,467/yr
- Insurance
- −$152
- HOA
- −$0
- Vacancy / Maint / Mgmt
- −$607
- Net cashflow
- $-234
Break-even live
UW: 25.0% down · 7.5% · 30yr · 1.5% tax · 5.0% vac · 8.0% maint · 8.0% mgmt
Financing live
Cash to close
- Down payment
- $91,112
- Closing costs
- $10,934
- Reserves months
- —
- Total cash needed
- —
Loan-product check · same deal, 3 products live
Conventional
25% down · 7.5% · 30yr
- Down + closing
- —
- Monthly P&I
- —
- Monthly cashflow
- —
- DSCR
- —
- Eligible?
- —
Personal DTI + credit; lowest rate.
DSCR
20% down · 8.5% · 30yr
- Down + closing
- —
- Monthly P&I
- —
- Monthly cashflow
- —
- DSCR
- —
- Eligible?
- —
No personal income docs; deal must DSCR.
Hard money
10% down · 12.0% · 12mo
- Down + closing
- —
- Monthly P&I
- —
- Monthly cashflow
- —
- DSCR
- —
- Eligible?
- —
Short-term bridge; refi at stabilization.
Rent comps 6 comps
| Address | Beds | Baths | Sqft | Rent | $/sqft | DOM | Units | Dist |
|---|---|---|---|---|---|---|---|---|
| 10473 Curving Creek Loop Parrish, FL | 3.0 | 2.0 | 1366 | $2,500 | $1.83 | 14d | 1 | 0.96mi |
| 11628 Moonsail Dr Parrish, FL | 3.0 | 2.0 | 2144 | $3,500 | $1.63 | 21d | 1 | 1.11mi |
| 11612 Armada Way Parrish, FL | 4.0 | 2.0 | 2112 | $3,400 | $1.61 | 20d | 1 | 1.19mi |
| 10826 Sapphire Breeze Cv Palmetto, FL | 4.0 | 2.0 | 1850 | $2,500 | $1.35 | 3d | 1 | 1.36mi |
| 10646 Hidden Banks Gln Parrish, FL | 3.0 | 2.0 | 1504 | $2,350 | $1.56 | 16d | 1 | 1.38mi |
| 7518 117th Ln E Palmetto, FL | 3.0 | 3.0 | 2156 | $3,100 | $1.44 | 23d | 1 | 1.43mi |
Listing history 14 events
-
2026-06-18days on market $328,999 Active 103 DOM
-
2026-06-17days on market $328,999 Active 102 DOM
-
2026-06-16days on market $328,999 Active 101 DOM
-
2026-06-15days on market $328,999 Active 100 DOM
-
2026-06-13days on market $328,999 Active 98 DOM
-
2026-06-13days on market $328,999 Active 97 DOM
-
2026-06-10days on market $328,999 Active 95 DOM
-
2026-06-09days on market $328,999 Active 94 DOM
-
2026-06-08days on market $328,999 Active 93 DOM
-
2026-06-08days on market $328,999 Active 92 DOM
-
2026-06-03days on market $328,999 Active 88 DOM
-
2026-06-02days on market $328,999 Active 87 DOM
-
2026-06-01days on market $328,999 Active 86 DOM
-
2026-05-31days on market $328,999 Active 85 DOM
ⓘ Source: listings_history table (triggers on properties + properties_extension) + one-shot
backfill from property_details.listing_events for pre-trigger history.
Nearby sold comps map
Loading sold comps map…
Walkable amenities ~0.75 mi
Loading nearby amenities…
Taxation est. · year 1
- Rental income
- $34,703
- − Mortgage interest
- −$20,415
- − Property taxes
- −$5,467
- − Insurance
- −$1,822
- − Repairs & maintenance
- −$2,776
- − Management
- −$2,776
- − Depreciation
- −$10,602
- Taxable loss
- −$9,155
- Est. tax savings @ 24.0%
- +$2,197
- After-tax cash flow
- $-611/yr
For passive investors: Depreciation is non-cash, so a rental often shows a tax loss while cash-flowing — sheltering income. Rental losses are passive: they offset passive income freely, and up to $25,000/yr can offset ordinary (W-2) income if you actively participate and your MAGI is under $100k (phasing out to $0 by $150k); unused losses carry forward. On sale, claimed depreciation is recaptured at up to 25%, and gains may owe capital-gains tax (a 1031 exchange can defer both). Figures are a year-1 estimate at your 24.0% rate — not tax advice; consult a CPA.
Schools (NCES district)
- District
- Manatee
- NCES district ID
- 1201230
- Math proficiency
- 54% ▼ -6.00%
- Reading proficiency
- 50% ▼ -2.00%
- Median HH income
- $49,607
- Composite
- 44.43/100
- National rank
- #2806
- State rank
- #26 of 73 in FL
Livability — Ruskin
- Score
- 71/100
- State rank
- #392
- US rank
- #6879
Category grades
Schools grade is shown separately in the Schools card above.
Census & demographics
- County
- Manatee County · 416,364 people
- City population
- 33,319
- Metro
- North Port-Sarasota-Bradenton, FL
- Population (ZIP)
- 56,208
- Household income
- $77,712
- Rent vs Own
- Severe rent burden
- 1193.0
Population outlook (Manatee County) Hauer SSP2
- Today (2025)
- 447,342 people
- By 2030
- 488,911 · +9.3%
- By 2040
- 567,934 · +27.0%
- By 2050
- 637,995 · +42.6%
- By 2075
- 781,970 · +74.8%
- By 2100
- 848,272 · +89.6%
Race, ethnicity, and origin ACS 2023
- Neighborhood character
- Diverse neighborhood (Simpson 0.58)
- Race & ethnicity
- White 59% Hispanic / Latino 22% Black 14% Two or more races 11%
- Hispanic origin (detail)
- Mexican 14% Puerto Rican 3%
- Common ancestry
- Romanian 2% Lithuanian 2% Italian 2%
- Foreign-born
- 10% · Canada, Dominican Republic, Jamaica
- Languages at home
- 81% English-only · Spanish 16% Other Indo-European 1%
Political lean MEDSL · Manatee
- 2024 margin
- Strong R (+23.5) · D 37.9% · R 61.4%
- 2008→2024 swing
- -16.5pp toward R · 2008: -7.0pp · 2024: -23.5pp
- All cycles
- 2024: R+23.5 2020: R+16.1 2016: R+17.1 2012: R+12.5 2008: R+7.0
Not yet ingested
- Civics
- —
Market trends
- HPI YoY
- ▼ -383.53%
- Current HPI
- 302.1458
- Rent YoY
- ▼ -2.98%
- Metro
- North Port-Sarasota-Bradenton, FL
- State GDP YoY
- ▲ 3.28%
- F500 in state
- 36
Industry mix (Fortune 500 HQ in FL)
| Industry | F500 HQs | Revenue |
|---|---|---|
| Industrial Technology | 2 | $29B |
|
||
| Insurance | 2 | $17B |
|
||
| Retail | 1 | $60B |
|
||
| Technology Distribution | 1 | $58B |
|
||
| Homebuilding | 1 | $35B |
|
||
| Technology Manufacturing | 1 | $35B |
|
||
Cash-flow waterfall
monthlySold comps — $/sqft
last 12 mo · ≤1 miLoading sold comps…