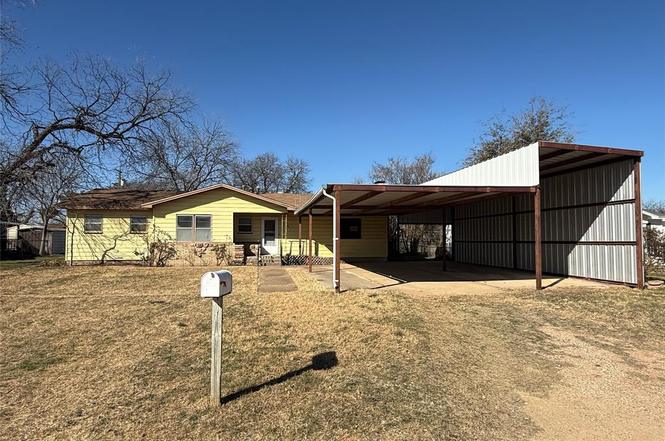
418 Pecan St · Clyde, TX
Flood risk No data
- FEMA flood zone
- —
- Chance of flooding over 30 yrs
- —
- Est. flood insurance / yr
- —
Fire risk No data
- Est. fire insurance / yr
- —
Heat risk No data
- Hot days now (above threshold)
- —
- Hot days in 30 yrs
- —
Wind risk No data
- Chance of severe wind over 30 yrs
- —
Air-quality risk No data
- Unhealthy air days now
- —
- Unhealthy air days in 30 yrs
- —
Risk factors via First Street. Map © Google.
Why this score? — see what drove the B+ grade
The composite is a weighted blend of 9 inputs, each scored 0–100. Each bar is that input's sub-score; the figure is the points it added to the 100-point composite (weight × sub-score).
- Cash flow +30.0/30.0
- ARV discount +15.0/15.0
- 1% rule +10.0/10.0
- DSCR +10.0/10.0
- Schools +3.6/10.0
- Livability +3.4/5.0
- Rent growth +2.5/5.0
- Condition / age +2.5/5.0
- Appreciation +0.0/10.0
$99,900
🖨 Deal sheet 📄 Offer letter ✓ Due diligence
Listing remarks
418 Pecan St in Clyde offers a solid opportunity with 3 bedrooms and 1.5 bathrooms, featuring spacious rooms and classic built-ins that add character throughout the home. The layout includes generous living areas and ample storage. Outside, enjoy a large RV carport and a big backyard with plenty of space for parking, projects, or outdoor entertaining. A great option for buyers looking for space, functionality, and potential in an established neighborhood.
Key facts
- Big backyard
- Large rv carport
- Classic built-ins
Tags
Neighborhood map
What this means for you Summary
Snapshot
- This is a 3-bed/1.5-bath single-family listed at $100k.
Deal economics
- At list price, monthly cash flow is $772 ($9k/yr) — positive.
- The deal already cash-flows at list — no discount required.
- Meets the 1% rule at list price ($2k rent vs $100k).
- Recommended offer: $97k (3.0% below list) — sets the bar for market timing.
- Cap rate 15.6% vs local median 3.2% in Clyde — top-decile yield for the area; either an underpriced asset or a hidden risk that comps aren't pricing in. Stress-test before assuming the spread holds.
Location & tenants
- Location reads 68/100 on livability (#498 in TX) — a middle-class / working-renter tenant base. Strengths: crime A+, cost of living A+, housing A+; Watch: employment C-, health & safety D+, amenities F.
- Clyde CISD (town): math 42% / reading 42% proficiency, ranked #341 of 826 in TX (top 41%) — families likely to look elsewhere, expect single-tenant / working-renter base with shorter leases.
- Zoned schools: Clyde El (366 students, 58% FRL).
- Market conditions: 132 active listings in the ZIP; 1 comparable units currently listed for rent nearby; 11 units permitted in Callahan County in 2024 (0 in 5+ unit buildings).
Forward outlook
- Local home prices are declining (-3.0%/yr); year-one equity from $691 of loan paydown is wiped out by about $3k of value loss. Plan a longer hold.
- Callahan County population projected to shrink 5% by 2050 — rents likely to lag national; underwrite the cash flow, not the appreciation.
- At projected returns (-3.0% appreciation + 3.0% rent growth), your $28k cash investment doubles in ~4 years — after that, you're playing with house money.
Negotiation context
- It's been on market 42 days — a 3% lower offer ($97k) is reasonable based on typical stale-listing flexibility.
Risks & watch-outs
- Watch-outs: property tax is 2.7% of price; built in 1955 — expect roof / HVAC / electrical / plumbing capex.
Questions for the listing agent
- It's been on market 42 days. Have you received any prior offers? Is the seller open to a 3% concession, seller financing, or rate buy-down credit?
- Built in 1955 — when were the roof, HVAC, electrical panel, plumbing, and water heater last replaced?
- Property tax is high relative to price — has the assessment been appealed recently, and will the sale trigger a re-assessment?
- Is there a deadline driving the sale (1031 exchange, divorce, estate, relocation)? That informs how much negotiation room exists.
- What's the average days-on-market for RENTAL listings here right now (not sales)? A rising rental-DOM trend means longer vacancies and softer asking-rent achievability than the comps imply.
- What's the recent tenant-quality profile in this submarket — average credit score on applications, eviction rate, late-payment / NSF rate, and stable-employment percentage? A property-management company in the area should have these aggregated.
- How much new for-sale + rental construction is in the pipeline within 1–3 miles? Heavy new supply typically softens prices + rents 12–24 months out; constrained supply supports both.
Investment metrics
- 1% rule
- 1.98% ✓
- Cap rate
- 15.56%
- Cash-on-cash
- 33.10%
- DSCR
- 2.47
- GRM
- 4.2
CMA / ARV
- ARV (on-the-fly)
- $160,344
- Comps found
- 10
Show comp detail 10 sales within ~0.75 mi
| Address | Dist | Beds/Ba | Sqft | Sold | Price | $/sf | Match |
|---|---|---|---|---|---|---|---|
| 418 Pecan St | 0.00mi | 3/1.5 | 1,224 (0%) | 0mo | $99,900 | $82 | 100 |
| 504 Oak St | 0.17mi | 2/1.0 (-1) | 1,284 (+5%) | 0mo | $129,000 | $100 | 77 |
| 204 Bowie St | 0.34mi | 3/1.5 | 1,308 (+7%) | 9mo | $80,000 | $61 | 65 |
| 201 Pine St | 0.27mi | 3/2.0 | 1,280 (+5%) | 15mo | $199,000 | $155 | 65 |
| 741 Cherry Hts | 0.51mi | 3/2.0 | 1,244 (+2%) | 10mo | $195,000 | $157 | 63 |
| 214 Cherry St | 0.38mi | 3/1.0 | 1,256 (+3%) | 19mo | $39,900 | $32 | 60 |
| 402 Private Road 6210 | 0.28mi | 3/2.0 | 1,357 (+11%) | 10mo | $275,000 | $203 | 59 |
| 518 Reeves St | 0.33mi | 3/1.5 | 1,296 (+6%) | 22mo | $169,900 | $131 | 56 |
| 205 Field St | 0.68mi | 2/2.0 (-1) | 1,107 (-10%) | 2mo | $174,900 | $158 | 44 |
| 811 S 1st St W | 0.53mi | 3/2.0 | 1,092 (-11%) | 15mo | $127,500 | $117 | 43 |
Match score weights: distance 35% · size 25% · config 20% · recency 20%. Top-matched comps best support the ARV.
Projected returns pro-forma
-3.0% appreciation · 3.0% rent growth · sell at horizon
- IRR
- 28.3%
- Equity multiple
- 2.18×
- Total profit
- $33,050
- Equity at exit
- $14,895
- IRR
- 35.8%
- Equity multiple
- 4.30×
- Total profit
- $92,437
- Equity at exit
- $8,638
Cash invested: $27,972 (down + closing). Projections, not guarantees.
Landlord ↔ Tenant lean methodology
- Overall (STATE)
- 87 Strongly Landlord-Friendly
- State Texas
- 87 Strongly Landlord-Friendly · R+5
- County
- — inherits STATE
- City
- — inherits STATE
ZIP-level market 79510
- Home prices YoY
- -21.6%
- Active inventory
- 132
- Price-to-rent
- 4.2×
Monthly cashflow live
- Estimated rent
- $1,980 medium interval (Pro) →
- Mortgage (P&I)
- −$524
- Tax from tax record
- −$227 /mo · $2,725/yr
- Insurance
- −$42
- HOA
- −$0
- Vacancy / Maint / Mgmt
- −$416
- Net cashflow
- $772
Break-even live
UW: 25.0% down · 7.5% · 30yr · 1.5% tax · 5.0% vac · 8.0% maint · 8.0% mgmt
Financing live
Cash to close
- Down payment
- $24,975
- Closing costs
- $2,997
- Reserves months
- —
- Total cash needed
- —
Loan-product check · same deal, 3 products live
Conventional
25% down · 7.5% · 30yr
- Down + closing
- —
- Monthly P&I
- —
- Monthly cashflow
- —
- DSCR
- —
- Eligible?
- —
Personal DTI + credit; lowest rate.
DSCR
20% down · 8.5% · 30yr
- Down + closing
- —
- Monthly P&I
- —
- Monthly cashflow
- —
- DSCR
- —
- Eligible?
- —
No personal income docs; deal must DSCR.
Hard money
10% down · 12.0% · 12mo
- Down + closing
- —
- Monthly P&I
- —
- Monthly cashflow
- —
- DSCR
- —
- Eligible?
- —
Short-term bridge; refi at stabilization.
Rent comps 1 comps
| Address | Beds | Baths | Sqft | Rent | $/sqft | DOM | Units | Dist |
|---|---|---|---|---|---|---|---|---|
| 613 Marlin St Clyde, TX | 4.0 | 1.0 | 1218 | $1,980 | $1.63 | 21d | 1 | 0.84mi |
Listing history 2 events
-
2026-03-23status Pending
-
2026-02-06$99,900 Active
ⓘ Source: listings_history table (triggers on properties + properties_extension) + one-shot
backfill from property_details.listing_events for pre-trigger history.
Tax reassessment forecast TX · Resets to sale price
- Current annual tax
- $2,725 · $227/mo
- Projected year-2 tax
- $2,725 · $227/mo
- Expected delta
- $0/yr ($0/mo · 0.0%)
ⓘ Screening estimate from a state-policy table — verify with the county assessor before closing.
Nearby sold comps map
Loading sold comps map…
Walkable amenities ~0.75 mi
Loading nearby amenities…
Taxation est. · year 1
- Rental income
- $23,760
- − Mortgage interest
- −$5,596
- − Property taxes
- −$2,725
- − Insurance
- −$500
- − Repairs & maintenance
- −$1,901
- − Management
- −$1,901
- − Depreciation
- −$2,906
- Taxable income
- $8,232
- Est. tax owed @ 24.0%
- −$1,976
- After-tax cash flow
- $7,284/yr
For passive investors: Depreciation is non-cash, so a rental often shows a tax loss while cash-flowing — sheltering income. Rental losses are passive: they offset passive income freely, and up to $25,000/yr can offset ordinary (W-2) income if you actively participate and your MAGI is under $100k (phasing out to $0 by $150k); unused losses carry forward. On sale, claimed depreciation is recaptured at up to 25%, and gains may owe capital-gains tax (a 1031 exchange can defer both). Figures are a year-1 estimate at your 24.0% rate — not tax advice; consult a CPA.
Schools (NCES district)
- District
- Clyde CISD
- NCES district ID
- 4814450
- Math proficiency
- 42% ▼ -7.00%
- Reading proficiency
- 42% ▼ -2.00%
- Median HH income
- $46,614
- Composite
- 35.84/100
- National rank
- #4824
- State rank
- #341 of 826 in TX
Livability — Clyde
- Score
- 68/100
- State rank
- #498
- US rank
- #9935
Category grades
Schools grade is shown separately in the Schools card above.
Census & demographics
- Census place
- Clyde, TX
- Population (ZIP)
- 8,135
Population outlook (Callahan County) Hauer SSP2
- Today (2025)
- 13,664 people
- By 2030
- 13,578 · -0.6%
- By 2040
- 13,283 · -2.8%
- By 2050
- 13,008 · -4.8%
- By 2075
- 12,354 · -9.6%
- By 2100
- 11,326 · -17.1%
Race, ethnicity, and origin ACS 2023
- Neighborhood character
- Predominantly White (79%)
- Race & ethnicity
- White 79% Hispanic / Latino 13% Two or more races 12% Black 2%
- Hispanic origin (detail)
- Mexican 13%
- Common ancestry
- Italian 8% Slovak 3% Serbian 3%
- Foreign-born
- 1% · China
- Languages at home
- 93% English-only · Spanish 5% German/W. Germanic 2%
Political lean MEDSL · Callahan
- 2024 margin
- Solid R (+77.6) · D 10.9% · R 88.5%
- 2008→2024 swing
- -15.9pp toward R · 2008: -61.7pp · 2024: -77.6pp
- All cycles
- 2024: R+77.6 2020: R+77.3 2016: R+77.2 2012: R+69.8 2008: R+61.7
Not yet ingested
- Civics
- —
Market trends
- HPI YoY
- ▼ -51.42%
- Current HPI
- 186.6326
- Rent YoY
- —
- Metro
- —
- State GDP YoY
- ▲ 3.95%
- F500 in state
- 110
Industry mix (Fortune 500 HQ in TX)
| Industry | F500 HQs | Revenue |
|---|---|---|
| Energy | 16 | $1,198B |
|
||
| Technology | 5 | $198B |
|
||
| Engineering / Construction | 4 | $72B |
|
||
| Energy Services | 3 | $60B |
|
||
| Utilities | 3 | $41B |
|
||
| Healthcare | 2 | $330B |
|
||
Price history
2 events — show timeline
- 2026-03-23 Pending — NTREIS
- 2026-02-06 Listed $99,900 NTREIS
Property tax history
+7.7%/yrLatest (2025): $2,725 · +14.3% YoY. Source: county tax records.
Cash-flow waterfall
monthlySold comps — $/sqft
last 12 mo · ≤1 miLoading sold comps…