7400 Lakewood Dr · Oklahoma City, OK
Flood risk No data
- FEMA flood zone
- —
- Chance of flooding over 30 yrs
- —
- Est. flood insurance / yr
- —
Fire risk No data
- Est. fire insurance / yr
- —
Heat risk No data
- Hot days now (above threshold)
- —
- Hot days in 30 yrs
- —
Wind risk No data
- Chance of severe wind over 30 yrs
- —
Air-quality risk No data
- Unhealthy air days now
- —
- Unhealthy air days in 30 yrs
- —
Risk factors via First Street. Map © Google.
Why this score? — see what drove the F grade
The composite is a weighted blend of 9 inputs, each scored 0–100. Each bar is that input's sub-score; the figure is the points it added to the 100-point composite (weight × sub-score).
- ARV discount +7.5/15.0
- Cash flow +5.9/30.0
- Livability +4.0/5.0
- Condition / age +4.0/5.0
- Schools +3.1/10.0
- Rent growth +2.4/5.0
- 1% rule +0.5/10.0
- DSCR +0.3/10.0
- Appreciation +0.0/10.0
$274,900
🖨 Deal sheet 📄 Offer letter ✓ Due diligence
Listing remarks
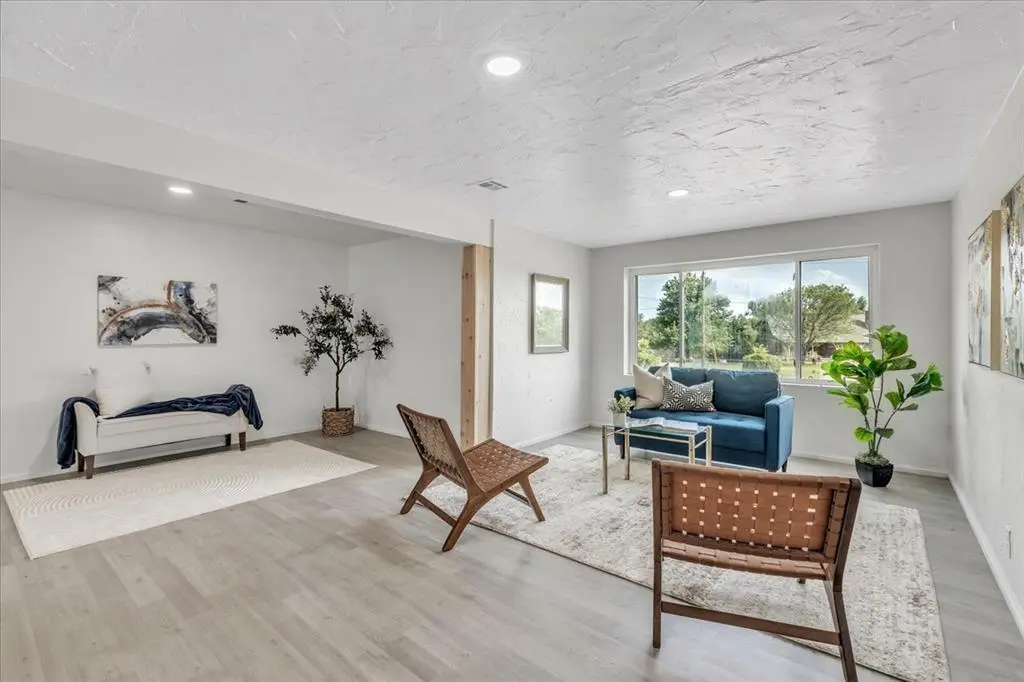
Get ready to fall in love with this charming 4 bed, 2 bath, home on a sprawling . 9 acre lot located in the desirable Mustang School District. This professionally remodeled country home boasts a beautiful open floor plan that wows you when you walk in the front door. As you step inside you’ll be welcomed by the beautiful living room filled with ample natural light that flows into the brand new kitchen. Enjoy the owners suite complete with a beautifully remodeled bathroom featuring a walk in shower and stylish details. Walk around the corner and you’ll be met with a large walk-in closet with ample space. The washer and dryer are conveniently located inside the large utility room.
Key facts
- Owners suite
- Open floor plan
- Remodeled bathroom
Tags
Property features AI
Finance
- Other: Vacant and unoccupied; Located in West Timberlake Estate; Directions: From Hwy 152, go south on Sara Rd. Turn west on E Lakeview Dr, then south on Lakewood Dr to property
- Financial info: Loan qualifying available; Not assumable
- HOA & community: No mandatory association dues
Exterior
- Parking: Gravel parking
- Utilities: Homestead exempt
- Home design: Single family residence; Residential property; Entry level: One
- Construction: Stucco construction; Composition roof; Slab foundation; Built as existing property
- Exterior features: Corner lot; Stable; Storage
Interior
- Bedrooms: 4 bedrooms
- Bathrooms: 2 full bathrooms
- Interior features: One-level living; Living area includes a single living area; No fireplace
Neighborhood map
What this means for you Summary
Snapshot
- This is a 2-bed/1.0-bath single-family listed at $275k. Condition is rated good.
Deal economics
- At list price, monthly cash flow is $-534 ($-6k/yr) — negative.
- To cash-flow at today's rent, offer at most $181k (34.3% below list).
- To meet the 1% rule (rent ≥ 1% of price), the offer needs to be $151k (45.0% below list).
- Recommended offer: $151k (45.0% below list) — sets the bar for 1% rule.
Location & tenants
- Location reads 80/100 on livability (#3 in OK, #1,635 nationally) — a professional / high-income tenant draw. Strengths: amenities A+, commute A+, cost of living A+; Watch: crime F.
- Mustang (suburban): math 35% / reading 33% proficiency, ranked #28 of 270 in OK (top 10%) — families likely to look elsewhere, expect single-tenant / working-renter base with shorter leases.
- Zoned schools: Mustang Lakehoma Es (math 48% / reading 40%, grade F, #73 of 845 statewide, top 9%, 673 students, 0% FRL); Mustang Hs (math 28% / reading 39%, grade F, #65 of 447 statewide, top 14%, 3,756 students, 0% FRL) — zoned schools average 0% FRL vs 28% district-wide (28 pts lower); this property's tenant base skews higher-income than the district average.
- Market conditions: Rents soft (-0.3%/yr); 512 active listings in the ZIP; solid renter incomes; 260 units permitted in Canadian County in 2024 (0 in 5+ unit buildings).
Forward outlook
- Local home prices are declining (-3.0%/yr); year-one equity from $2k of loan paydown is wiped out by about $8k of value loss. Plan a longer hold.
- Canadian County population projected at +64% by 2050 — long-run rental-demand tailwind backs the buy-and-hold thesis.
Negotiation context
- It's been on market 29 days — a 2% lower offer ($271k) is reasonable based on typical stale-listing flexibility.
- 3 sale attempts with the ask held roughly flat each time — persistent listings suggest the price (not the market) is what's stuck; bring a comps-based counter.
Questions for the listing agent
- What do current leases actually rent for vs. the listed asking? Can we see a recent rent roll and the last 12 months of T-12 income?
- Built in 1965 — when were the roof, HVAC, electrical panel, plumbing, and water heater last replaced?
- Is there a deadline driving the sale (1031 exchange, divorce, estate, relocation)? That informs how much negotiation room exists.
- Schools are F-rated, which usually means shorter tenancies and higher turnover. Who's the typical renter profile here, and what's been the actual vacancy rate?
- Crime grade is F in this area — have there been break-ins, vandalism, or insurance claims at this property in the last 3 years? What carrier currently insures it and at what premium?
- The area grade is low — what's the realistic commute time and amenity access for the typical tenant pool here? Any planned neighborhood developments (good or bad) we should know about?
- What's the average days-on-market for RENTAL listings here right now (not sales)? A rising rental-DOM trend means longer vacancies and softer asking-rent achievability than the comps imply.
- What's the recent tenant-quality profile in this submarket — average credit score on applications, eviction rate, late-payment / NSF rate, and stable-employment percentage? A property-management company in the area should have these aggregated.
- How much new for-sale + rental construction is in the pipeline within 1–3 miles? Heavy new supply typically softens prices + rents 12–24 months out; constrained supply supports both.
Investment metrics
- 1% rule
- 0.55% ✗
- Cap rate
- 3.96%
- Cash-on-cash
- -8.33%
- DSCR
- 0.63
- GRM
- 15.1
CMA / ARV
No comps found within radius.
Projected returns pro-forma
-3.0% appreciation · 0.0% rent growth · sell at horizon
- IRR
- -34.0%
- Equity multiple
- -0.08×
- Total profit
- $-83,095
- Equity at exit
- $40,988
- IRR
- -62.1%
- Equity multiple
- -0.74×
- Total profit
- $-133,651
- Equity at exit
- $23,768
Cash invested: $76,972 (down + closing). Projections, not guarantees.
Landlord ↔ Tenant lean methodology
- Overall (STATE)
- 83 Strongly Landlord-Friendly
- State Oklahoma
- 83 Strongly Landlord-Friendly · R+20
- County
- — inherits STATE
- City
- — inherits STATE
ZIP-level market 73064
- Home prices YoY
- -17.9%
- Rents YoY
- -0.3%
- Active inventory
- 512
- Price-to-rent
- 15.1×
Monthly cashflow live
- Estimated rent
- $1,513 medium interval (Pro) →
- Mortgage (P&I)
- −$1,442
- Tax from tax record
- −$174 /mo · $2,084/yr
- Insurance
- −$115
- HOA
- −$0
- Vacancy / Maint / Mgmt
- −$318
- Net cashflow
- $-534
Break-even live
UW: 25.0% down · 7.5% · 30yr · 1.5% tax · 5.0% vac · 8.0% maint · 8.0% mgmt
Financing live
Cash to close
- Down payment
- $68,725
- Closing costs
- $8,247
- Reserves months
- —
- Total cash needed
- —
Loan-product check · same deal, 3 products live
Conventional
25% down · 7.5% · 30yr
- Down + closing
- —
- Monthly P&I
- —
- Monthly cashflow
- —
- DSCR
- —
- Eligible?
- —
Personal DTI + credit; lowest rate.
DSCR
20% down · 8.5% · 30yr
- Down + closing
- —
- Monthly P&I
- —
- Monthly cashflow
- —
- DSCR
- —
- Eligible?
- —
No personal income docs; deal must DSCR.
Hard money
10% down · 12.0% · 12mo
- Down + closing
- —
- Monthly P&I
- —
- Monthly cashflow
- —
- DSCR
- —
- Eligible?
- —
Short-term bridge; refi at stabilization.
Listing history 19 events
-
2026-06-18days on market $274,900 Active 29 DOM
-
2026-06-17days on market $274,900 Active 28 DOM
-
2026-06-16days on market $274,900 Active 27 DOM
-
2026-06-15days on market $274,900 Active 26 DOM
-
2026-06-13days on market $274,900 Active 24 DOM
-
2026-06-09days on market $274,900 Active 20 DOM
-
2026-06-08days on market $274,900 Active 19 DOM
-
2026-06-07days on market $274,900 Active 18 DOM
-
2026-06-05days on market $274,900 Active 15 DOM
-
2026-06-03days on market $274,900 Active 14 DOM
-
2026-06-02days on market $274,900 Active 13 DOM
-
2026-06-01days on market $274,900 Active 12 DOM
-
2026-05-31days on market $274,900 Active 11 DOM
-
2026-05-18$274,900 Active
-
2026-04-21historical
-
2026-04-01price $274,900
-
2026-04-01status Active
-
2026-03-21status Pending
-
2025-10-15$280,000 Active
ⓘ Source: listings_history table (triggers on properties + properties_extension) + one-shot
backfill from property_details.listing_events for pre-trigger history.
Tax reassessment forecast OK · Resets to sale price
- Current annual tax
- $2,084 · $174/mo
- Projected year-2 tax
- $2,474 · $206/mo
- Expected delta
- +$390/yr (+$33/mo · 18.7%)
ⓘ Screening estimate from a state-policy table — verify with the county assessor before closing.
Nearby sold comps map
Loading sold comps map…
Walkable amenities ~0.75 mi
Loading nearby amenities…
Taxation est. · year 1
- Rental income
- $18,159
- − Mortgage interest
- −$15,399
- − Property taxes
- −$2,084
- − Insurance
- −$1,374
- − Repairs & maintenance
- −$1,453
- − Management
- −$1,453
- − Depreciation
- −$7,997
- Taxable loss
- −$11,601
- Est. tax savings @ 24.0%
- +$2,784
- After-tax cash flow
- $-3,628/yr
For passive investors: Depreciation is non-cash, so a rental often shows a tax loss while cash-flowing — sheltering income. Rental losses are passive: they offset passive income freely, and up to $25,000/yr can offset ordinary (W-2) income if you actively participate and your MAGI is under $100k (phasing out to $0 by $150k); unused losses carry forward. On sale, claimed depreciation is recaptured at up to 25%, and gains may owe capital-gains tax (a 1031 exchange can defer both). Figures are a year-1 estimate at your 24.0% rate — not tax advice; consult a CPA.
Condition & rehab AI · 12 photos
This charming 4-bedroom, 2-bathroom home on a spacious 0.9-acre lot is in excellent condition with modern updates and a fresh paint job. The property is move-in ready and offers a great opportunity for investors looking to capitalize on its location and potential for further improvements.
Value-add opportunities
- Both landscaping — improve curb appeal and increase property value
- Both install new outdoor lighting — enhance safety and curb appeal
Renovation cost estimate screening
Value-add ROI direction
- Both landscaping — improve curb appeal and increase property value ↑
- Both install new outdoor lighting — enhance safety and curb appeal ↑
ⓘ Cost ranges are severity-bucket heuristics (US national rule-of-thumb). Get contractor quotes + a written scope before underwriting a rehab budget.
Schools (NCES district)
- District
- Mustang
- NCES district ID
- 4021000
- Math proficiency
- 35% ▼ -10.00%
- Reading proficiency
- 33% ▼ -7.00%
- Median HH income
- $67,559
- Composite
- 31.21/100
- National rank
- #6038
- State rank
- #28 of 270 in OK
Livability — Oklahoma City
- Score
- 80/100
- State rank
- #3
- US rank
- #1635
Category grades
Schools grade is shown separately in the Schools card above.
Census & demographics
- Census place
- Oklahoma City, OK
- County
- Canadian County · 154,341 people
- City population
- 498,656
- Metro
- Oklahoma City, OK
- Population (ZIP)
- 28,919
- Household income
- $94,402
- Rent vs Own
- Severe rent burden
- 384.0
Population outlook (Canadian County) Hauer SSP2
- Today (2025)
- 174,062 people
- By 2030
- 195,170 · +12.1%
- By 2040
- 239,293 · +37.5%
- By 2050
- 285,457 · +64.0%
- By 2075
- 403,766 · +132.0%
- By 2100
- 498,766 · +186.5%
Race, ethnicity, and origin ACS 2023
- Neighborhood character
- Predominantly White (74%)
- Race & ethnicity
- White 74% Two or more races 11% Hispanic / Latino 10% Native American 3% Black 3% Asian 2%
- Hispanic origin (detail)
- Mexican 8%
- Common ancestry
- Italian 2% Scottish 2% Slovak 2%
- Foreign-born
- 4% · Canada, Vietnam
- Languages at home
- 93% English-only · Spanish 5% Other Indo-European 1% Tagalog/Filipino 1%
Political lean MEDSL · Canadian
- 2024 margin
- Solid R (+40.4) · D 28.8% · R 69.2% · Other 2.0%
- 2008→2024 swing
- +11.9pp toward D · 2008: -52.2pp · 2024: -40.4pp
- All cycles
- 2024: R+40.4 2020: R+43.3 2016: R+51.2 2012: R+54.4 2008: R+52.2
Not yet ingested
- Civics
- —
Market trends
- HPI YoY
- ▼ -56.66%
- Current HPI
- 260.2863
- Rent YoY
- ▼ -0.33%
- Metro
- Oklahoma City, OK
- State GDP YoY
- ▲ 1.55%
- F500 in state
- 6
Industry mix (Fortune 500 HQ in OK)
| Industry | F500 HQs | Revenue |
|---|---|---|
| Energy | 3 | $48B |
|
||
Price history
-1.8% since first listed6 events — show timeline
- 2026-05-18 Listed $274,900 MLSOK
- 2026-04-21 Listing Removed — MLSOK
- 2026-04-01 Price Changed $274,900 MLSOK
- 2026-04-01 Relisted — MLSOK
- 2026-03-21 Pending — MLSOK
- 2025-10-15 Listed $280,000 MLSOK
Property tax history
-4.1%/yrLatest (2025): $2,084 · -4.1% YoY. Source: county tax records.
Cash-flow waterfall
monthlySold comps — $/sqft
last 12 mo · ≤1 miLoading sold comps…