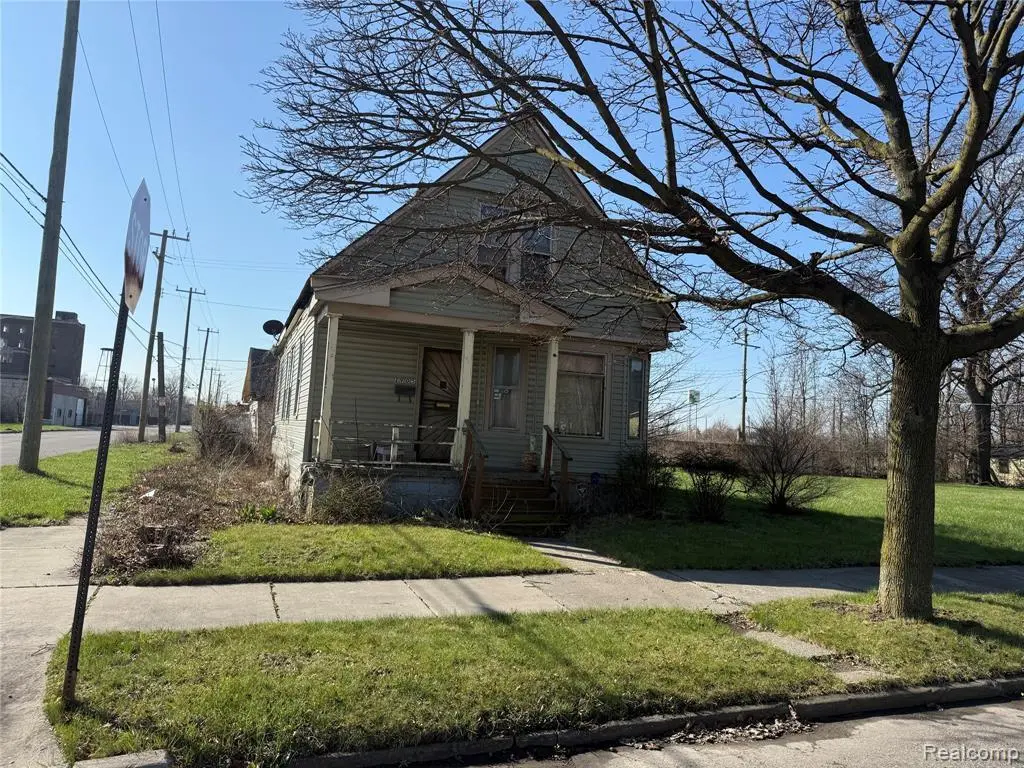
2905 Putnam St · Detroit, MI
Flood risk 1/10 · Minimal
- FEMA flood zone
- X (unshaded)
- Chance of flooding over 30 yrs
- 0.0%
- Est. flood insurance / yr
- $507 – $1,088
Fire risk 1/10 · Minimal
- Est. fire insurance / yr
- $784 – $1,456
Heat risk 3/10 · Minor
- Hot days now (above 97°F)
- 7 days/yr
- Hot days in 30 yrs
- 15 days/yr
Wind risk 2/10 · Minimal
- Chance of severe wind over 30 yrs
- —
Air-quality risk 4/10 · Minor
- Unhealthy air days now
- 6 days/yr
- Unhealthy air days in 30 yrs
- 8 days/yr
Risk factors via First Street. Map © Google.
Why this score? — see what drove the B grade
The composite is a weighted blend of 9 inputs, each scored 0–100. Each bar is that input's sub-score; the figure is the points it added to the 100-point composite (weight × sub-score).
- Cash flow +30.0/30.0
- ARV discount +12.6/15.0
- 1% rule +10.0/10.0
- DSCR +10.0/10.0
- Livability +3.7/5.0
- Rent growth +2.5/5.0
- Condition / age +2.5/5.0
- Schools +1.3/10.0
- Appreciation +0.0/10.0
$60,000
🖨 Deal sheet 📄 Offer letter ✓ Due diligence
Listing remarks MLS
Frame house in Core city that needs a full rehab. Great location, close to Downtown, Corktown. This would be a great project home for an investor or owner occupant. Sold AS IS BATVAI
Key facts
- Corktown
- Close to downtown
- 3,049 sq ft lot
Tags
Property features AI
Exterior
- Parking: Detached 2-car garage
- Utilities: Sewer available; Water available
- Home design: Single-family residence; Two levels; Entry at lower level with steps; Vinyl siding
- Construction: Vinyl siding construction
- Exterior features: Paved road access; Lot approximately 0.07 acres (30 x 98.51)
Interior
- Bathrooms: 1 full bathroom
- Heating & cooling: Natural gas heating; Wall furnace; No central cooling
- Interior features: Crawl space basement; Total of 4 rooms
Neighborhood map
What this means for you Summary
Snapshot
- This is a 3-bed/1.0-bath single-family listed at $60k.
Deal economics
- At list price, monthly cash flow is $795 ($10k/yr) — positive.
- The deal already cash-flows at list — no discount required.
- Meets the 1% rule at list price ($2k rent vs $60k).
- Recommended offer: $58k (3.0% below list) — sets the bar for market timing.
- Cap rate 22.2% vs local median 10.2% in Detroit — top-decile yield for the area; either an underpriced asset or a hidden risk that comps aren't pricing in. Stress-test before assuming the spread holds.
Location & tenants
- Location reads 73/100 on livability (#218 in MI) — a middle-class / working-renter tenant base. Strengths: amenities A+, commute A+, cost of living A+; Watch: schools F, crime F, employment F.
- Detroit Public Schools Community District (urban): math 10% / reading 24% proficiency, ranked #499 of 540 in MI (top 92%) — low school quality limits family demand, transient renter base, plan for 1-2y turnover; 90% free/reduced lunch — lower-income household profile, screen leases tightly.
- Market conditions: 184 active listings in the ZIP; 39 comparable units currently listed for rent nearby; rentals lingering (median 44d on market — plan ~5-8 weeks vacancy on turnover, expect pricing pressure); 51% of comp listings sitting > 30 days — soft ceiling on asking rent; lower-income renter base — watch delinquency; 2,639 units permitted in Wayne County in 2024 (1,216 in 5+ unit buildings).
- At $1,687/mo this rent would consume 56% of the median local household income ($36k/yr) (locally 601% of renters already pay >50% of income on rent) — very limited rent-growth headroom before tenants either downsize or default.
Forward outlook
- Local home prices are declining (-3.0%/yr); year-one equity from $415 of loan paydown is wiped out by about $2k of value loss. Plan a longer hold.
- Wayne County population projected at -17% by 2050 — secular population decline; favor cash flow + early exit over multi-decade hold.
- At projected returns (-3.0% appreciation + 3.0% rent growth), your $17k cash investment doubles in ~2 years — after that, you're playing with house money.
Negotiation context
- It's been on market 52 days — a 3% lower offer ($58k) is reasonable based on typical stale-listing flexibility.
- 3 sale attempts with the ask held roughly flat each time — persistent listings suggest the price (not the market) is what's stuck; bring a comps-based counter.
- Current owner paid $50k; 20% above their basis — modest negotiation headroom, anchor on the comps not their cost.
Risks & watch-outs
- Watch-outs: property tax is 4.0% of price; built in 1909 — expect roof / HVAC / electrical / plumbing capex.
Questions for the listing agent
- It's been on market 52 days. Have you received any prior offers? Is the seller open to a 3% concession, seller financing, or rate buy-down credit?
- Built in 1909 — when were the roof, HVAC, electrical panel, plumbing, and water heater last replaced?
- Property tax is high relative to price — has the assessment been appealed recently, and will the sale trigger a re-assessment?
- Is there a deadline driving the sale (1031 exchange, divorce, estate, relocation)? That informs how much negotiation room exists.
- Schools are F-rated, which usually means shorter tenancies and higher turnover. Who's the typical renter profile here, and what's been the actual vacancy rate?
- Crime grade is F in this area — have there been break-ins, vandalism, or insurance claims at this property in the last 3 years? What carrier currently insures it and at what premium?
- What's the average days-on-market for RENTAL listings here right now (not sales)? A rising rental-DOM trend means longer vacancies and softer asking-rent achievability than the comps imply.
- What's the recent tenant-quality profile in this submarket — average credit score on applications, eviction rate, late-payment / NSF rate, and stable-employment percentage? A property-management company in the area should have these aggregated.
- How much new for-sale + rental construction is in the pipeline within 1–3 miles? Heavy new supply typically softens prices + rents 12–24 months out; constrained supply supports both.
Investment metrics
- 1% rule
- 2.81% ✓
- Cap rate
- 22.20%
- Cash-on-cash
- 56.80%
- DSCR
- 3.53
- GRM
- 3.0
CMA / ARV
- ARV (median comp)
- $67,700
- List price
- $60,000
- Delta
- -11.37%
- Verdict
- UNDERPRICED
- Comps
- 20 within 1.0 mi
Show comp detail 8 sales within ~0.75 mi
| Address | Dist | Beds/Ba | Sqft | Sold | Price | $/sf | Match |
|---|---|---|---|---|---|---|---|
| 5261 24th St | 0.37mi | 3/1.0 | 1,132 (+2%) | 12mo | $87,000 | $77 | 69 |
| 6419 Roosevelt St | 0.64mi | 3/1.0 | 1,143 (+3%) | 1mo | $15,000 | $13 | 64 |
| 5043 Rosa Parks Blvd | 0.64mi | 3/1.0 | 1,100 (-0%) | 9mo | $124,900 | $114 | 62 |
| 3532 Moore Pl Pl | 0.61mi | 3/1.5 | 1,181 (+7%) | 1mo | $12,000 | $10 | 57 |
| 6080 16th St | 0.71mi | 3/1.0 | 1,160 (+5%) | 23mo | $119,000 | $103 | 39 |
| 6050 16th St | 0.69mi | 2/2.0 (-1) | 1,086 (-2%) | 23mo | $265,000 | $244 | 37 |
| 3722 Tillman St | 0.74mi | 4/1.0 (+1) | 1,150 (+4%) | 22mo | $85,000 | $74 | 35 |
| 2681 Nebraska St | 0.71mi | 4/2.5 (+1) | 1,238 (+12%) | 20mo | $189,700 | $153 | 19 |
Match score weights: distance 35% · size 25% · config 20% · recency 20%. Top-matched comps best support the ARV.
Projected returns pro-forma
-3.0% appreciation · 3.0% rent growth · sell at horizon
- IRR
- 55.3%
- Equity multiple
- 3.44×
- Total profit
- $41,028
- Equity at exit
- $8,946
- IRR
- 60.4%
- Equity multiple
- 7.03×
- Total profit
- $101,356
- Equity at exit
- $5,188
Cash invested: $16,800 (down + closing). Projections, not guarantees.
Landlord ↔ Tenant lean methodology
- Overall (STATE)
- 62 Landlord-Friendly
- State Michigan
- 62 Landlord-Friendly · EVEN
- County
- — inherits STATE
- City
- — inherits STATE
ZIP-level market 48208
- Home prices YoY
- -5.9%
- Active inventory
- 184
- Price-to-rent
- 3.0×
Monthly cashflow live
- Estimated rent
- $1,687 high interval (Pro) →
- Mortgage (P&I)
- −$315
- Tax from tax record
- −$198 /mo · $2,370/yr
- Insurance
- −$25
- HOA
- −$0
- Vacancy / Maint / Mgmt
- −$354
- Net cashflow
- $795
Break-even live
UW: 25.0% down · 7.5% · 30yr · 1.5% tax · 5.0% vac · 8.0% maint · 8.0% mgmt
Financing live
Cash to close
- Down payment
- $15,000
- Closing costs
- $1,800
- Reserves months
- —
- Total cash needed
- —
Loan-product check · same deal, 3 products live
Conventional
25% down · 7.5% · 30yr
- Down + closing
- —
- Monthly P&I
- —
- Monthly cashflow
- —
- DSCR
- —
- Eligible?
- —
Personal DTI + credit; lowest rate.
DSCR
20% down · 8.5% · 30yr
- Down + closing
- —
- Monthly P&I
- —
- Monthly cashflow
- —
- DSCR
- —
- Eligible?
- —
No personal income docs; deal must DSCR.
Hard money
10% down · 12.0% · 12mo
- Down + closing
- —
- Monthly P&I
- —
- Monthly cashflow
- —
- DSCR
- —
- Eligible?
- —
Short-term bridge; refi at stabilization.
Rent comps 39 comps
| Address | Beds | Baths | Sqft | Rent | $/sqft | DOM | Units | Dist |
|---|---|---|---|---|---|---|---|---|
| 4619 16th St Detroit, MI | 3.0 | 1.0 | 1100 | $1,250 | $1.14 | 3d | 1 | 0.39mi |
| 6077 Linwood St Detroit, MI | 2.0 | 1.0 | 1200 | $2,000 | $1.67 | 43d | 1 | 0.63mi |
| 3998 15th St Unit 1 Detroit, MI | 2.0 | 1.0 | 1200 | $1,300 | $1.08 | 43d | 1 | 0.64mi |
| 1493 W Grand Blvd Detroit, MI | 2.0 | 1.0 | 1250 | $1,145 | $0.92 | 43d | 1 | 0.71mi |
| 1565 W Grand Blvd Unit 1 Detroit, MI | 2.0 | 1.0 | 910 | $700 | $0.77 | 24d | 1 | 0.73mi |
| 1565 W Grand Blvd Unit 1 Detroit, MI | 2.0 | 1.0 | 910 | $700 | $0.77 | 22d | 1 | 0.73mi |
| 6144 16th St Detroit, MI | 3.0 | 1.0 | 1284 | $1,200 | $0.93 | 43d | 1 | 0.78mi |
| 4848 Commonwealth St Unit 4 Detroit, MI | 2.0 | 1.0 | 710 | $1,245 | $1.75 | 43d | 1 | 0.83mi |
| 3984 Commonwealth St Unit B Detroit, MI | 3.0 | 2.0 | 1100 | $2,400 | $2.18 | 24d | 1 | 1.00mi |
| 6183 Hecla St Detroit, MI | 3.0 | 1.0 | 1100 | $1,700 | $1.55 | 24d | 1 | 1.02mi |
| 3309 14th St Detroit, MI | 1.0–3.0 | 1.0–2.5 | 942 | $2,230 | $2.37 | 1d | 11 | 1.02mi |
| 4426 McGraw Ave Unit 1 Detroit, MI | 3.0 | 1.0 | 1400 | $1,200 | $0.86 | 43d | 1 | 1.03mi |
| 2835 23rd St Unit 2 Detroit, MI | 3.0 | 2.0 | 1100 | $1,450 | $1.32 | 16d | 1 | 1.13mi |
| 6307 Woodrow St Detroit, MI | 2.0 | 1.0 | 1000 | $750 | $0.75 | 43d | 1 | 1.19mi |
| 4016 Hogarth St Unit 4018 Hogarth Lower Detroit, MI | 2.0 | 1.0 | 1200 | $1,100 | $0.92 | 3d | 1 | 1.20mi |
| 7340 Churchill St Unit 2 Detroit, MI | 2.0 | 1.0 | 1046 | $1,100 | $1.05 | 24d | 1 | 1.20mi |
| 3143 Trumbull Unit 301 Detroit, MI | 2.0 | 1.0 | 1000 | $1,650 | $1.65 | 22d | 1 | 1.29mi |
| 1800 W Bethune St Unit 1228665P Detroit, MI | 2.0 | 1.0 | 904 | $3,135 | $3.47 | 43d | 1 | 1.30mi |
| 1800 W Bethune St Detroit, MI | 2.0 | 1.0 | 800 | $1,850 | $2.31 | 43d | 1 | 1.30mi |
| 1800 W Bethune St Detroit, MI | 2.0 | 1.0 | 656 | $1,645 | $2.51 | 24d | 3 | 1.30mi |
| 944 W Alexandrine St Unit 1 Detroit, MI | 3.0 | 1.0 | 1100 | $1,950 | $1.77 | 43d | 1 | 1.31mi |
| 4566 Seebaldt St Detroit, MI | 2.0 | 1.0 | 1200 | $1,250 | $1.04 | 22d | 1 | 1.31mi |
| 7640 Woodrow Wilson St Unit 1 Detroit, MI | 3.0 | 1.5 | 1095 | $1,400 | $1.28 | 43d | 1 | 1.37mi |
| 2047 Seward St Detroit, MI | 3.0 | 1.0 | 1421 | $1,523 | $1.07 | 5d | 1 | 1.38mi |
| 701 W Canfield St Unit 1 Detroit, MI | 2.0 | 1.5 | 1144 | $3,250 | $2.84 | 43d | 1 | 1.38mi |
| 701 W Canfield St Unit 4 Detroit, MI | 2.0 | 1.5 | 1094 | $3,000 | $2.74 | 43d | 1 | 1.38mi |
| 2732 Harrison St Detroit, MI | 2.0 | 2.5 | 1320 | $2,750 | $2.08 | 43d | 1 | 1.40mi |
| 677 W Canfield St Detroit, MI | 2.0 | 1.5 | 1200 | $2,750 | $2.29 | 17d | 1 | 1.40mi |
| 669 W Canfield St Unit 2 Detroit, MI | 2.0 | 2.0 | 1500 | $2,400 | $1.60 | 43d | 1 | 1.41mi |
| 4709 2nd Ave Detroit, MI | 1.0–2.0 | 1.0 | 672 | $1,350 | $2.01 | 2d | 2 | 1.43mi |
| 675 W Willis St Detroit, MI | 1.0–3.0 | 1.0 | 631 | $1,695 | $2.69 | 2d | 4 | 1.43mi |
| 711 W Alexandrine St Detroit, MI | 1.0–2.0 | 1.0–1.5 | 742 | $1,840 | $2.48 | 5d | 4 | 1.44mi |
| 2504 W Euclid St Unit 2504 Detroit, MI | 3.0 | 1.0 | 1475 | $1,650 | $1.12 | 43d | 1 | 1.44mi |
| 2506 W Euclid St Detroit, MI | 3.0 | 1.0 | 1475 | $1,675 | $1.14 | 43d | 1 | 1.45mi |
| 2504 W Euclid St Unit 2506 Detroit, MI | 3.0 | 1.0 | 1475 | $1,675 | $1.14 | 43d | 1 | 1.45mi |
| 640 W Willis St Detroit, MI | 1.0–2.0 | 1.0 | 1037 | $1,750 | $1.69 | 5d | 10 | 1.45mi |
| 5440 Milford St Unit 1 Detroit, MI | 2.0 | 1.0 | 850 | $1,150 | $1.35 | 43d | 1 | 1.46mi |
| 3259 W Philadelphia St Detroit, MI | 3.0 | 1.0 | 1293 | $1,400 | $1.08 | 16d | 1 | 1.47mi |
| 1974 Virginia Park St Detroit, MI | 2.0 | 2.0 | 1200 | $1,995 | $1.66 | 43d | 1 | 1.49mi |
Listing history 16 events
-
2026-06-18days on market $60,000 Active 52 DOM
-
2026-06-17days on market $60,000 Active 51 DOM
-
2026-06-15days on market $60,000 Active 49 DOM
-
2026-06-13days on market $60,000 Active 47 DOM
-
2026-06-13days on market $60,000 Active 46 DOM
-
2026-06-09days on market $60,000 Active 43 DOM
-
2026-06-08days on market $60,000 Active 42 DOM
-
2026-06-07days on market $60,000 Active 41 DOM
-
2026-06-04days on market $60,000 Active 38 DOM
-
2026-06-03days on market $60,000 Active 37 DOM
-
2026-06-02days on market $60,000 Active 36 DOM
-
2026-06-01days on market $60,000 Active 35 DOM
-
2026-05-31days on market $60,000 Active 34 DOM
-
2026-04-27$60,000 Active 182-char remark
Show marketing remark (182 chars)
Frame house in Core city that needs a full rehab. Great location, close to Downtown, Corktown. This would be a great project home for an investor or owner occupant. Sold AS IS BATVAI
-
2026-04-27$60,000 Active 182-char remark
Show marketing remark (182 chars)
Frame house in Core city that needs a full rehab. Great location, close to Downtown, Corktown. This would be a great project home for an investor or owner occupant. Sold AS IS BATVAI
-
2019-04-05soldstatus $50,000
ⓘ Source: listings_history table (triggers on properties + properties_extension) + one-shot
backfill from property_details.listing_events for pre-trigger history.
Tax reassessment forecast MI · Partial reset (capped growth)
- Current annual tax
- $2,370 · $198/mo
- Projected year-2 tax
- $2,370 · $198/mo
- Expected delta
- $0/yr ($0/mo · 0.0%)
ⓘ Screening estimate from a state-policy table — verify with the county assessor before closing.
Climate risk First Street
- Flood 1/10 Low FEMA zone X (unshaded) · 0% chance over 30 yrs
- Wildfire 1/10 Low
- Heat 3/10 Moderate 7 d/yr ≥97°F today · 15 d/yr by 30 yrs out
- Wind 2/10 Low
- Air quality 4/10 Moderate 6 unhealthy d/yr today · 8 by 30 yrs out
Nearby sold comps map
Loading sold comps map…
Walkable amenities ~0.75 mi
Loading nearby amenities…
Taxation est. · year 1
- Rental income
- $20,239
- − Mortgage interest
- −$3,361
- − Property taxes
- −$2,370
- − Insurance
- −$300
- − Repairs & maintenance
- −$1,619
- − Management
- −$1,619
- − Depreciation
- −$1,745
- Taxable income
- $9,224
- Est. tax owed @ 24.0%
- −$2,214
- After-tax cash flow
- $7,329/yr
For passive investors: Depreciation is non-cash, so a rental often shows a tax loss while cash-flowing — sheltering income. Rental losses are passive: they offset passive income freely, and up to $25,000/yr can offset ordinary (W-2) income if you actively participate and your MAGI is under $100k (phasing out to $0 by $150k); unused losses carry forward. On sale, claimed depreciation is recaptured at up to 25%, and gains may owe capital-gains tax (a 1031 exchange can defer both). Figures are a year-1 estimate at your 24.0% rate — not tax advice; consult a CPA.
Schools (NCES district)
- District
- Detroit Public Schools Community District
- NCES district ID
- 2601103
- Math proficiency
- 10% ▼ -2.00%
- Reading proficiency
- 24% ▲ 6.00%
- Median HH income
- $25,815
- Composite
- 13.06/100
- National rank
- #9564
- State rank
- #499 of 540 in MI
Livability — Detroit
- Score
- 73/100
- State rank
- #218
- US rank
- #5427
Category grades
Schools grade is shown separately in the Schools card above.
Census & demographics
- Census place
- Detroit, MI
- County
- Wayne County · 1,562,939 people
- City population
- 572,865
- Metro
- Detroit-Warren-Dearborn, MI
- Population (ZIP)
- 8,037
- Household income
- $36,194
- Rent vs Own
- Severe rent burden
- 601.0
Population outlook (Wayne County) Hauer SSP2
- Today (2025)
- 1,675,273 people
- By 2030
- 1,620,300 · -3.3%
- By 2040
- 1,502,341 · -10.3%
- By 2050
- 1,384,039 · -17.4%
- By 2075
- 1,124,592 · -32.9%
- By 2100
- 881,193 · -47.4%
Race, ethnicity, and origin ACS 2023
- Neighborhood character
- Predominantly Black (66%)
- Race & ethnicity
- Black 66% White 23% Two or more races 7% Hispanic / Latino 6% Asian 1%
- Hispanic origin (detail)
- Mexican 3% Puerto Rican 1%
- Common ancestry
- Romanian 3% Lithuanian 1% Slovak 1%
- Foreign-born
- 2% · Canada
- Languages at home
- 94% English-only · Spanish 5% Arabic 1%
Political lean MEDSL · Wayne
- 2024 margin
- Strong D (+29.0) · D 62.7% · R 33.7% · Other 3.6%
- 2008→2024 swing
- -20.5pp toward R · 2008: 49.5pp · 2024: 29.0pp
- All cycles
- 2024: D+29.0 2020: D+38.1 2016: D+37.3 2012: D+46.9 2008: D+49.5
Not yet ingested
- Civics
- —
Market trends
- HPI YoY
- ▼ -10.56%
- Current HPI
- 168.8907
- Rent YoY
- —
- Metro
- Detroit-Warren-Dearborn, MI
- State GDP YoY
- ▲ 1.37%
- F500 in state
- 28
Industry mix (Fortune 500 HQ in MI)
| Industry | F500 HQs | Revenue |
|---|---|---|
| Automotive Parts | 3 | $48B |
|
||
| Automotive | 2 | $372B |
|
||
| Chemicals | 1 | $45B |
|
||
| Automotive Retail | 1 | $29B |
|
||
| Healthcare / Medical Devices | 1 | $23B |
|
||
| Automotive Technology | 1 | $20B |
|
||
Price history
+20.0% since first listed5 events — show timeline
- 2026-05-28 Relisted — REALCOMP
- 2026-05-27 Listing Removed — REALCOMP
- 2026-04-27 Listed $60,000 REALCOMP
- 2026-04-27 Listed $60,000 MiRealSource-MiMLS
- 2019-04-05 Sold (Public Records) $50,000 Public Records
Property tax history
+13.8%/yrLatest (2025): $2,370 · +72.7% YoY. Source: county tax records.
Cash-flow waterfall
monthlySold comps — $/sqft
last 12 mo · ≤1 miLoading sold comps…