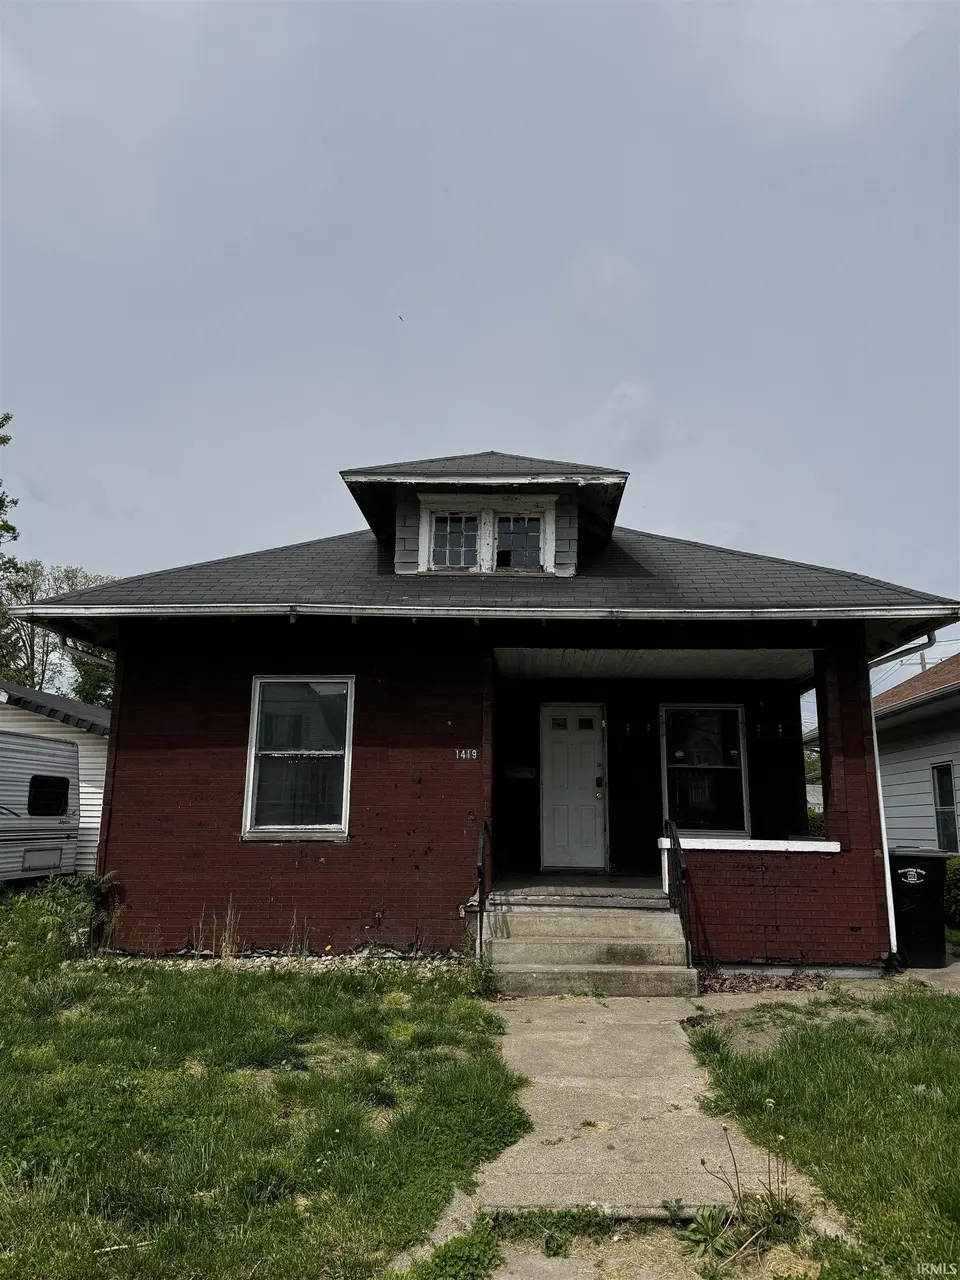
1419 Marine St · South Bend, IN
Flood risk 1/10 · Minimal
- FEMA flood zone
- X (unshaded)
- Chance of flooding over 30 yrs
- 0.0%
- Est. flood insurance / yr
- $507 – $1,088
Fire risk 1/10 · Minimal
- Est. fire insurance / yr
- $717 – $1,331
Heat risk 3/10 · Minor
- Hot days now (above 99°F)
- 7 days/yr
- Hot days in 30 yrs
- 16 days/yr
Wind risk 2/10 · Minimal
- Chance of severe wind over 30 yrs
- —
Air-quality risk 3/10 · Minor
- Unhealthy air days now
- 2 days/yr
- Unhealthy air days in 30 yrs
- 3 days/yr
Risk factors via First Street. Map © Google.
Why this score? — see what drove the B- grade
The composite is a weighted blend of 9 inputs, each scored 0–100. Each bar is that input's sub-score; the figure is the points it added to the 100-point composite (weight × sub-score).
- Cash flow +26.9/30.0
- ARV discount +12.9/15.0
- DSCR +9.3/10.0
- 1% rule +7.0/10.0
- Livability +3.2/5.0
- Rent growth +2.5/5.0
- Condition / age +2.5/5.0
- Schools +1.4/10.0
- Appreciation +0.0/10.0
$79,900
🖨 Deal sheet 📄 Offer letter ✓ Due diligence
Listing remarks
Great investment opportunity in South Bend! 2 bed, 1 bathroom. Wood floors, newer roof - check it out and make your offer today!
Key facts
- 3,485 sq ft lot
- Built 1902
- Listed 31 days
Property features AI
Finance
- Other:
- Financial info:
- HOA & community:
Exterior
- Parking:
- Security:
- Utilities: Public water; Public sewer
- Home design: Single-family residential; Site-built home; One story
- Construction: Shingle siding; Asphalt roof; Concrete perimeter foundation; Above-grade finished area of 864
- Exterior features: Wood fencing; Shed(s)
Interior
- Kitchen:
- Bedrooms: Total of 6 rooms (bedroom count not specified)
- Flooring: Hardwood
- Bathrooms: 1 full bathroom (main level)
- Heating & cooling: Central air conditioning
- Interior features: Hardwood flooring; Partial, unfinished basement
- Laundry & utility: Laundry located in basement
Neighborhood map
What this means for you Summary
Snapshot
- This is a 2-bed/1.0-bath single-family listed at $80k.
Deal economics
- At list price, monthly cash flow is $222 ($3k/yr) — positive.
- The deal already cash-flows at list — no discount required.
- Meets the 1% rule at list price ($961 rent vs $80k).
- Recommended offer: $78k (3.0% below list) — sets the bar for market timing.
- Cap rate 9.6% vs local median 4.4% in South Bend — top-decile yield for the area; either an underpriced asset or a hidden risk that comps aren't pricing in. Stress-test before assuming the spread holds.
Location & tenants
- Location reads 64/100 on livability (#365 in IN) — a middle-class / working-renter tenant base. Strengths: cost of living A+, housing A+, health & safety A+; Watch: amenities D, employment D, crime F.
- South Bend Community School Corporation (urban): math 12% / reading 21% proficiency, ranked #284 of 301 in IN (top 94%) — low school quality limits family demand, transient renter base, plan for 1-2y turnover; 66% free/reduced lunch — lower-income household profile, screen leases tightly.
- Zoned schools: Lincoln Elementary School (math 7% / reading 6%, grade F, #964 of 994 statewide, top 97%, 467 students, 86% FRL); Jackson Middle School (math 3% / reading 8%, grade F, #326 of 330 statewide, top 99%, 528 students, 82% FRL); Riley High School (math 19% / reading 46%, grade F, #293 of 369 statewide, top 80%, 992 students, 67% FRL).
- Market conditions: 32 active listings in the ZIP; 24 comparable units currently listed for rent nearby; rentals at typical pace (median 21d on market — plan ~3-4 weeks tenant-placement turnaround); 754 units permitted in St. Joseph County in 2024 (460 in 5+ unit buildings).
Forward outlook
- Local home prices are declining (-3.0%/yr); year-one equity from $552 of loan paydown is wiped out by about $2k of value loss. Plan a longer hold.
- At projected returns (-3.0% appreciation + 3.0% rent growth), your $22k cash investment doubles in ~10 years — after that, you're playing with house money.
Negotiation context
- It's been on market 31 days — a 3% lower offer ($78k) is reasonable based on typical stale-listing flexibility.
Risks & watch-outs
- Watch-outs: built in 1902 — expect roof / HVAC / electrical / plumbing capex.
Questions for the listing agent
- It's been on market 31 days. Have you received any prior offers? Is the seller open to a 3% concession, seller financing, or rate buy-down credit?
- Built in 1902 — when were the roof, HVAC, electrical panel, plumbing, and water heater last replaced?
- Is there a deadline driving the sale (1031 exchange, divorce, estate, relocation)? That informs how much negotiation room exists.
- Schools are F-rated, which usually means shorter tenancies and higher turnover. Who's the typical renter profile here, and what's been the actual vacancy rate?
- Crime grade is F in this area — have there been break-ins, vandalism, or insurance claims at this property in the last 3 years? What carrier currently insures it and at what premium?
- What's the average days-on-market for RENTAL listings here right now (not sales)? A rising rental-DOM trend means longer vacancies and softer asking-rent achievability than the comps imply.
- What's the recent tenant-quality profile in this submarket — average credit score on applications, eviction rate, late-payment / NSF rate, and stable-employment percentage? A property-management company in the area should have these aggregated.
- How much new for-sale + rental construction is in the pipeline within 1–3 miles? Heavy new supply typically softens prices + rents 12–24 months out; constrained supply supports both.
Investment metrics
- 1% rule
- 1.20% ✓
- Cap rate
- 9.63%
- Cash-on-cash
- 11.93%
- DSCR
- 1.53
- GRM
- 6.9
CMA / ARV
- ARV (on-the-fly)
- $90,720
- Comps found
- 12
Show comp detail 12 sales within ~0.75 mi
| Address | Dist | Beds/Ba | Sqft | Sold | Price | $/sf | Match |
|---|---|---|---|---|---|---|---|
| 1144 E Dayton St | 0.26mi | 3/1.0 (+1) | 864 (0%) | 1mo | $67,000 | $78 | 82 |
| 1714 S Twyckenham Dr | 0.44mi | 2/1.0 | 870 (+1%) | 1mo | $91,000 | $105 | 78 |
| 1148 E Dayton St | 0.26mi | 2/1.0 | 936 (+8%) | 1mo | $67,000 | $72 | 73 |
| 1340 E Calvert St | 0.43mi | 2/1.0 | 888 (+3%) | 3mo | $65,500 | $74 | 73 |
| 931 Emerson Ave | 0.39mi | 2/1.0 | 816 (-6%) | 0mo | $170,000 | $208 | 72 |
| 1110 Roberts St | 0.27mi | 2/1.0 | 752 (-13%) | 3mo | $146,000 | $194 | 63 |
| 1201 Oakland St | 0.32mi | 2/1.0 | 965 (+12%) | 5mo | $118,000 | $122 | 62 |
| 804 E Calvert St | 0.48mi | 2/1.0 | 779 (-10%) | 1mo | $72,000 | $92 | 61 |
| 1405 E Donald St | 0.53mi | 2/1.0 | 756 (-12%) | 2mo | $55,000 | $73 | 53 |
| 1710 E Calvert St | 0.69mi | 1/1.0 (-1) | 808 (-6%) | 2mo | $115,000 | $142 | 51 |
| 1618 E Dayton St | 0.54mi | 2/1.0 | 748 (-13%) | 2mo | $135,000 | $180 | 51 |
| 1113 E Donald St | 0.46mi | 3/1.0 (+1) | 972 (+12%) | 5mo | $95,000 | $98 | 49 |
Match score weights: distance 35% · size 25% · config 20% · recency 20%. Top-matched comps best support the ARV.
Projected returns pro-forma
-3.0% appreciation · 3.0% rent growth · sell at horizon
- IRR
- 1.4%
- Equity multiple
- 1.05×
- Total profit
- $1,220
- Equity at exit
- $11,913
- IRR
- 11.0%
- Equity multiple
- 1.86×
- Total profit
- $19,320
- Equity at exit
- $6,908
Cash invested: $22,372 (down + closing). Projections, not guarantees.
Landlord ↔ Tenant lean methodology
- Overall (STATE)
- 90 Strongly Landlord-Friendly
- State Indiana
- 90 Strongly Landlord-Friendly · R+11
- County
- — inherits STATE
- City
- — inherits STATE
ZIP-level market 46635
- Home prices YoY
- -29.8%
- Active inventory
- 32
- Price-to-rent
- 6.9×
Monthly cashflow live
- Estimated rent
- $961 high interval (Pro) →
- Mortgage (P&I)
- −$419
- Tax from tax record
- −$85 /mo · $1,015/yr
- Insurance
- −$33
- HOA
- −$0
- Vacancy / Maint / Mgmt
- −$202
- Net cashflow
- $222
Break-even live
UW: 25.0% down · 7.5% · 30yr · 1.5% tax · 5.0% vac · 8.0% maint · 8.0% mgmt
Financing live
Cash to close
- Down payment
- $19,975
- Closing costs
- $2,397
- Reserves months
- —
- Total cash needed
- —
Loan-product check · same deal, 3 products live
Conventional
25% down · 7.5% · 30yr
- Down + closing
- —
- Monthly P&I
- —
- Monthly cashflow
- —
- DSCR
- —
- Eligible?
- —
Personal DTI + credit; lowest rate.
DSCR
20% down · 8.5% · 30yr
- Down + closing
- —
- Monthly P&I
- —
- Monthly cashflow
- —
- DSCR
- —
- Eligible?
- —
No personal income docs; deal must DSCR.
Hard money
10% down · 12.0% · 12mo
- Down + closing
- —
- Monthly P&I
- —
- Monthly cashflow
- —
- DSCR
- —
- Eligible?
- —
Short-term bridge; refi at stabilization.
Rent comps 24 comps
| Address | Beds | Baths | Sqft | Rent | $/sqft | DOM | Units | Dist |
|---|---|---|---|---|---|---|---|---|
| 1142 E Indiana Ave South Bend, IN | 1.0 | 1.0 | 751 | $599 | $0.80 | 13d | 1 | 0.11mi |
| 1213 E Donald St South Bend, IN | 2.0 | 1.0 | 648 | $1,050 | $1.62 | 20d | 1 | 0.48mi |
| 2114 High St South Bend, IN | 3.0 | 1.0 | 949 | $1,300 | $1.37 | 43d | 1 | 0.62mi |
| 1729 E Calvert St South Bend, IN | 3.0 | 1.0 | 900 | $1,300 | $1.44 | 43d | 1 | 0.71mi |
| 1701 E Donald St South Bend, IN | 2.0 | 1.0 | 720 | $1,075 | $1.49 | 43d | 1 | 0.74mi |
| 604 E South St South Bend, IN | 1.0 | 1.0 | 750 | $825 | $1.10 | 43d | 1 | 0.82mi |
| 1106 S 20th St South Bend, IN | 1.0–3.0 | 1.0–2.0 | 885 | $924 | $1.04 | 13d | 1 | 0.84mi |
| 202 E Calvert St South Bend, IN | 2.0 | 1.0 | 1000 | $999 | $1.00 | 20d | 1 | 0.86mi |
| 533 Columbia St Unit C South Bend, IN | 1.0 | 1.0 | 600 | $700 | $1.17 | 20d | 1 | 0.97mi |
| 237 E Victoria St South Bend, IN | 3.0 | 1.0 | 840 | $995 | $1.18 | 43d | 1 | 1.02mi |
| 214 Altgeld St South Bend, IN | 2.0 | 1.0 | 950 | $1,200 | $1.26 | 20d | 1 | 1.03mi |
| 2804 Delaware St Mishawaka, IN | 2.0 | 1.0 | 720 | $1,200 | $1.67 | 13d | 1 | 1.04mi |
| 1009 E Jefferson Blvd South Bend, IN | 2.0 | 1.0 | 770 | $1,049 | $1.36 | 20d | 1 | 1.08mi |
| 754 S 23rd St South Bend, IN | 3.0 | 1.0 | 884 | $1,300 | $1.47 | 43d | 1 | 1.12mi |
| 2530 Pleasant St Unit 3 South Bend, IN | 1.0 | 1.0 | 600 | $925 | $1.54 | 13d | 1 | 1.16mi |
| 2508 E Mishawaka Ave Unit 3A South Bend, IN | 1.0 | 1.0 | 600 | $1,200 | $2.00 | 43d | 1 | 1.17mi |
| 911 E Washington St South Bend, IN | 3.0 | 1.0 | 886 | $1,195 | $1.35 | 13d | 1 | 1.18mi |
| 1218 S 26th St South Bend, IN | 3.0 | 1.0 | 856 | $1,400 | $1.64 | 13d | 1 | 1.19mi |
| 804 S 27th St South Bend, IN | 1.0 | 1.0 | 700 | $850 | $1.21 | 20d | 1 | 1.34mi |
| 922 Ridgedale Rd South Bend, IN | 2.0 | 1.0 | 864 | $1,200 | $1.39 | 13d | 1 | 1.35mi |
| 1920 S Scott St South Bend, IN | 2.0 | 1.0 | 816 | $1,000 | $1.23 | 13d | 1 | 1.39mi |
| 2102 S Scott St South Bend, IN | 3.0 | 1.0 | 768 | $1,250 | $1.63 | 43d | 1 | 1.42mi |
| 427 S 27th St South Bend, IN | 2.0 | 1.0 | 840 | $950 | $1.13 | 43d | 1 | 1.47mi |
| 526 S 28th St South Bend, IN | 2.0 | 1.0 | 1000 | $1,350 | $1.35 | 13d | 1 | 1.50mi |
Listing history 16 events
-
2026-06-18days on market $79,900 Active 31 DOM
-
2026-06-17days on market $79,900 Active 30 DOM
-
2026-06-16days on market $79,900 Active 29 DOM
-
2026-06-15days on market $79,900 Active 28 DOM
-
2026-06-14days on market $79,900 Active 26 DOM
-
2026-06-13days on market $79,900 Active 25 DOM
-
2026-06-10days on market $79,900 Active 23 DOM
-
2026-06-09days on market $79,900 Active 22 DOM
-
2026-06-08days on market $79,900 Active 21 DOM
-
2026-06-07days on market $79,900 Active 20 DOM
-
2026-06-03days on market $79,900 Active 16 DOM
-
2026-06-02days on market $79,900 Active 15 DOM
-
2026-06-01days on market $79,900 Active 14 DOM
-
2026-05-31days on market $79,900 Active 13 DOM
-
2026-05-30days on market $79,900 Active 12 DOM
-
2026-05-18$79,900 Active
ⓘ Source: listings_history table (triggers on properties + properties_extension) + one-shot
backfill from property_details.listing_events for pre-trigger history.
Tax reassessment forecast IN · Partial reset (capped growth)
- Current annual tax
- $1,015 · $85/mo
- Projected year-2 tax
- $1,015 · $85/mo
- Expected delta
- $0/yr ($0/mo · 0.0%)
ⓘ Screening estimate from a state-policy table — verify with the county assessor before closing.
Climate risk First Street
- Flood 1/10 Low FEMA zone X (unshaded) · 0% chance over 30 yrs
- Wildfire 1/10 Low
- Heat 3/10 Moderate 7 d/yr ≥99°F today · 16 d/yr by 30 yrs out
- Wind 2/10 Low
- Air quality 3/10 Moderate 2 unhealthy d/yr today · 3 by 30 yrs out
Nearby sold comps map
Loading sold comps map…
Walkable amenities ~0.75 mi
Loading nearby amenities…
Taxation est. · year 1
- Rental income
- $11,533
- − Mortgage interest
- −$4,476
- − Property taxes
- −$1,015
- − Insurance
- −$400
- − Repairs & maintenance
- −$923
- − Management
- −$923
- − Depreciation
- −$2,324
- Taxable income
- $1,473
- Est. tax owed @ 24.0%
- −$354
- After-tax cash flow
- $2,315/yr
For passive investors: Depreciation is non-cash, so a rental often shows a tax loss while cash-flowing — sheltering income. Rental losses are passive: they offset passive income freely, and up to $25,000/yr can offset ordinary (W-2) income if you actively participate and your MAGI is under $100k (phasing out to $0 by $150k); unused losses carry forward. On sale, claimed depreciation is recaptured at up to 25%, and gains may owe capital-gains tax (a 1031 exchange can defer both). Figures are a year-1 estimate at your 24.0% rate — not tax advice; consult a CPA.
Schools (NCES district)
- District
- South Bend Community School Corporation
- NCES district ID
- 1810290
- Math proficiency
- 12% ▼ -10.00%
- Reading proficiency
- 21% ▼ -6.00%
- Median HH income
- $41,935
- Composite
- 14.21/100
- National rank
- #9452
- State rank
- #284 of 301 in IN
Livability — South Bend
- Score
- 64/100
- State rank
- #365
- US rank
- #13730
Category grades
Schools grade is shown separately in the Schools card above.
Census & demographics
- Census place
- South Bend, IN
- City population
- 99,767
- Population (ZIP)
- 6,552
Population outlook (St. Joseph County) Hauer SSP2
- Today (2025)
- 273,186 people
- By 2030
- 273,594 · +0.1%
- By 2040
- 271,641 · -0.6%
- By 2050
- 269,187 · -1.5%
- By 2075
- 263,136 · -3.7%
- By 2100
- 245,659 · -10.1%
Race, ethnicity, and origin ACS 2023
- Neighborhood character
- Predominantly White (84%)
- Race & ethnicity
- White 84% Two or more races 8% Black 5% Asian 3% Hispanic / Latino 1%
- Common ancestry
- Romanian 7% Slovak 2% Iranian 2%
- Foreign-born
- 4% · Canada, China, Vietnam
- Languages at home
- 95% English-only · Spanish 1% Vietnamese 1% Arabic 1%
Political lean MEDSL · St. Joseph
- 2024 margin
- Toss-up / Even · D 50.0% · R 48.5% · Other 1.5%
- 2008→2024 swing
- -15.6pp toward R · 2008: 17.1pp · 2024: 1.5pp
- All cycles
- 2024: D+1.5 2020: D+5.8 2016: D+0.2 2012: D+3.5 2008: D+17.1
Not yet ingested
- Civics
- —
Market trends
- HPI YoY
- ▼ -90.65%
- Current HPI
- 213.5397
- Rent YoY
- —
- Metro
- —
- State GDP YoY
- ▲ 2.90%
- F500 in state
- 18
Industry mix (Fortune 500 HQ in IN)
| Industry | F500 HQs | Revenue |
|---|---|---|
| Industrial Machinery | 2 | $37B |
|
||
| Healthcare | 1 | $177B |
|
||
| Pharmaceuticals | 1 | $45B |
|
||
| Metals / Steel | 1 | $18B |
|
||
| Agriculture | 1 | $17B |
|
||
| Packaging | 1 | $12B |
|
||
Price history
1 event — show timeline
- 2026-05-18 Listed $79,900 IRMLS
Property tax history
+22.8%/yrLatest (2023): $1,015 · +4.2% YoY. Source: county tax records.
Cash-flow waterfall
monthlySold comps — $/sqft
last 12 mo · ≤1 miLoading sold comps…