 Multi-family
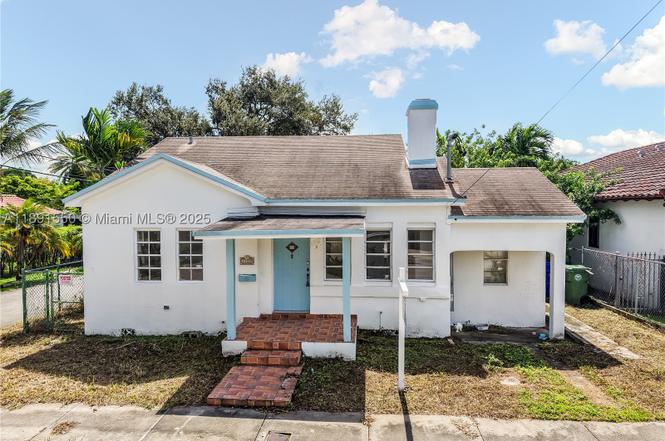
2100 SW 25th St · Miami, FL
Flood risk 4/10 · Minor
- FEMA flood zone
- X (unshaded)
- Chance of flooding over 30 yrs
- 0.22%
- Est. flood insurance / yr
- $507 – $1,088
Fire risk 1/10 · Minimal
- Est. fire insurance / yr
- $947 – $1,759
Heat risk 10/10 · Severe
- Hot days now (above 104°F)
- 7 days/yr
- Hot days in 30 yrs
- 28 days/yr
Wind risk 10/10 · Severe
- Chance of severe wind over 30 yrs
- 99.0%
Air-quality risk 2/10 · Minimal
- Unhealthy air days now
- 1 days/yr
- Unhealthy air days in 30 yrs
- 1 days/yr
Risk factors via First Street. Map © Google.
Why this score? — see what drove the F grade
The composite is a weighted blend of 9 inputs, each scored 0–100. Each bar is that input's sub-score; the figure is the points it added to the 100-point composite (weight × sub-score).
- Cash flow +7.5/30.0
- ARV discount +7.5/15.0
- Schools +4.2/10.0
- 1% rule +4.1/10.0
- Livability +3.9/5.0
- Rent growth +3.2/5.0
- Condition / age +2.5/5.0
- DSCR +1.6/10.0
- Appreciation +0.0/10.0
$450,000
🖨 Deal sheet 📄 Offer letter ✓ Due diligence
Multi-family units
County records classify this as Multi-Family (2-4 Unit). Listing-text estimate: 1 unit. estimate disagrees with records
Listing remarks
This rare and exciting corner lot in the highly desirable Silver Bluff Estates, Citrus Park Subdivision. Perfectly positioned for redevelopment, offering strong upside for investors and developers, or as a site for a prime single-family home in one of Miami’s most coveted neighborhoods. Just minutes from Bayshore Drive, CocoWalk, and Coral Gables, the property combines convenience, lifestyle appeal, and exposure to a rapidly growing, high-demand market, making this a prime candidate for redevelopment and long-term value creation.
Key facts
- Corner lot
- 7,150 sq ft lot
- Parking
Tags
Property features AI
Exterior
- Parking: Driveway; On-street parking
- Utilities: Public water; Public sewer and septic tank
- Home design: Single-story residence; Effective year built
- Construction: Block construction; Shingle roof
- Exterior features: Guest house on property; Less than quarter-acre lot; Property faces north
Interior
- Bedrooms: Includes guest quarters / in-law suite
- Flooring: Tile
- Bathrooms: 3 full bathrooms
- Heating & cooling: Central heating; Central air conditioning
- Interior features: First-floor entry; Bedroom on main level; Tile flooring
- Laundry & utility: Washer included
Neighborhood map
What this means for you Summary
Snapshot
- This is a 2-bed/1.0-bath multifamily listed at $450k.
Deal economics
- At list price, monthly cash flow is $-569 ($-7k/yr) — negative.
- To cash-flow at today's rent, offer at most $349k (22.4% below list).
- To meet the 1% rule (rent ≥ 1% of price), the offer needs to be $410k (8.8% below list).
- Recommended offer: $349k (22.4% below list) — sets the bar for cash-flow.
- Cap rate 4.8% vs local median 1.9% in Miami — top-decile yield for the area; either an underpriced asset or a hidden risk that comps aren't pricing in. Stress-test before assuming the spread holds.
Location & tenants
- Location reads 78/100 on livability (#177 in FL, #2,724 nationally) — a middle-class / working-renter tenant base. Strengths: amenities A+, commute A+, health & safety A+; Watch: employment C-, crime F, cost of living F.
- Miami-Dade (suburban): math 45% / reading 54% proficiency, ranked #40 of 73 in FL (top 55%) — families likely to look elsewhere, expect single-tenant / working-renter base with shorter leases; 64% free/reduced lunch — lower-income household profile, screen leases tightly.
- Market conditions: Rents rising (+2.7%/yr); 451 active listings in the ZIP; 1 comparable units currently listed for rent nearby; solid renter incomes; 10,051 units permitted in Miami-Dade County in 2024 (7,758 in 5+ unit buildings).
- At $4,102/mo this rent would consume 48% of the median local household income ($103k/yr) (locally 2105% of renters already pay >50% of income on rent) — very limited rent-growth headroom before tenants either downsize or default.
Forward outlook
- Local home prices are declining (-3.0%/yr); year-one equity from $3k of loan paydown is wiped out by about $14k of value loss. Plan a longer hold.
- Miami-Dade County population projected at +28% by 2050 — long-run rental-demand tailwind backs the buy-and-hold thesis.
Negotiation context
- It's been on market 255 days — a 12% lower offer ($396k) is reasonable based on typical stale-listing flexibility.
- 9 sale attempts since 10y ago; this cycle's ask has dropped $449k (50%) from the opening price — seller is motivated, your offer sets the floor, not the list.
Risks & watch-outs
- Watch-outs: property tax is 3.4% of price; built in 1940 — expect roof / HVAC / electrical / plumbing capex.
- Climate carrying-cost: severe wind risk, 99% chance of damaging wind over 30y; extreme-heat days projected 7→28/yr by 2055 (HVAC capex compounding) — expect insurance premiums to compound above CPI over the hold.
Questions for the listing agent
- What do current leases actually rent for vs. the listed asking? Can we see a recent rent roll and the last 12 months of T-12 income?
- It's been on market 255 days. Have you received any prior offers? Is the seller open to a 22% concession, seller financing, or rate buy-down credit?
- Built in 1940 — when were the roof, HVAC, electrical panel, plumbing, and water heater last replaced?
- Property tax is high relative to price — has the assessment been appealed recently, and will the sale trigger a re-assessment?
- Why hasn't it sold? Are there any deal-killer items the seller is aware of (foundation, flood, title, zoning, code violations)?
- Is there a deadline driving the sale (1031 exchange, divorce, estate, relocation)? That informs how much negotiation room exists.
- Schools are B-rated — typically a magnet for longer-tenancy family renters. What's the average tenant stay here, and is there a school-zone premium baked into asking?
- Crime grade is F in this area — have there been break-ins, vandalism, or insurance claims at this property in the last 3 years? What carrier currently insures it and at what premium?
- The area grade is low — what's the realistic commute time and amenity access for the typical tenant pool here? Any planned neighborhood developments (good or bad) we should know about?
- What's the average days-on-market for RENTAL listings here right now (not sales)? A rising rental-DOM trend means longer vacancies and softer asking-rent achievability than the comps imply.
- What's the recent tenant-quality profile in this submarket — average credit score on applications, eviction rate, late-payment / NSF rate, and stable-employment percentage? A property-management company in the area should have these aggregated.
- How much new apartment / multifamily construction is in the pipeline within 1–3 miles? Heavy new supply (>2% of stock underway) typically softens rents 12–24 months out; light construction supports rent growth.
Investment metrics
- 1% rule
- 0.91% ✗
- Cap rate
- 4.77%
- Cash-on-cash
- -5.42%
- DSCR
- 0.76
- GRM
- 9.1
CMA / ARV
No comps found within radius.
Projected returns pro-forma
-3.0% appreciation · 2.72% rent growth · sell at horizon
- IRR
- -25.8%
- Equity multiple
- 0.13×
- Total profit
- $-109,843
- Equity at exit
- $67,096
- IRR
- -23.0%
- Equity multiple
- -0.15×
- Total profit
- $-145,047
- Equity at exit
- $38,908
Cash invested: $126,000 (down + closing). Projections, not guarantees.
Landlord ↔ Tenant lean methodology
- Overall (STATE)
- 87 Strongly Landlord-Friendly
- State Florida
- 87 Strongly Landlord-Friendly · R+3
- County
- — inherits STATE
- City
- — inherits STATE
ZIP-level market 33133
- Rents YoY
- 2.7%
- Active inventory
- 451
- Price-to-rent
- 9.1×
Monthly cashflow live
- Estimated rent
- $4,102 medium interval (Pro) →
- Mortgage (P&I)
- −$2,360
- Tax from tax record
- −$1,263 /mo · $15,151/yr
- Insurance
- −$188
- HOA
- −$0
- Vacancy / Maint / Mgmt
- −$861
- Net cashflow
- $-569
Break-even live
UW: 25.0% down · 7.5% · 30yr · 1.5% tax · 5.0% vac · 8.0% maint · 8.0% mgmt
Financing live
Cash to close
- Down payment
- $112,500
- Closing costs
- $13,500
- Reserves months
- —
- Total cash needed
- —
Loan-product check · same deal, 3 products live
Conventional
25% down · 7.5% · 30yr
- Down + closing
- —
- Monthly P&I
- —
- Monthly cashflow
- —
- DSCR
- —
- Eligible?
- —
Personal DTI + credit; lowest rate.
DSCR
20% down · 8.5% · 30yr
- Down + closing
- —
- Monthly P&I
- —
- Monthly cashflow
- —
- DSCR
- —
- Eligible?
- —
No personal income docs; deal must DSCR.
Hard money
10% down · 12.0% · 12mo
- Down + closing
- —
- Monthly P&I
- —
- Monthly cashflow
- —
- DSCR
- —
- Eligible?
- —
Short-term bridge; refi at stabilization.
Rent comps 1 comps
| Address | Beds | Baths | Sqft | Rent | $/sqft | DOM | Units | Dist |
|---|---|---|---|---|---|---|---|---|
| 1710 SW 27th Ave Unit 1272101P Miami, FL | 1.0–5.0 | 1.0–4.0 | 1716 | $7,851 | $4.57 | 7d | 3 | 0.99mi |
Listing history 46 events
-
2026-06-18days on market $450,000 Active 255 DOM
-
2026-06-17days on market $450,000 Active 254 DOM
-
2026-06-16days on market $450,000 Active 253 DOM
-
2026-06-15days on market $450,000 Active 252 DOM
-
2026-06-13days on market $450,000 Active 250 DOM
-
2026-06-09days on market $450,000 Active 246 DOM
-
2026-06-08days on market $450,000 Active 245 DOM
-
2026-06-08days on market $450,000 Active 244 DOM
-
2026-06-04days on market $450,000 Active 241 DOM
-
2026-06-03days on market $450,000 Active 240 DOM
-
2026-06-02days on market $450,000 Active 239 DOM
-
2026-06-01days on market $450,000 Active 238 DOM
-
2026-05-31days on market $450,000 Active 237 DOM
-
2026-05-07price $450,000
-
2026-04-27status Active
-
2026-03-09historical Active Under Contract
-
2026-02-04price $799,000
-
2026-01-12price $835,000
-
2025-11-13price $850,000
-
2025-10-06$899,000 Active
-
2025-03-15historical
-
2024-09-16$800,000 Active
-
2024-09-16historical
-
2024-04-24$799,000 Active
-
2024-02-20historical
-
2024-02-13price $799,000
-
2024-02-06price $850,000
-
2024-02-05price $750,000
-
2024-01-08$850,000 Active
-
2023-03-15historical
-
2022-06-30price $699,727
-
2022-03-25$775,000 Active
-
2020-10-19soldstatus $420,000 Closed
-
2020-10-16soldstatus $420,000
-
2020-10-01status Pending
-
2020-09-19historical Active Under Contract
-
2020-08-03$499,999 Active
-
2019-10-25status Pending
-
2019-10-25historical
-
2019-10-12price $549,999
-
2019-10-08price $599,998
-
2019-10-05$674,000 Active
-
2016-05-31historical
-
2016-05-31$459,000 Active
-
1999-11-17soldstatus $190,000
-
1992-05-12soldstatus $50,000
ⓘ Source: listings_history table (triggers on properties + properties_extension) + one-shot
backfill from property_details.listing_events for pre-trigger history.
Tax reassessment forecast FL · Resets to sale price
- Current annual tax
- $15,151 · $1,263/mo
- Projected year-2 tax
- $15,151 · $1,263/mo
- Expected delta
- $0/yr ($0/mo · 0.0%)
ⓘ Screening estimate from a state-policy table — verify with the county assessor before closing.
Climate risk First Street
- Flood 4/10 Moderate FEMA zone X (unshaded) · 22% chance over 30 yrs
- Wildfire 1/10 Low
- Heat 10/10 Extreme 7 d/yr ≥104°F today · 28 d/yr by 30 yrs out
- Wind 10/10 Extreme 99% chance of damaging wind over 30 yrs
- Air quality 2/10 Low 1 unhealthy d/yr today · 1 by 30 yrs out
Nearby sold comps map
Loading sold comps map…
Walkable amenities ~0.75 mi
Loading nearby amenities…
Taxation est. · year 1
- Rental income
- $49,224
- − Mortgage interest
- −$25,207
- − Property taxes
- −$15,151
- − Insurance
- −$2,250
- − Repairs & maintenance
- −$3,938
- − Management
- −$3,938
- − Depreciation
- −$13,091
- Taxable loss
- −$14,351
- Est. tax savings @ 24.0%
- +$3,444
- After-tax cash flow
- $-3,388/yr
For passive investors: Depreciation is non-cash, so a rental often shows a tax loss while cash-flowing — sheltering income. Rental losses are passive: they offset passive income freely, and up to $25,000/yr can offset ordinary (W-2) income if you actively participate and your MAGI is under $100k (phasing out to $0 by $150k); unused losses carry forward. On sale, claimed depreciation is recaptured at up to 25%, and gains may owe capital-gains tax (a 1031 exchange can defer both). Figures are a year-1 estimate at your 24.0% rate — not tax advice; consult a CPA.
Schools (NCES district)
- District
- Miami-Dade
- NCES district ID
- 1200390
- Math proficiency
- 45% ▼ -16.00%
- Reading proficiency
- 54% ▼ -5.00%
- Median HH income
- $43,928
- Composite
- 41.76/100
- National rank
- #3397
- State rank
- #40 of 73 in FL
Livability — Miami
- Score
- 78/100
- State rank
- #177
- US rank
- #2724
Category grades
Schools grade is shown separately in the Schools card above.
Census & demographics
- Census place
- Miami, FL
- County
- Miami-Dade County · 2,697,751 people
- City population
- 827,308
- Metro
- Miami-Fort Lauderdale-Pompano Beach, FL
- Population (ZIP)
- 36,789
- Household income
- $103,420
- Rent vs Own
- Severe rent burden
- 2105.0
Population outlook (Miami-Dade County) Hauer SSP2
- Today (2025)
- 3,126,439 people
- By 2030
- 3,325,765 · +6.4%
- By 2040
- 3,697,561 · +18.3%
- By 2050
- 4,012,134 · +28.3%
- By 2075
- 4,605,612 · +47.3%
- By 2100
- 4,866,598 · +55.7%
Race, ethnicity, and origin ACS 2023
- Neighborhood character
- Diverse neighborhood (Simpson 0.58)
- Race & ethnicity
- Hispanic / Latino 57% Two or more races 38% White 28% Black 9% Asian 2%
- Hispanic origin (detail)
- Mexican 2% Puerto Rican 2% Cuban 22% Salvadoran 2%
- Common ancestry
- Lithuanian 3% Romanian 2% Scotch-Irish 2%
- Foreign-born
- 42% · Canada, Jamaica, Dominican Republic
- Languages at home
- 37% English-only · Spanish 53% Other Indo-European 4% French/Haitian/Cajun 3%
Political lean MEDSL · Miami-Dade
- 2024 margin
- R (+11.4) · D 43.9% · R 55.4%
- 2008→2024 swing
- -27.6pp toward R · 2008: 16.1pp · 2024: -11.4pp
- All cycles
- 2024: R+11.4 2020: D+7.3 2016: D+29.6 2012: D+23.7 2008: D+16.1
Not yet ingested
- Civics
- —
Market trends
- HPI YoY
- ▼ -997.74%
- Current HPI
- 460.9475
- Rent YoY
- ▲ 2.72%
- Metro
- Miami-Fort Lauderdale-Pompano Beach, FL
- State GDP YoY
- ▲ 3.28%
- F500 in state
- 36
Industry mix (Fortune 500 HQ in FL)
| Industry | F500 HQs | Revenue |
|---|---|---|
| Industrial Technology | 2 | $29B |
|
||
| Insurance | 2 | $17B |
|
||
| Retail | 1 | $60B |
|
||
| Technology Distribution | 1 | $58B |
|
||
| Homebuilding | 1 | $35B |
|
||
| Technology Manufacturing | 1 | $35B |
|
||
Price history
+800.0% since first listed33 events — show timeline
- 2026-05-07 Price Changed $450,000 MARMLS
- 2026-04-27 Relisted — MARMLS
- 2026-03-09 Contingent — MARMLS
- 2026-02-04 Price Changed $799,000 MARMLS
- 2026-01-12 Price Changed $835,000 MARMLS
- 2025-11-13 Price Changed $850,000 MARMLS
- 2025-10-06 Listed $899,000 MARMLS
- 2025-03-15 Listing Removed — MARMLS
- 2024-09-16 Listing Removed — MARMLS
- 2024-09-16 Listed $800,000 MARMLS
- 2024-04-24 Listed $799,000 MARMLS
- 2024-02-20 Listing Removed — MARMLS
- 2024-02-13 Price Changed $799,000 MARMLS
- 2024-02-06 Price Changed $850,000 MARMLS
- 2024-02-05 Price Changed $750,000 MARMLS
- 2024-01-08 Listed $850,000 MARMLS
- 2023-03-15 Listing Removed — MARMLS
- 2022-06-30 Price Changed $699,727 MARMLS
- 2022-03-25 Listed $775,000 MARMLS
- 2020-10-19 Sold (MLS) $420,000 MARMLS
- 2020-10-16 Sold (Public Records) $420,000 Public Records
- 2020-10-01 Pending — MARMLS
- 2020-09-19 Contingent — MARMLS
- 2020-08-03 Listed $499,999 MARMLS
- 2019-10-25 Pending — MARMLS
- 2019-10-25 Listing Removed — MARMLS
- 2019-10-12 Price Changed $549,999 MARMLS
- 2019-10-08 Price Changed $599,998 MARMLS
- 2019-10-05 Listed $674,000 MARMLS
- 2016-05-31 Listing Removed — MARMLS
- 2016-05-31 Listed $459,000 MARMLS
- 1999-11-17 Sold (Public Records) $190,000 Public Records
- 1992-05-12 Sold (Public Records) $50,000 Public Records
Property tax history
+13.6%/yrLatest (2025): $15,151 · +10.6% YoY. Source: county tax records.
Cash-flow waterfall
monthlySold comps — $/sqft
last 12 mo · ≤1 miLoading sold comps…