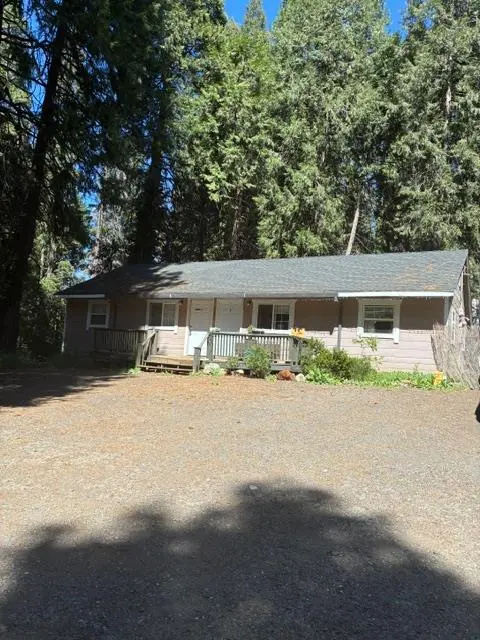
 Duplex
2823 Blair Rd · Pollock Pines, CA
Flood risk 1/10 · Minimal
- FEMA flood zone
- X (unshaded)
- Chance of flooding over 30 yrs
- 0.0%
- Est. flood insurance / yr
- $507 – $1,088
Fire risk 7/10 · Major
- Est. fire insurance / yr
- $659 – $1,223
Heat risk 3/10 · Minor
- Hot days now (above 97°F)
- 6 days/yr
- Hot days in 30 yrs
- 13 days/yr
Wind risk 1/10 · Minimal
- Chance of severe wind over 30 yrs
- —
Air-quality risk 9/10 · Severe
- Unhealthy air days now
- 19 days/yr
- Unhealthy air days in 30 yrs
- 24 days/yr
Risk factors via First Street. Map © Google.
Why this score? — see what drove the B- grade
The composite is a weighted blend of 9 inputs, each scored 0–100. Each bar is that input's sub-score; the figure is the points it added to the 100-point composite (weight × sub-score).
- Cash flow +30.0/30.0
- ARV discount +10.2/15.0
- DSCR +10.0/10.0
- 1% rule +8.9/10.0
- Schools +3.0/10.0
- Livability +2.8/5.0
- Rent growth +2.5/5.0
- Condition / age +2.5/5.0
- Appreciation +0.0/10.0
$299,000
🖨 Deal sheet 📄 Offer letter ✓ Due diligence
Multi-family units
County records classify this as Multi-Family (2-4 Unit). Listing-text estimate: 2 units. confirmed
Listing remarks
DUPLEX . .. . A Rare Find. .. Opportunity is Knocking, Live in one side, let the other side help pay the mortgage, Unit 2 is rented. Located in the Heart of Pollock Pines! Only minutes to Hwy 50. Zoned Multi Family 2-3 units. Large lot. Plenty of parking. Each unit is 1 Bedroom, 1 Bath with a full kitchen. Both unit have their own storage shed. Come take a look. . perfect for long term investment, or opening the door to your real estate portfolio. Seeing is believing. .
Key facts
- Plenty of parking
- Zoned multi family
- Large lot
Tags
Property features AI
Finance
- HOA & community: No homeowners association
Exterior
- Parking: Total of 4 parking spaces
- Utilities: Propane service; Septic system; Water meter on site; No irrigation
- Home design: Duplex residential income property; House(s) style; One story
- Construction: Built in 1960
- Exterior features: Composition roof
Interior
- Kitchen: Free standing gas range
- Bedrooms: Two 1-bedroom units (one bedroom in each unit)
- Flooring: Laminate and linoleum flooring
- Bathrooms: Each unit has one full bathroom
- Heating & cooling: Propane heating; Wall furnace; No cooling system
- Interior features: Uncovered deck
- Laundry & utility: Laundry: Other
Neighborhood map
What this means for you Summary
Snapshot
- This is a 2 × 1-bed/1-bath units multifamily listed at $299k.
Deal economics
- At list price, monthly cash flow is $1k ($17k/yr) — positive. Per door: $708/mo.
- The deal already cash-flows at list — no discount required.
- Meets the 1% rule at list price ($4k rent vs $299k).
- Recommended offer: $290k (3.0% below list) — sets the bar for market timing.
- Cap rate 12.0% vs local median 3.8% in Pollock Pines — top-decile yield for the area; either an underpriced asset or a hidden risk that comps aren't pricing in. Stress-test before assuming the spread holds.
Location & tenants
- Location reads 55/100 on livability (#864 in CA) — a working-class tenant base; expect higher turnover. Strengths: housing A-; Watch: schools D, crime D, amenities F.
- Pollock Pines Elementary (town): math 30% / reading 38% proficiency, ranked #277 of 517 in CA (top 54%) — families likely to look elsewhere, expect single-tenant / working-renter base with shorter leases.
- Market conditions: 154 active listings in the ZIP; 2 comparable units currently listed for rent nearby; 437 units permitted in El Dorado County in 2024 (0 in 5+ unit buildings).
Forward outlook
- Local home prices are declining (-3.0%/yr); year-one equity from $2k of loan paydown is wiped out by about $9k of value loss. Plan a longer hold.
- El Dorado County population projected to shrink 3% by 2050 — rents likely to lag national; underwrite the cash flow, not the appreciation.
- At projected returns (-3.0% appreciation + 3.0% rent growth), your $84k cash investment doubles in ~6 years — after that, you're playing with house money.
Negotiation context
- It's been on market 34 days — a 3% lower offer ($290k) is reasonable based on typical stale-listing flexibility.
- Current owner paid $160k; list at $299k implies a 87% gain — meaningful room to come down on a strong offer.
Risks & watch-outs
- Climate carrying-cost: major wildfire risk — expect insurance premiums to compound above CPI over the hold.
Questions for the listing agent
- It's been on market 34 days. Have you received any prior offers? Is the seller open to a 3% concession, seller financing, or rate buy-down credit?
- Can we see the unit-by-unit rent roll, current vacancy, and any below-market leases? What's the average tenancy length?
- What capital expenditures (roof, boiler, parking lot, exteriors) have been made in the last 5 years, and what's planned in the next 2?
- Built in 1960 — when were the roof, HVAC, electrical panel, plumbing, and water heater last replaced?
- Is there a deadline driving the sale (1031 exchange, divorce, estate, relocation)? That informs how much negotiation room exists.
- Schools are D-rated, which usually means shorter tenancies and higher turnover. Who's the typical renter profile here, and what's been the actual vacancy rate?
- Crime grade is D in this area — have there been break-ins, vandalism, or insurance claims at this property in the last 3 years? What carrier currently insures it and at what premium?
- What's the average days-on-market for RENTAL listings here right now (not sales)? A rising rental-DOM trend means longer vacancies and softer asking-rent achievability than the comps imply.
- What's the recent tenant-quality profile in this submarket — average credit score on applications, eviction rate, late-payment / NSF rate, and stable-employment percentage? A property-management company in the area should have these aggregated.
- How much new apartment / multifamily construction is in the pipeline within 1–3 miles? Heavy new supply (>2% of stock underway) typically softens rents 12–24 months out; light construction supports rent growth.
Investment metrics
- 1% rule
- 1.39% ✓
- Cap rate
- 11.98%
- Cash-on-cash
- 20.30%
- DSCR
- 1.90
- GRM
- 6.0
CMA / ARV
- ARV (on-the-fly)
- $317,952
- Comps found
- 1
Show comp detail 1 sale within ~0.75 mi
| Address | Dist | Beds/Ba | Sqft | Sold | Price | $/sf | Match |
|---|---|---|---|---|---|---|---|
| 5980 Pony Express Trl | 0.46mi | 3/2.0 (-1) | 1,296 (+12%) | 1mo | $358,000 | $276 | 44 |
Match score weights: distance 35% · size 25% · config 20% · recency 20%. Top-matched comps best support the ARV.
Projected returns pro-forma
-3.0% appreciation · 3.0% rent growth · sell at horizon
- IRR
- 12.5%
- Equity multiple
- 1.50×
- Total profit
- $41,678
- Equity at exit
- $44,582
- IRR
- 21.4%
- Equity multiple
- 2.82×
- Total profit
- $152,188
- Equity at exit
- $25,852
Cash invested: $83,720 (down + closing). Projections, not guarantees.
Landlord ↔ Tenant lean methodology
- Overall (STATE)
- 18 Strongly Tenant-Friendly
- State California
- 18 Strongly Tenant-Friendly · D+13
- County
- — inherits STATE
- City
- — inherits STATE
ZIP-level market 95726
- Active inventory
- 154
- Price-to-rent
- 12.0×
Monthly cashflow live
- Estimated rent
- $4,160 medium interval (Pro) →
- Mortgage (P&I)
- −$1,568
- Tax from tax record
- −$178 /mo · $2,134/yr
- Insurance
- −$125
- HOA
- −$0
- Vacancy / Maint / Mgmt
- −$874
- Net cashflow
- $1,416
Break-even live
2-unit breakdown (identical units grouped — click to expand)
| Units | Beds | Baths | Est. rent |
|---|---|---|---|
| 2× units | 1 | 1 | $4,160 |
| #1 | 1 | 1 | $2,080 |
| #2 | 1 | 1 | $2,080 |
| Total (2 units) | $4,160 | ||
UW: 25.0% down · 7.5% · 30yr · 1.5% tax · 5.0% vac · 8.0% maint · 8.0% mgmt
Financing live
Cash to close
- Down payment
- $74,750
- Closing costs
- $8,970
- Reserves months
- —
- Total cash needed
- —
Loan-product check · same deal, 3 products live
Conventional
25% down · 7.5% · 30yr
- Down + closing
- —
- Monthly P&I
- —
- Monthly cashflow
- —
- DSCR
- —
- Eligible?
- —
Personal DTI + credit; lowest rate.
DSCR
20% down · 8.5% · 30yr
- Down + closing
- —
- Monthly P&I
- —
- Monthly cashflow
- —
- DSCR
- —
- Eligible?
- —
No personal income docs; deal must DSCR.
Hard money
10% down · 12.0% · 12mo
- Down + closing
- —
- Monthly P&I
- —
- Monthly cashflow
- —
- DSCR
- —
- Eligible?
- —
Short-term bridge; refi at stabilization.
Rent comps 2 comps
| Address | Beds | Baths | Sqft | Rent | $/sqft | DOM | Units | Dist |
|---|---|---|---|---|---|---|---|---|
| 5731 Pony Express Trl Unit 2 Pollock Pines, CA | 3.0 | 1.0 | 1094 | $2,000 | $1.83 | 1d | 1 | 0.31mi |
| 6301 Fairview Dr Pollock Pines, CA | 3.0 | 2.0 | 1203 | $1,950 | $1.62 | 1d | 1 | 1.28mi |
Listing history 21 events
-
2026-06-18days on market $299,000 Active 34 DOM
-
2026-06-17days on market $299,000 Active 33 DOM
-
2026-06-16days on market $299,000 Active 32 DOM
-
2026-06-15price $299,000 Active 31 DOM
-
2026-06-15days on market $325,000 Active 31 DOM
-
2026-06-13days on market $325,000 Active 29 DOM
-
2026-06-13days on market $325,000 Active 28 DOM
-
2026-06-09days on market $325,000 Active 25 DOM
-
2026-06-08days on market $325,000 Active 24 DOM
-
2026-06-07days on market $325,000 Active 23 DOM
-
2026-06-03days on market $325,000 Active 19 DOM
-
2026-06-02days on market $325,000 Active 18 DOM
-
2026-06-01days on market $325,000 Active 17 DOM
-
2026-05-31days on market $325,000 Active 16 DOM
-
2022-03-05price $1,100
-
2015-09-11soldstatus $160,000
-
2006-12-06soldstatus $220,000
-
1990-06-26soldstatus $92,000
-
1990-06-26soldstatus $92,000
-
1989-06-22soldstatus $74,000
-
1985-05-17soldstatus $65,000
ⓘ Source: listings_history table (triggers on properties + properties_extension) + one-shot
backfill from property_details.listing_events for pre-trigger history.
Tax reassessment forecast CA · Resets to sale price
- Current annual tax
- $2,134 · $178/mo
- Projected year-2 tax
- $2,272 · $189/mo
- Expected delta
- +$139/yr (+$12/mo · 6.5%)
ⓘ Screening estimate from a state-policy table — verify with the county assessor before closing.
Climate risk First Street
- Flood 1/10 Low FEMA zone X (unshaded) · 0% chance over 30 yrs
- Wildfire 7/10 Severe
- Heat 3/10 Moderate 6 d/yr ≥97°F today · 13 d/yr by 30 yrs out
- Wind 1/10 Low
- Air quality 9/10 Extreme 19 unhealthy d/yr today · 24 by 30 yrs out
Nearby sold comps map
Loading sold comps map…
Walkable amenities ~0.75 mi
Loading nearby amenities…
Taxation est. · year 1
- Rental income
- $49,920
- − Mortgage interest
- −$16,749
- − Property taxes
- −$2,134
- − Insurance
- −$1,495
- − Repairs & maintenance
- −$3,994
- − Management
- −$3,994
- − Depreciation
- −$8,698
- Taxable income
- $12,857
- Est. tax owed @ 24.0%
- −$3,086
- After-tax cash flow
- $13,906/yr
For passive investors: Depreciation is non-cash, so a rental often shows a tax loss while cash-flowing — sheltering income. Rental losses are passive: they offset passive income freely, and up to $25,000/yr can offset ordinary (W-2) income if you actively participate and your MAGI is under $100k (phasing out to $0 by $150k); unused losses carry forward. On sale, claimed depreciation is recaptured at up to 25%, and gains may owe capital-gains tax (a 1031 exchange can defer both). Figures are a year-1 estimate at your 24.0% rate — not tax advice; consult a CPA.
Schools (NCES district)
- District
- Pollock Pines Elementary
- NCES district ID
- 0631290
- Math proficiency
- 30% ▼ -9.00%
- Reading proficiency
- 38% ▼ -10.00%
- Median HH income
- $56,474
- Composite
- 30.11/100
- National rank
- #6334
- State rank
- #277 of 517 in CA
Livability — Pollock Pines
- Score
- 55/100
- State rank
- #864
- US rank
- #23561
Category grades
Schools grade is shown separately in the Schools card above.
Census & demographics
- Census place
- Pollock Pines, CA
- Population (ZIP)
- 8,229
Population outlook (El Dorado County) Hauer SSP2
- Today (2025)
- 191,666 people
- By 2030
- 193,662 · +1.0%
- By 2040
- 192,583 · +0.5%
- By 2050
- 185,904 · -3.0%
- By 2075
- 169,543 · -11.5%
- By 2100
- 139,623 · -27.2%
Race, ethnicity, and origin ACS 2023
- Neighborhood character
- Predominantly White (82%)
- Race & ethnicity
- White 82% Hispanic / Latino 10% Two or more races 7% Asian 2% Black 1%
- Hispanic origin (detail)
- Mexican 8%
- Common ancestry
- Slovak 4% Romanian 3% Italian 3%
- Foreign-born
- 5% · Canada, South Korea
- Languages at home
- 94% English-only · Spanish 3% Tagalog/Filipino 1%
Political lean MEDSL · El Dorado
- 2024 margin
- R (+12.0) · D 42.6% · R 54.6% · Other 2.8%
- 2008→2024 swing
- -1.5pp toward R · 2008: -10.5pp · 2024: -12.0pp
- All cycles
- 2024: R+12.0 2020: R+8.8 2016: R+13.9 2012: R+18.2 2008: R+10.5
Not yet ingested
- Civics
- —
Market trends
- HPI YoY
- ▼ -187.87%
- Current HPI
- 253.8307
- Rent YoY
- —
- Metro
- —
- State GDP YoY
- ▲ 3.21%
- F500 in state
- 116
Industry mix (Fortune 500 HQ in CA)
| Industry | F500 HQs | Revenue |
|---|---|---|
| Technology | 27 | $1,492B |
|
||
| Financial Services | 3 | $174B |
|
||
| Retail | 3 | $44B |
|
||
| Insurance | 3 | $26B |
|
||
| Media / Entertainment | 2 | $115B |
|
||
| Pharmaceuticals / Biotech | 2 | $62B |
|
||
Price history
-98.3% since first listed7 events — show timeline
- 2022-03-05 Price Changed $1,100 RENT.
- 2015-09-11 Sold (Public Records) $160,000 Public Records
- 2006-12-06 Sold (Public Records) $220,000 Public Records
- 1990-06-26 Sold (Public Records) $92,000 Public Records
- 1990-06-26 Sold (Public Records) $92,000 Public Records
- 1989-06-22 Sold (Public Records) $74,000 Public Records
- 1985-05-17 Sold (Public Records) $65,000 Public Records
Property tax history
+2.2%/yrLatest (2025): $2,134 · +4.4% YoY. Source: county tax records.
Cash-flow waterfall
monthlySold comps — $/sqft
last 12 mo · ≤1 miLoading sold comps…