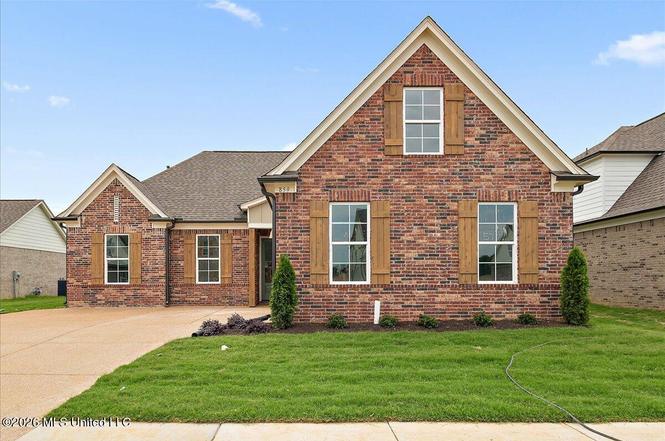
859 Coahoma Ct · Hernando, MS
Flood risk No data
- FEMA flood zone
- —
- Chance of flooding over 30 yrs
- —
- Est. flood insurance / yr
- —
Fire risk No data
- Est. fire insurance / yr
- —
Heat risk No data
- Hot days now (above threshold)
- —
- Hot days in 30 yrs
- —
Wind risk No data
- Chance of severe wind over 30 yrs
- —
Air-quality risk No data
- Unhealthy air days now
- —
- Unhealthy air days in 30 yrs
- —
Risk factors via First Street. Map © Google.
Why this score? — see what drove the C- grade
The composite is a weighted blend of 9 inputs, each scored 0–100. Each bar is that input's sub-score; the figure is the points it added to the 100-point composite (weight × sub-score).
- Cash flow +18.4/30.0
- ARV discount +7.4/15.0
- DSCR +5.8/10.0
- 1% rule +5.1/10.0
- Schools +4.0/10.0
- Condition / age +4.0/5.0
- Livability +3.5/5.0
- Rent growth +2.5/5.0
- Appreciation +0.0/10.0
$361,900
🖨 Deal sheet 📄 Offer letter ✓ Due diligence
Listing remarks
New Construction - The Stunning Indianola Plan! Welcome home to a beautifully designed 3-bedroom, 3-bath home with an additional bonus room or 4th bedroom. This home offers the perfect blend of style, comfort, and functionality. Step inside to a spacious foyer, leading to an oversized living room with an open staircase that enhances the sense of space. The open-concept kitchen seamlessly connects to the living area, while strategically placed cabinet walls maintain a subtle division--offering both openness and a functional barrier for kitchen noise. The kitchen is a chef's dream, featuring custom cabinetry, Quartz countertops, a stylish tile backsplash, and stainless-steel appliances plumb
Key facts
- Custom cabinetry
- Quartz countertops
- Open-concept kitchen
Tags
Property features AI
Finance
- Other: Property address: 859 Coahoma Court, Nesbit, MS 38651; Directions: From I269 and Mcingvale head north onto Mcingvale. Then take a left onto Bolivar Dr. Follow around and take a right onto Coahoma Ct and house will be down on the right.
- HOA & community: Homeowners association with an annual fee of $650 covering grounds maintenance and management; Community features include curbs, sidewalks and proximity to entertainment
Exterior
- Parking: Attached carriage-load garage with 2 spaces; Garage includes door opener, storage and concrete floor
- Security: Smoke detectors and carbon monoxide detectors; Dead bolt locks
- Utilities: Public water and public sewer; Electricity and natural gas connected; Underground utilities; Natural gas available in kitchen
- Home design: Single-family house with two levels; Builder model: Indianola; Move-in ready; New construction; Living area reported by builder
- Construction: Brick and HardiPlank exterior; Slab foundation; Architectural shingle roof
- Exterior features: Rear porch; Rain gutters; Lot is cleared, landscaped and level
Interior
- Kitchen: Dishwasher; Disposal; Free-standing gas oven/range; Oven with self-cleaning; Stainless steel appliances; Gas water heater
- Bedrooms: Primary bedroom (first level) — 14x14; Bedroom (first level) — 10x12; Bedroom (first level) — 10x14; Bonus room (second level) — 13x20
- Flooring: Combination of hardwood, ceramic tile and carpet
- Bathrooms: Three full bathrooms
- Heating & cooling: Central heating (natural gas); Central air with multiple units; Ceiling fans
- Interior features: Open floorplan with entrance foyer and high ceilings; Recessed lighting and ceiling fans; Breakfast bar and eat-in kitchen; Pantry and stone counters; Double vanity and soaking tub in primary bath; His and hers closets and walk-in closet(s); Primary bedroom on main level; High speed internet and wired for data; Dead bolt locks and insulated doors; Screens, shutters, and vinyl windows; Gas log fireplace in living room
- Laundry & utility: Laundry room on main level with washer and electric dryer hookups
Neighborhood map
What this means for you Summary
Snapshot
- This is a 4-bed/3.0-bath single-family listed at $362k. Condition is rated good.
Deal economics
- At list price, monthly cash flow is $335 ($4k/yr) — positive.
- The deal already cash-flows at list — no discount required.
- Meets the 1% rule at list price ($4k rent vs $362k).
- Cap rate 7.4% vs local median 4.2% in Hernando — top-decile yield for the area; either an underpriced asset or a hidden risk that comps aren't pricing in. Stress-test before assuming the spread holds.
Location & tenants
- Location reads 70/100 on livability (#44 in MS) — a middle-class / working-renter tenant base. Strengths: crime A+, cost of living A+, housing A+; Watch: amenities F, commute F, health & safety F.
- Desoto County School District (suburban): math 48% / reading 42% proficiency, ranked #20 of 130 in MS (top 15%) — families likely to look elsewhere, expect single-tenant / working-renter base with shorter leases.
- Zoned schools: Hernando Elem (779 students, 100% FRL); Hernando Middle School (math 75% / reading 57%, grade A-, #2 of 179 statewide, top 1%, 1,150 students, 100% FRL); Hernando High School (math 69% / reading 62%, grade B, #2 of 197 statewide, top 1%, 1,419 students, 100% FRL) — zoned schools average 100% FRL vs 43% district-wide (56 pts higher); higher-poverty schools than district average — tighter screening recommended.
- Zoned-school proficiency averages 66% at this address vs 45% district-wide (+21 pts) — the actual schools serving this property are materially stronger than the Desoto County School District average implies; a family-tenant draw the district grade alone would hide.
- Market conditions: 121 active listings in the ZIP; 2 comparable units currently listed for rent nearby; 1,155 units permitted in DeSoto County in 2024 (0 in 5+ unit buildings).
Forward outlook
- Local home prices are declining (-3.0%/yr); year-one equity from $3k of loan paydown is wiped out by about $11k of value loss. Plan a longer hold.
- DeSoto County population projected at +33% by 2050 — long-run rental-demand tailwind backs the buy-and-hold thesis.
Negotiation context
- Only 8 days on market — expect competitive offers; lowballing is unlikely to land.
Questions for the listing agent
- What does the HOA fee cover, when was the last increase, and are there any pending special assessments or reserve-fund shortfalls?
- Is there a deadline driving the sale (1031 exchange, divorce, estate, relocation)? That informs how much negotiation room exists.
- Schools are B-rated — typically a magnet for longer-tenancy family renters. What's the average tenant stay here, and is there a school-zone premium baked into asking?
- What's the average days-on-market for RENTAL listings here right now (not sales)? A rising rental-DOM trend means longer vacancies and softer asking-rent achievability than the comps imply.
- What's the recent tenant-quality profile in this submarket — average credit score on applications, eviction rate, late-payment / NSF rate, and stable-employment percentage? A property-management company in the area should have these aggregated.
- How much new for-sale + rental construction is in the pipeline within 1–3 miles? Heavy new supply typically softens prices + rents 12–24 months out; constrained supply supports both.
Investment metrics
- 1% rule
- 1.01% ✓
- Cap rate
- 7.41%
- Cash-on-cash
- 3.97%
- DSCR
- 1.18
- GRM
- 8.2
CMA / ARV
- ARV (on-the-fly)
- $361,043
- Comps found
- 12
Show comp detail 12 sales within ~0.75 mi
| Address | Dist | Beds/Ba | Sqft | Sold | Price | $/sf | Match |
|---|---|---|---|---|---|---|---|
| 828 W Quitman Ct | 0.10mi | 4/2.0 | 1,986 (-2%) | 0mo | $355,900 | $179 | 89 |
| 542 Sunflower St | 0.17mi | 4/2.5 | 2,071 (+3%) | 1mo | $370,900 | $179 | 85 |
| 654 Tallahatchie St | 0.12mi | 4/2.0 | 2,073 (+3%) | 1mo | $371,900 | $179 | 85 |
| 617 Sunflower St | 0.13mi | 4/2.0 | 2,084 (+3%) | 2mo | $372,900 | $179 | 83 |
| 854 Coahoma Ct | 0.02mi | 3/2.0 (-1) | 2,150 (+7%) | 0mo | $384,900 | $179 | 79 |
| 763 W Quitman Ct | 0.14mi | 4/2.0 | 1,887 (-6%) | 2mo | $337,900 | $179 | 77 |
| 502 Bolivar Dr | 0.24mi | 3/2.5 (-1) | 1,933 (-4%) | 0mo | $346,900 | $179 | 74 |
| 514 Bolivar Dr | 0.24mi | 4/2.0 | 1,876 (-7%) | 1mo | $338,900 | $181 | 72 |
| 818 W Quitman Ct | 0.10mi | 3/2.0 (-1) | 1,843 (-9%) | 2mo | $329,900 | $179 | 71 |
| 538 Bolivar Dr | 0.22mi | 3/2.0 (-1) | 1,874 (-7%) | 1mo | $338,900 | $181 | 68 |
| 526 Bolivar Dr | 0.23mi | 3/2.0 (-1) | 1,813 (-10%) | 2mo | $326,900 | $180 | 62 |
| 433 Sunflower St | 0.26mi | 3/2.0 (-1) | 1,810 (-10%) | 1mo | $326,900 | $181 | 61 |
Match score weights: distance 35% · size 25% · config 20% · recency 20%. Top-matched comps best support the ARV.
Projected returns pro-forma
-3.0% appreciation · 3.0% rent growth · sell at horizon
- IRR
- -10.1%
- Equity multiple
- 0.63×
- Total profit
- $-37,189
- Equity at exit
- $53,960
- IRR
- -0.6%
- Equity multiple
- 0.96×
- Total profit
- $-4,512
- Equity at exit
- $31,290
Cash invested: $101,332 (down + closing). Projections, not guarantees.
Landlord ↔ Tenant lean methodology
- Overall (STATE)
- 90 Strongly Landlord-Friendly
- State Mississippi
- 90 Strongly Landlord-Friendly · R+11
- County
- — inherits STATE
- City
- — inherits STATE
ZIP-level market 38651
- Home prices YoY
- -28.9%
- Active inventory
- 121
- Price-to-rent
- 8.2×
Monthly cashflow live
- Estimated rent
- $3,659 medium interval (Pro) →
- Mortgage (P&I)
- −$1,898
- Tax est. 1.5%
- −$452 /mo · $5,428/yr
- Insurance
- −$151
- HOA
- −$54
- Vacancy / Maint / Mgmt
- −$768
- Net cashflow
- $335
Break-even live
UW: 25.0% down · 7.5% · 30yr · 1.5% tax · 5.0% vac · 8.0% maint · 8.0% mgmt
Financing live
Cash to close
- Down payment
- $90,475
- Closing costs
- $10,857
- Reserves months
- —
- Total cash needed
- —
Loan-product check · same deal, 3 products live
Conventional
25% down · 7.5% · 30yr
- Down + closing
- —
- Monthly P&I
- —
- Monthly cashflow
- —
- DSCR
- —
- Eligible?
- —
Personal DTI + credit; lowest rate.
DSCR
20% down · 8.5% · 30yr
- Down + closing
- —
- Monthly P&I
- —
- Monthly cashflow
- —
- DSCR
- —
- Eligible?
- —
No personal income docs; deal must DSCR.
Hard money
10% down · 12.0% · 12mo
- Down + closing
- —
- Monthly P&I
- —
- Monthly cashflow
- —
- DSCR
- —
- Eligible?
- —
Short-term bridge; refi at stabilization.
Rent comps 2 comps
| Address | Beds | Baths | Sqft | Rent | $/sqft | DOM | Units | Dist |
|---|---|---|---|---|---|---|---|---|
| 272 Fairway Trace Dr Lot $3800 Hernando, MS | 4.0 | 2.0 | 2000 | $3,800 | $1.90 | 43d | 1 | 1.18mi |
| 237 US-51 Hernando, MS | 4.0 | 4.0 | 2986 | $3,400 | $1.14 | 43d | 1 | 1.48mi |
HOA detail
- Monthly dues
- $54 · $648/yr
Listing history 6 events
-
2026-06-18days on market $361,900 Active 8 DOM
-
2026-06-17days on market $361,900 Active 7 DOM
-
2026-06-16days on market $361,900 Active 6 DOM
-
2026-06-15days on market $361,900 Active 5 DOM
-
2026-06-13remarks 699-char remark
-
2026-06-13$361,900 Active 3 DOM
ⓘ Source: listings_history table (triggers on properties + properties_extension) + one-shot
backfill from property_details.listing_events for pre-trigger history.
Nearby sold comps map
Loading sold comps map…
Walkable amenities ~0.75 mi
Loading nearby amenities…
Taxation est. · year 1
- Rental income
- $43,906
- − Mortgage interest
- −$20,272
- − Property taxes
- −$5,428
- − Insurance
- −$1,810
- − Repairs & maintenance
- −$3,512
- − Management
- −$3,512
- − HOA
- −$648
- − Depreciation
- −$10,528
- Taxable loss
- −$1,805
- Est. tax savings @ 24.0%
- +$433
- After-tax cash flow
- $4,459/yr
For passive investors: Depreciation is non-cash, so a rental often shows a tax loss while cash-flowing — sheltering income. Rental losses are passive: they offset passive income freely, and up to $25,000/yr can offset ordinary (W-2) income if you actively participate and your MAGI is under $100k (phasing out to $0 by $150k); unused losses carry forward. On sale, claimed depreciation is recaptured at up to 25%, and gains may owe capital-gains tax (a 1031 exchange can defer both). Figures are a year-1 estimate at your 24.0% rate — not tax advice; consult a CPA.
Condition & rehab AI · 13 photos
This home is in excellent condition with a good condition score of 80. It is move-in ready with a cosmetic rehab level and minimal repairs needed. The highest-ROI updates would be painting the exterior brick and landscaping improvements to enhance curb appeal and a kitchen backsplash and bathroom vanity to add value for resale.
Value-add opportunities
- Resale Painting exterior brick — Enhances curb appeal
- Resale Landscaping improvements — Enhances curb appeal
- Resale Kitchen backsplash — Custom backsplash adds value
- Resale Bathroom vanity — Modern vanity enhances bathroom appeal
Renovation cost estimate screening
Value-add ROI direction
- Resale Painting exterior brick — Enhances curb appeal ↑
- Resale Landscaping improvements — Enhances curb appeal ↑
- Resale Kitchen backsplash — Custom backsplash adds value ↑
- Resale Bathroom vanity — Modern vanity enhances bathroom appeal ↑
ⓘ Cost ranges are severity-bucket heuristics (US national rule-of-thumb). Get contractor quotes + a written scope before underwriting a rehab budget.
Schools (NCES district)
- District
- Desoto County School District
- NCES district ID
- 2801320
- Math proficiency
- 48% ▼ -13.00%
- Reading proficiency
- 42% ▼ -6.00%
- Median HH income
- $59,272
- Composite
- 39.56/100
- National rank
- #3933
- State rank
- #20 of 130 in MS
Livability — Hernando
- Score
- 70/100
- State rank
- #44
- US rank
- #8034
Category grades
Schools grade is shown separately in the Schools card above.
Census & demographics
- Census place
- Hernando, MS
- City population
- 31,374
- Population (ZIP)
- 8,491
Population outlook (DeSoto County) Hauer SSP2
- Today (2025)
- 203,338 people
- By 2030
- 217,692 · +7.1%
- By 2040
- 245,320 · +20.6%
- By 2050
- 270,133 · +32.8%
- By 2075
- 323,341 · +59.0%
- By 2100
- 348,742 · +71.5%
Race, ethnicity, and origin ACS 2023
- Neighborhood character
- Predominantly White (66%)
- Race & ethnicity
- White 66% Black 20% Hispanic / Latino 12% Two or more races 4%
- Hispanic origin (detail)
- Mexican 10%
- Common ancestry
- Lithuanian 2% Serbian 1% Romanian 1%
- Foreign-born
- 8% · Canada, Guatemala, Jamaica
- Languages at home
- 88% English-only · Spanish 12%
Political lean MEDSL · DeSoto
- 2024 margin
- Strong R (+24.1) · D 36.7% · R 60.8% · Other 2.5%
- 2008→2024 swing
- +14.2pp toward D · 2008: -38.2pp · 2024: -24.1pp
- All cycles
- 2024: R+24.1 2020: R+23.9 2016: R+34.8 2012: R+33.5 2008: R+38.2
Not yet ingested
- Civics
- —
Market trends
- HPI YoY
- ▼ -71.47%
- Current HPI
- 176.28
- Rent YoY
- —
- Metro
- —
- State GDP YoY
- —
- F500 in state
- 0
Price history
1 event — show timeline
- 2026-06-10 Listed $361,900 MLSU
Cash-flow waterfall
monthlySold comps — $/sqft
last 12 mo · ≤1 miLoading sold comps…