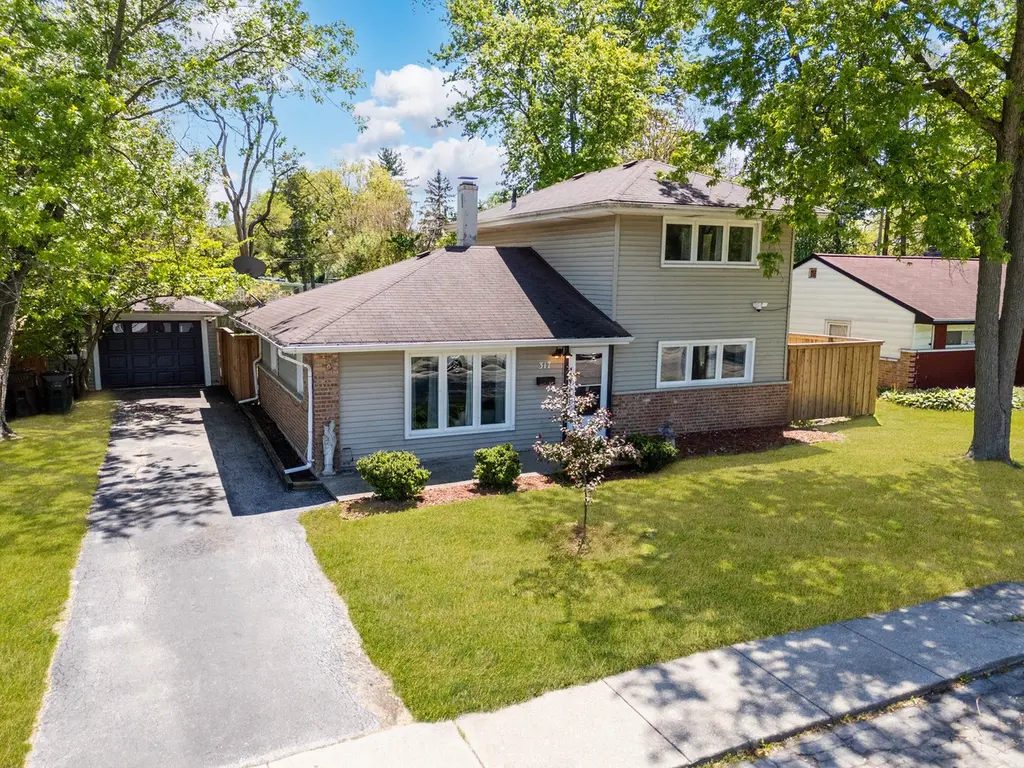
317 Seminole St · Park Forest, IL
Flood risk 1/10 · Minimal
- FEMA flood zone
- X (unshaded)
- Chance of flooding over 30 yrs
- 0.0%
- Est. flood insurance / yr
- $473 – $860
Fire risk 1/10 · Minimal
- Est. fire insurance / yr
- $804 – $1,492
Heat risk 3/10 · Minor
- Hot days now (above 101°F)
- 7 days/yr
- Hot days in 30 yrs
- 16 days/yr
Wind risk 2/10 · Minimal
- Chance of severe wind over 30 yrs
- —
Air-quality risk 2/10 · Minimal
- Unhealthy air days now
- 1 days/yr
- Unhealthy air days in 30 yrs
- 1 days/yr
Risk factors via First Street. Map © Google.
Why this score? — see what drove the D grade
The composite is a weighted blend of 9 inputs, each scored 0–100. Each bar is that input's sub-score; the figure is the points it added to the 100-point composite (weight × sub-score).
- Cash flow +21.7/30.0
- DSCR +6.9/10.0
- 1% rule +5.7/10.0
- Livability +3.9/5.0
- Rent growth +2.5/5.0
- Condition / age +2.5/5.0
- Schools +0.9/10.0
- ARV discount +0.4/15.0
- Appreciation +0.0/10.0
$195,000
🖨 Deal sheet 📄 Offer letter ✓ Due diligence
Listing remarks
Modern updates, stylish finishes, and a move-in ready interior come together beautifully in this fully remodeled split-level home in Park Forest. From the moment you enter, you'll appreciate the warm feel of the oak hardwood flooring and the thoughtfully updated spaces throughout. The sleek black kitchen offers a contemporary design with upgraded cabinetry, updated appliances, new usage and dryer, elegant countertops, and floating shelving that adds the perfect touch of character. Bathrooms have been completely refreshed with modern tile work, updated vanities, newer fixtures, and clean finishes designed for both style and comfort. Well maintained and ready for its next chapter, this home i
Key facts
- Updated appliances
- Elegant countertops
- Black kitchen
Tags
Property features AI
Finance
- Other: Property is not currently leased; Directions: Central Park Ave to Seminole, east to property
- HOA & community: No master association fee required
Exterior
- Parking: Detached garage (garage owned) with 1 garage space; Asphalt side driveway; total parking for 1 vehicle
- Utilities: Lake Michigan water source; Public sewer; Electricity available (standard)
- Home design: Detached single-family home; Two stories (bi-level listed); Fee simple ownership; Rehab completed in 2024; Built before 1978
- Construction: Vinyl siding and brick exterior; Asphalt roof; Concrete perimeter foundation; Estimated age: 71–80 years
- Exterior features: Lot roughly 70 x 118 (less than 0.25 acre); School bus service, commuter bus, interstate access
Interior
- Kitchen: Range; Range hood; Refrigerator (including high-end refrigerator); Stainless steel appliances
- Bedrooms: Master bedroom on the main level (14 x 11); Bedroom on the main level (11 x 10); Two additional bedrooms on the second level (13 x 10; 10 x 13)
- Flooring: Ceramic tile in kitchen and laundry; Wood laminate in one bedroom; Other/unspecified flooring in remaining rooms
- Bathrooms: 2 full bathrooms
- Heating & cooling: Natural gas forced-air heating; Central air conditioning
- Interior features: First-floor bedroom; First-floor full bathroom; Screens on windows; 7 total rooms
- Laundry & utility: Main-level laundry with sink; In-unit washer and dryer; Gas dryer hookup; Gas water heater
Neighborhood map
What this means for you Summary
Snapshot
- This is a 3-bed/2.0-bath single-family listed at $195k.
Deal economics
- At list price, monthly cash flow is $299 ($4k/yr) — positive.
- The deal already cash-flows at list — no discount required.
- Meets the 1% rule at list price ($2k rent vs $195k).
Location & tenants
- Location reads 78/100 on livability (#148 in IL, #2,726 nationally) — a middle-class / working-renter tenant base. Strengths: commute A+, cost of living A+, housing A+; Watch: schools D+, amenities F.
- Rich Twp Hsd 227 (suburban): math 5% / reading 12% proficiency, ranked #577 of 620 in IL (top 93%) — low school quality limits family demand, transient renter base, plan for 1-2y turnover.
- Market conditions: 102 active listings in the ZIP; 20 comparable units currently listed for rent nearby; rentals at typical pace (median 16d on market — plan ~3-4 weeks tenant-placement turnaround); 6,272 units permitted in Cook County in 2024 (4,658 in 5+ unit buildings).
- This rent runs 41% of the median local income ($62k/yr) — at the standard rent-burdened threshold; future hikes will face affordability resistance.
Forward outlook
- Local home prices are declining (-3.0%/yr); year-one equity from $1k of loan paydown is wiped out by about $6k of value loss. Plan a longer hold.
Negotiation context
- Only 1 days on market — expect competitive offers; lowballing is unlikely to land.
- 5 sale attempts since 14y ago with the ask held roughly flat each time — persistent listings suggest the price (not the market) is what's stuck; bring a comps-based counter.
- Current owner paid $90k; list at $195k implies a 117% gain — meaningful room to come down on a strong offer.
Risks & watch-outs
- Watch-outs: built in 1953 — expect roof / HVAC / electrical / plumbing capex.
Questions for the listing agent
- Built in 1953 — when were the roof, HVAC, electrical panel, plumbing, and water heater last replaced?
- Is there a deadline driving the sale (1031 exchange, divorce, estate, relocation)? That informs how much negotiation room exists.
- Schools are D-rated, which usually means shorter tenancies and higher turnover. Who's the typical renter profile here, and what's been the actual vacancy rate?
- The area grade is low — what's the realistic commute time and amenity access for the typical tenant pool here? Any planned neighborhood developments (good or bad) we should know about?
- What's the average days-on-market for RENTAL listings here right now (not sales)? A rising rental-DOM trend means longer vacancies and softer asking-rent achievability than the comps imply.
- What's the recent tenant-quality profile in this submarket — average credit score on applications, eviction rate, late-payment / NSF rate, and stable-employment percentage? A property-management company in the area should have these aggregated.
- How much new for-sale + rental construction is in the pipeline within 1–3 miles? Heavy new supply typically softens prices + rents 12–24 months out; constrained supply supports both.
Investment metrics
- 1% rule
- 1.07% ✓
- Cap rate
- 8.13%
- Cash-on-cash
- 6.56%
- DSCR
- 1.29
- GRM
- 7.8
CMA / ARV
- ARV (on-the-fly)
- $168,268
- Comps found
- 12
Show comp detail 12 sales within ~0.75 mi
| Address | Dist | Beds/Ba | Sqft | Sold | Price | $/sf | Match |
|---|---|---|---|---|---|---|---|
| 245 Miami St | 0.35mi | 3/1.0 | 1,363 (+0%) | 2mo | $139,000 | $102 | 77 |
| 22720 Ridgeway Ave | 0.31mi | 3/1.5 | 1,289 (-5%) | 4mo | $133,000 | $103 | 72 |
| 339 Blackhawk Dr | 0.43mi | 3/2.0 | 1,417 (+4%) | 1mo | $234,200 | $165 | 72 |
| 287 Mohawk St | 0.48mi | 3/1.0 | 1,408 (+4%) | 1mo | $175,000 | $124 | 66 |
| 140 Nashua St | 0.55mi | 3/1.0 | 1,313 (-3%) | 1mo | $103,000 | $78 | 64 |
| 243 Mantua St | 0.41mi | 3/2.0 | 1,200 (-12%) | 3mo | $157,500 | $131 | 59 |
| 165 Nashua St | 0.51mi | 4/2.0 (+1) | 1,443 (+6%) | 3mo | $199,900 | $139 | 58 |
| 13 Mantua Ct | 0.47mi | 3/2.0 | 1,219 (-10%) | 6mo | $139,500 | $114 | 56 |
| 397 Oswego St | 0.74mi | 4/2.0 (+1) | 1,398 (+3%) | 2mo | $199,000 | $142 | 54 |
| 210 Marquette St | 0.75mi | 3/1.0 | 1,269 (-6%) | 0mo | $153,000 | $121 | 50 |
| 223 Miami St | 0.46mi | 3/1.0 | 1,162 (-14%) | 1mo | $166,000 | $143 | 50 |
| 360 Niagara St | 0.72mi | 3/1.0 | 1,231 (-9%) | 0mo | $150,000 | $122 | 46 |
Match score weights: distance 35% · size 25% · config 20% · recency 20%. Top-matched comps best support the ARV.
Projected returns pro-forma
-3.0% appreciation · 3.0% rent growth · sell at horizon
- IRR
- -6.2%
- Equity multiple
- 0.77×
- Total profit
- $-12,550
- Equity at exit
- $29,075
- IRR
- 3.5%
- Equity multiple
- 1.25×
- Total profit
- $13,686
- Equity at exit
- $16,860
Cash invested: $54,600 (down + closing). Projections, not guarantees.
Landlord ↔ Tenant lean methodology
- Overall (STATE)
- 43 Moderately Tenant-Leaning
- State Illinois
- 43 Moderately Tenant-Leaning · D+7
- County
- — inherits STATE
- City
- — inherits STATE
ZIP-level market 60466
- Home prices YoY
- -21.1%
- Active inventory
- 102
- Price-to-rent
- 7.8×
Monthly cashflow live
- Estimated rent
- $2,084 high interval (Pro) →
- Mortgage (P&I)
- −$1,023
- Tax est. 1.5%
- −$244 /mo · $2,925/yr
- Insurance
- −$81
- HOA
- −$0
- Vacancy / Maint / Mgmt
- −$438
- Net cashflow
- $299
Break-even live
UW: 25.0% down · 7.5% · 30yr · 1.5% tax · 5.0% vac · 8.0% maint · 8.0% mgmt
Financing live
Cash to close
- Down payment
- $48,750
- Closing costs
- $5,850
- Reserves months
- —
- Total cash needed
- —
Loan-product check · same deal, 3 products live
Conventional
25% down · 7.5% · 30yr
- Down + closing
- —
- Monthly P&I
- —
- Monthly cashflow
- —
- DSCR
- —
- Eligible?
- —
Personal DTI + credit; lowest rate.
DSCR
20% down · 8.5% · 30yr
- Down + closing
- —
- Monthly P&I
- —
- Monthly cashflow
- —
- DSCR
- —
- Eligible?
- —
No personal income docs; deal must DSCR.
Hard money
10% down · 12.0% · 12mo
- Down + closing
- —
- Monthly P&I
- —
- Monthly cashflow
- —
- DSCR
- —
- Eligible?
- —
Short-term bridge; refi at stabilization.
Rent comps 20 comps
| Address | Beds | Baths | Sqft | Rent | $/sqft | DOM | Units | Dist |
|---|---|---|---|---|---|---|---|---|
| 277 Somonauk St Park Forest, IL | 3.0 | 1.0 | 966 | $2,000 | $2.07 | 3d | 1 | 0.29mi |
| 411 Huron St Park Forest, IL | 3.0 | 1.0 | 1092 | $2,300 | $2.11 | 24d | 1 | 0.43mi |
| 490 Shabbona Dr Park Forest, IL | 3.0 | 1.0 | 1300 | $1,895 | $1.46 | 2d | 1 | 0.47mi |
| 441 Talala St Park Forest, IL | 4.0 | 2.0 | 1740 | $2,500 | $1.44 | 24d | 1 | 0.60mi |
| 235 Tampa St Park Forest, IL | 3.0 | 1.0 | 1092 | $2,000 | $1.83 | 24d | 1 | 0.66mi |
| 194 Monee Rd Park Forest, IL | 3.0 | 1.0 | 1092 | $1,971 | $1.80 | 22d | 1 | 0.76mi |
| 372 Oswego St Park Forest, IL | 4.0 | 1.0 | 1200 | $2,600 | $2.17 | 24d | 1 | 0.79mi |
| 111 Nashua St Park Forest, IL | 4.0 | 1.5 | 1500 | $2,500 | $1.67 | 24d | 1 | 0.83mi |
| 3905 Tower Dr Richton Park, IL | 1.0–2.0 | 1.0–2.0 | 905 | $1,795 | $1.98 | 1d | 19 | 1.00mi |
| 22501 Butterfield Rd Unit 22411-514 Richton Park, IL | 2.0 | 1.5 | 1021 | $1,365 | $1.34 | 7d | 1 | 1.01mi |
| 22501 Butterfield Rd Unit 22411-506 Richton Park, IL | 2.0 | 1.0 | 882 | $1,325 | $1.50 | 7d | 1 | 1.01mi |
| 22501 Butterfield Rd Unit 22400-311 Richton Park, IL | 2.0 | 1.0 | 882 | $1,360 | $1.54 | 7d | 1 | 1.01mi |
| 22501 Butterfield Rd Unit 22415-207 Richton Park, IL | 2.0 | 1.5 | 944 | $1,360 | $1.44 | 7d | 1 | 1.01mi |
| 400 Watseka St Park Forest, IL | 4.0 | 2.0 | 1161 | $2,161 | $1.86 | 16d | 1 | 1.05mi |
| 4014 Euclid Ln Richton Park, IL | 3.0 | 1.0 | 1100 | $2,100 | $1.91 | 12d | 1 | 1.16mi |
| 4014 Euclid Ln Richton Park, IL | 2.0 | 1.0 | 1100 | $2,100 | $1.91 | 7d | 1 | 1.16mi |
| 4014 Euclid Ln Richton Park, IL | 2.0 | 1.0 | 1100 | $2,100 | $1.91 | 22d | 1 | 1.16mi |
| 4200 Arlington Dr Richton Park, IL | 3.0 | 2.0 | 1595 | $2,061 | $1.29 | 19d | 1 | 1.16mi |
| 19 Apple Ln Park Forest, IL | 3.0 | 1.0 | 1541 | $2,300 | $1.49 | 12d | 1 | 1.31mi |
| 4561 Heartland Dr Unit 3F Richton Park, IL | 2.0 | 1.0 | 1000 | $1,350 | $1.35 | 24d | 1 | 1.42mi |
Listing history 31 events
-
2026-06-18statusdays on market $195,000 Active 1 DOM
-
2026-06-17days on market $195,000 Contingent - Continue to Show 28 DOM
-
2026-06-16days on market $195,000 Contingent - Continue to Show 27 DOM
-
2026-06-15days on market $195,000 Contingent - Continue to Show 26 DOM
-
2026-06-13days on market $195,000 Contingent - Continue to Show 24 DOM
-
2026-06-09days on market $195,000 Contingent - Continue to Show 20 DOM
-
2026-06-08days on market $195,000 Contingent - Continue to Show 19 DOM
-
2026-06-07days on market $195,000 Contingent - Continue to Show 18 DOM
-
2026-06-04days on market $195,000 Contingent - Continue to Show 15 DOM
-
2026-06-03days on market $195,000 Contingent - Continue to Show 14 DOM
-
2026-06-02days on market $195,000 Contingent - Continue to Show 13 DOM
-
2026-06-01days on market $195,000 Contingent - Continue to Show 12 DOM
-
2026-05-31days on market $195,000 Contingent - Continue to Show 11 DOM
-
2026-05-21$195,000 Active
-
2024-07-30historical Contingent - Continue to Show
-
2024-07-24historical
-
2024-06-14Active
-
2024-05-13historical Contingent - Continue to Show
-
2024-05-09historical
-
2024-04-04Active
-
2023-12-13soldstatus $90,000
-
2023-11-22soldstatus $90,000 Closed
-
2023-11-02historical Contingent - Continue to Show
-
2023-10-27$89,873 Active
-
2013-01-22soldstatus $28,900 Closed Sale
-
2013-01-08status Pending
-
2012-12-11price $29,900 Price Change
-
2012-11-13price $35,900 Price Change
-
2012-10-17price $39,900 Price Change
-
2012-09-19$46,900 New
-
1987-01-01soldstatus $50,250
ⓘ Source: listings_history table (triggers on properties + properties_extension) + one-shot
backfill from property_details.listing_events for pre-trigger history.
Climate risk First Street
- Flood 1/10 Low FEMA zone X (unshaded) · 0% chance over 30 yrs
- Wildfire 1/10 Low
- Heat 3/10 Moderate 7 d/yr ≥101°F today · 16 d/yr by 30 yrs out
- Wind 2/10 Low
- Air quality 2/10 Low 1 unhealthy d/yr today · 1 by 30 yrs out
Nearby sold comps map
Loading sold comps map…
Walkable amenities ~0.75 mi
Loading nearby amenities…
Taxation est. · year 1
- Rental income
- $25,005
- − Mortgage interest
- −$10,923
- − Property taxes
- −$2,925
- − Insurance
- −$975
- − Repairs & maintenance
- −$2,000
- − Management
- −$2,000
- − Depreciation
- −$5,673
- Taxable income
- $509
- Est. tax owed @ 24.0%
- −$122
- After-tax cash flow
- $3,461/yr
For passive investors: Depreciation is non-cash, so a rental often shows a tax loss while cash-flowing — sheltering income. Rental losses are passive: they offset passive income freely, and up to $25,000/yr can offset ordinary (W-2) income if you actively participate and your MAGI is under $100k (phasing out to $0 by $150k); unused losses carry forward. On sale, claimed depreciation is recaptured at up to 25%, and gains may owe capital-gains tax (a 1031 exchange can defer both). Figures are a year-1 estimate at your 24.0% rate — not tax advice; consult a CPA.
Schools (NCES district)
- District
- Rich Twp Hsd 227
- NCES district ID
- 1733420
- Math proficiency
- 5% ▼ -3.00%
- Reading proficiency
- 12% ▬ 0.00%
- Median HH income
- $56,056
- Composite
- 8.93/100
- National rank
- #9885
- State rank
- #577 of 620 in IL
Livability — Park Forest
- Score
- 78/100
- State rank
- #148
- US rank
- #2726
Category grades
Schools grade is shown separately in the Schools card above.
Census & demographics
- Census place
- Park Forest, IL
- County
- Cook County · 4,486,803 people
- City population
- 21,461
- Metro
- Chicago-Naperville-Elgin, IL-IN-WI
- Population (ZIP)
- 21,461
- Household income
- $61,654
- Rent vs Own
- Severe rent burden
- 900.0
Population outlook (Cook County) Hauer SSP2
- Today (2025)
- 5,347,519 people
- By 2030
- 5,357,703 · +0.2%
- By 2040
- 5,324,924 · -0.4%
- By 2050
- 5,230,762 · -2.2%
- By 2075
- 4,785,735 · -10.5%
- By 2100
- 4,188,836 · -21.7%
Race, ethnicity, and origin ACS 2023
- Neighborhood character
- Predominantly Black (69%)
- Race & ethnicity
- Black 69% White 19% Hispanic / Latino 9% Two or more races 3% Native American 1%
- Hispanic origin (detail)
- Mexican 8%
- Common ancestry
- Romanian 2% Iranian 1% Italian 1%
- Foreign-born
- 6% · Canada
- Languages at home
- 90% English-only · Spanish 7% French/Haitian/Cajun 1% Russian/Polish/Slavic 1%
Political lean MEDSL · Cook
- 2024 margin
- Solid D (+42.0) · D 70.4% · R 28.4% · Other 1.2%
- 2008→2024 swing
- -11.4pp toward R · 2008: 53.4pp · 2024: 42.0pp
- All cycles
- 2024: D+42.0 2020: D+50.3 2016: D+53.0 2012: D+49.4 2008: D+53.4
Not yet ingested
- Civics
- —
Market trends
- HPI YoY
- ▼ -58.87%
- Current HPI
- 219.9692
- Rent YoY
- —
- Metro
- Chicago-Naperville-Elgin, IL-IN-WI
- State GDP YoY
- ▲ 1.59%
- F500 in state
- 60
Industry mix (Fortune 500 HQ in IL)
| Industry | F500 HQs | Revenue |
|---|---|---|
| Insurance | 4 | $201B |
|
||
| Consumer Goods | 4 | $87B |
|
||
| Industrial Machinery | 3 | $64B |
|
||
| Healthcare | 2 | $55B |
|
||
| Retail / Pharmacy | 1 | $148B |
|
||
| Agriculture / Food | 1 | $86B |
|
||
Price history
+288.1% since first listed18 events — show timeline
- 2026-05-21 Listed $195,000 MRED as Distributed by MLS Grid
- 2024-07-30 Contingent — MRED as Distributed by MLS Grid
- 2024-07-24 Listing Removed — MRED as Distributed by MLS Grid
- 2024-06-14 Listed — MRED as Distributed by MLS Grid
- 2024-05-13 Contingent — MRED as Distributed by MLS Grid
- 2024-05-09 Listing Removed — MRED as Distributed by MLS Grid
- 2024-04-04 Listed — MRED as Distributed by MLS Grid
- 2023-12-13 Sold (Public Records) $90,000 Public Records
- 2023-11-22 Sold (MLS) $90,000 MRED as Distributed by MLS Grid
- 2023-11-02 Contingent — MRED as Distributed by MLS Grid
- 2023-10-27 Listed $89,873 MRED as Distributed by MLS Grid
- 2013-01-22 Sold (MLS) $28,900 MRED as Distributed by MLS Grid
- 2013-01-08 Pending — MRED as Distributed by MLS Grid
- 2012-12-11 Price Changed $29,900 MRED as Distributed by MLS Grid
- 2012-11-13 Price Changed $35,900 MRED as Distributed by MLS Grid
- 2012-10-17 Price Changed $39,900 MRED as Distributed by MLS Grid
- 2012-09-19 Listed $46,900 MRED as Distributed by MLS Grid
- 1987-01-01 Sold (Public Records) $50,250 Public Records
Property tax history
+6.1%/yrLatest (2023): $10,472 · -4.6% YoY. Source: county tax records.
Cash-flow waterfall
monthlySold comps — $/sqft
last 12 mo · ≤1 miLoading sold comps…