1829 N A St #51 · Lake Worth Beach, FL
Flood risk 1/10 · Minimal
- FEMA flood zone
- X (unshaded)
- Chance of flooding over 30 yrs
- 0.0%
- Est. flood insurance / yr
- $507 – $1,088
Fire risk 1/10 · Minimal
- Est. fire insurance / yr
- $947 – $1,759
Heat risk 10/10 · Severe
- Hot days now (above 105°F)
- 7 days/yr
- Hot days in 30 yrs
- 25 days/yr
Wind risk 10/10 · Severe
- Chance of severe wind over 30 yrs
- 99.0%
Air-quality risk 2/10 · Minimal
- Unhealthy air days now
- 0 days/yr
- Unhealthy air days in 30 yrs
- 2 days/yr
Risk factors via First Street. Map © Google.
Why this score? — see what drove the D grade
The composite is a weighted blend of 9 inputs, each scored 0–100. Each bar is that input's sub-score; the figure is the points it added to the 100-point composite (weight × sub-score).
- 1% rule +10.0/10.0
- Cash flow +9.9/30.0
- ARV discount +7.5/15.0
- Schools +4.3/10.0
- Rent growth +3.4/5.0
- DSCR +2.8/10.0
- Livability +2.5/5.0
- Condition / age +2.5/5.0
- Appreciation +0.0/10.0
$120,000
🖨 Deal sheet (PDF) 📄 Offer letter ✓ Due diligence
Listing remarks MLS
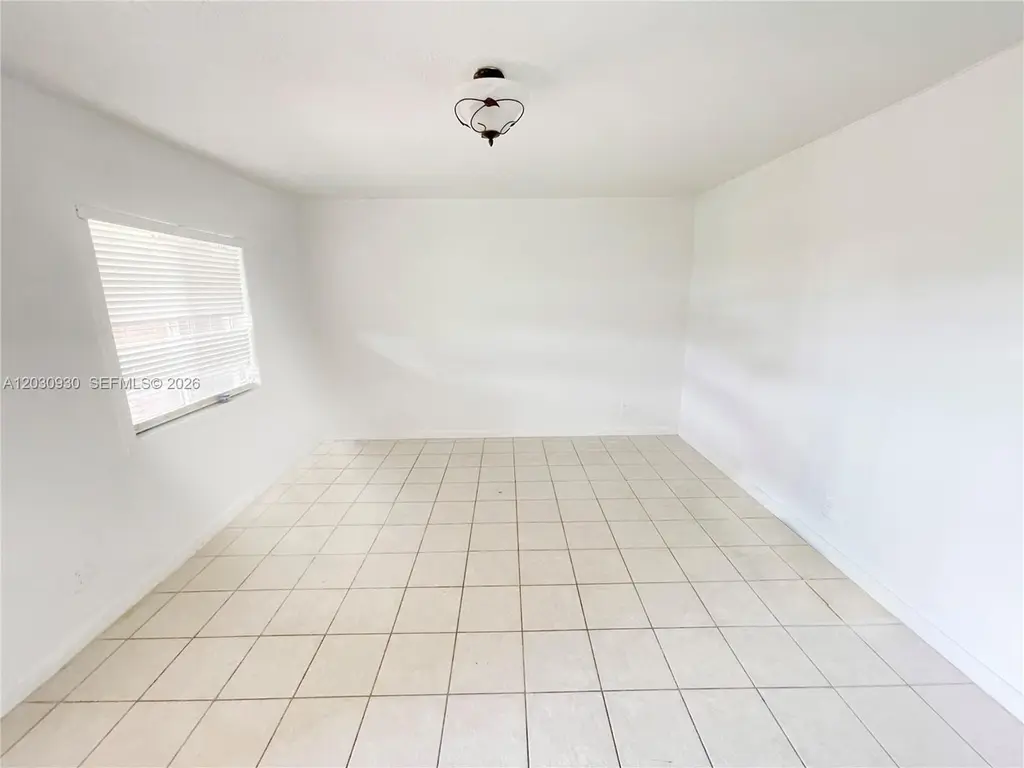
SOLD AS-IS. SMALL COMMUNITY WITH POOL. FIRST FLOOR 2/1 WITH CENTRAL AC AND ALL TILE FLOORS.
Key facts
- Near schools
- Tile floors
- Near shopping
Tags
Property features AI
Finance
- Financial info: Pets not allowed
- HOA & community: Monthly association fee of $615; Association covers water, sewer, trash and security
Exterior
- Parking: One parking space
- Home design: 2-story building; Entry located on level 1
- Construction: Block construction; Resale property
- Exterior features: Property is attached; Faces north; Entry at level 1
Interior
- Kitchen: Refrigerator
- Flooring: Tile flooring
- Bathrooms: 1 full bathroom
- Heating & cooling: Central heating; Central air conditioning
- Interior features: Unfurnished; Other interior features
Neighborhood map
What this means for you Summary
Snapshot
- This is a 2-bed/1.0-bath condo listed at $120k.
Deal economics
- At list price, monthly cash flow is $-75 ($-905/yr) — negative.
- To cash-flow at today's rent, offer at most $107k (11.1% below list).
- Meets the 1% rule at list price ($2k rent vs $120k).
- Recommended offer: $107k (11.1% below list) — sets the bar for cash-flow.
Location & tenants
- Location reads: area grade D — affects rentability + tenant quality, not the cash-flow math above.
- Palm Beach (suburban): math 46% / reading 53% proficiency, ranked #34 of 73 in FL (top 47%) — families likely to look elsewhere, expect single-tenant / working-renter base with shorter leases.
- Zoned schools: North Grade K-8 (math 40% / reading 42%, grade F, #1,454 of 2,144 statewide, top 69%, 735 students, 63% FRL); Lake Worth Community Middle (math 17% / reading 23%, grade F, #558 of 571 statewide, top 98%, 1,249 students, 75% FRL); Lake Worth High School (math 16% / reading 27%, grade F, #546 of 667 statewide, top 82%, 2,683 students, 71% FRL) — zoned schools average 70% FRL vs 52% district-wide (18 pts higher); higher-poverty schools than district average — tighter screening recommended.
- Zoned-school proficiency averages 28% at this address vs 50% district-wide (-22 pts) — the specific schools serving this property underperform the Palm Beach average; the district grade overstates school quality for this exact location.
- Market conditions: Rents rising (+3.5%/yr); 250 active listings in the ZIP; 37 comparable units currently listed for rent nearby; rentals at typical pace (median 26d on market — plan ~3-4 weeks tenant-placement turnaround); 3,974 units permitted in Palm Beach County in 2024 (1,012 in 5+ unit buildings).
- This rent runs 35% of the median local income ($62k/yr) — at the standard rent-burdened threshold; future hikes will face affordability resistance.
Forward outlook
- Local home prices are declining (-3.0%/yr); year-one equity from $830 of loan paydown is wiped out by about $4k of value loss. Plan a longer hold.
- Palm Beach County population projected at +30% by 2050 — long-run rental-demand tailwind backs the buy-and-hold thesis.
Negotiation context
- It's been on market 17 days — a 2% lower offer ($118k) is reasonable based on typical stale-listing flexibility.
- 5 sale attempts since 15y ago with the ask held roughly flat each time — persistent listings suggest the price (not the market) is what's stuck; bring a comps-based counter.
- Current owner paid $70k; list at $120k implies a 71% gain — meaningful room to come down on a strong offer.
Risks & watch-outs
- Watch-outs: HOA is 34% of rent.
- Climate carrying-cost: severe wind risk, 99% chance of damaging wind over 30y; extreme-heat days projected 7→25/yr by 2055 (HVAC capex compounding) — expect insurance premiums to compound above CPI over the hold.
Questions for the listing agent
- What do current leases actually rent for vs. the listed asking? Can we see a recent rent roll and the last 12 months of T-12 income?
- Built in 1971 — when were the roof, HVAC, electrical panel, plumbing, and water heater last replaced?
- What does the HOA fee cover, when was the last increase, and are there any pending special assessments or reserve-fund shortfalls?
- Any open or pending special assessments — roof, HVAC, plumbing, elevator, façade? What's the per-unit balance and payoff schedule, and is the seller paying it off at close or rolling it to the buyer?
- Is there a deadline driving the sale (1031 exchange, divorce, estate, relocation)? That informs how much negotiation room exists.
- The area grade is low — what's the realistic commute time and amenity access for the typical tenant pool here? Any planned neighborhood developments (good or bad) we should know about?
- What's the average days-on-market for RENTAL listings here right now (not sales)? A rising rental-DOM trend means longer vacancies and softer asking-rent achievability than the comps imply.
- What's the recent tenant-quality profile in this submarket — average credit score on applications, eviction rate, late-payment / NSF rate, and stable-employment percentage? A property-management company in the area should have these aggregated.
- How much new apartment / multifamily construction is in the pipeline within 1–3 miles? Heavy new supply (>2% of stock underway) typically softens rents 12–24 months out; light construction supports rent growth.
Investment metrics
- 1% rule
- 1.50% ✓
- Cap rate
- 5.54%
- Cash-on-cash
- -2.69%
- DSCR
- 0.88
- GRM
- 5.6
CMA / ARV
No comps found within radius.
Projected returns pro-forma
-3.0% appreciation · 3.53% rent growth · sell at horizon
- IRR
- -19.2%
- Equity multiple
- 0.32×
- Total profit
- $-22,847
- Equity at exit
- $17,892
- IRR
- -9.2%
- Equity multiple
- 0.40×
- Total profit
- $-20,306
- Equity at exit
- $10,375
Cash invested: $33,600 (down + closing). Projections, not guarantees.
Landlord ↔ Tenant lean methodology
- Overall (STATE)
- 87 Strongly Landlord-Friendly
- State Florida
- 87 Strongly Landlord-Friendly · R+3
- County
- — inherits STATE
- City
- — inherits STATE
ZIP-level market 33460
- Rents YoY
- 3.5%
- Active inventory
- 250
- Price-to-rent
- 5.6×
Monthly cashflow live
- Estimated rent
- $1,798 high interval (Pro) →
- Mortgage (P&I)
- −$629
- Tax from tax record
- −$200 /mo · $2,395/yr
- Insurance
- −$50
- HOA
- −$617
- Vacancy / Maint / Mgmt
- −$378
- Net cashflow
- $-75
Break-even live
Sensitivity live
| Price | -10% $-7 | -5% $-41 | +0% $-75 | +5% $-109 | +10% $-143 |
|---|---|---|---|---|---|
| Rent | -10% $-217 | -5% $-146 | +0% $-75 | +5% $-4 | +10% $67 |
| Rate | -1.0pp $-15 | -0.5pp $-45 | base $-75 | +0.5pp $-106 | +1.0pp $-138 |
UW: 25.0% down · 7.5% · 30yr · 1.5% tax · 5.0% vac · 8.0% maint · 8.0% mgmt
Financing live
Cash to close
- Down payment
- $30,000
- Closing costs
- $3,600
- Reserves months
- —
- Total cash needed
- —
Loan-product check · same deal, 3 products live
Conventional
25% down · 7.5% · 30yr
- Down + closing
- —
- Monthly P&I
- —
- Monthly cashflow
- —
- DSCR
- —
- Eligible?
- —
Personal DTI + credit; lowest rate.
DSCR
20% down · 8.5% · 30yr
- Down + closing
- —
- Monthly P&I
- —
- Monthly cashflow
- —
- DSCR
- —
- Eligible?
- —
No personal income docs; deal must DSCR.
Hard money
10% down · 12.0% · 12mo
- Down + closing
- —
- Monthly P&I
- —
- Monthly cashflow
- —
- DSCR
- —
- Eligible?
- —
Short-term bridge; refi at stabilization.
Rent comps 37 comps
| Address | Beds | Baths | Sqft | Rent | $/sqft | DOM | Units | Dist |
|---|---|---|---|---|---|---|---|---|
| 1715 N Dixie Hwy Lake Worth Beach, FL | 1.0–3.0 | 1.0–2.0 | 1014 | $2,570 | $2.53 | 26d | 11 | 0.48mi |
| 1601 N Dixie Hwy Lake Worth Beach, FL | 1.0–2.0 | 1.0–2.0 | 831 | $2,385 | $2.87 | 1d | 6 | 0.48mi |
| 1201 N E St Unit 2 Lake Worth Beach, FL | 1.0 | 1.0 | 600 | $1,500 | $2.50 | 26d | 1 | 0.59mi |
| 1502 N J St Unit 2 Lake Worth Beach, FL | 1.0 | 1.0 | 500 | $1,850 | $3.70 | 16d | 1 | 0.65mi |
| 1118 N H St Unit 15 Lake Worth Beach, FL | 1.0 | 1.0 | 483 | $1,550 | $3.21 | 15d | 1 | 0.74mi |
| 920 11th Ave N Unit 912 Lake Worth Beach, FL | 1.0 | 1.0 | 600 | $1,100 | $1.83 | 22d | 1 | 0.77mi |
| 912 11th Ave N Lake Worth Beach, FL | 1.0 | 1.0 | 600 | $1,100 | $1.83 | 22d | 1 | 0.78mi |
| 1755 Forest Hill Blvd Lake Clarke Shores, FL | 1.0 | 1.0 | 662 | $1,595 | $2.41 | 9d | 1 | 0.84mi |
| 801 N H St #1 Lake Worth Beach, FL | 1.0 | 1.0 | 600 | $1,550 | $2.58 | 26d | 1 | 0.96mi |
| 1111 N Federal Hwy #6 Lake Worth Beach, FL | 1.0 | 1.0 | 494 | $1,550 | $3.14 | 26d | 1 | 1.00mi |
| 1111 N Federal Hwy #5 Lake Worth Beach, FL | 1.0 | 1.0 | 494 | $1,450 | $2.94 | 19d | 1 | 1.00mi |
| 817 N J St Lake Worth, FL | 2.0 | 1.0 | 652 | $2,000 | $3.07 | 26d | 1 | 1.01mi |
| 3300 Boutwell Rd Lake Worth Beach, FL | 1.0–2.0 | 1.0–2.0 | 765 | $2,720 | $3.56 | 26d | 1 | 1.03mi |
| 504 9th Ave N Unit 508 Lake Worth Beach, FL | 1.0 | 1.0 | 625 | $1,650 | $2.64 | 22d | 1 | 1.08mi |
| 2566 Garden Dr S Lake Worth Beach, FL | 1.0 | 1.0 | 744 | $1,395 | $1.88 | 26d | 1 | 1.08mi |
| 3045 Springfield Ln Unit 3043 Lake Worth Beach, FL | 1.0 | 1.0 | 500 | $1,625 | $3.25 | 1d | 1 | 1.13mi |
| 914 N Federal Hwy Unit 3 Lake Worth Beach, FL | 1.0 | 1.0 | 609 | $1,800 | $2.96 | 26d | 1 | 1.13mi |
| 721 N M St Lake Worth Beach, FL | 1.0 | 1.0 | 450 | $1,800 | $4.00 | 26d | 1 | 1.17mi |
| 702 N L St Lake Worth, FL | 1.0 | 1.0 | 643 | $1,474 | $2.29 | 7d | 2 | 1.18mi |
| 417 N E St Unit 39 Lake Worth Beach, FL | 1.0 | 1.0 | 700 | $1,550 | $2.21 | 26d | 1 | 1.19mi |
| 417 N E St Unit 36 Lake Worth Beach, FL | 1.0 | 1.0 | 650 | $1,550 | $2.38 | 13d | 1 | 1.19mi |
| 413 N E St Lake Worth Beach, FL | 2.0 | 1.0 | 646 | $2,000 | $3.10 | 26d | 1 | 1.20mi |
| 625 N M St #1 Lake Worth Beach, FL | 1.0 | 1.0 | 640 | $1,600 | $2.50 | 26d | 1 | 1.22mi |
| 2724 Garden Dr S #207 Lake Worth, FL | 1.0 | 1.0 | 744 | $1,850 | $2.49 | 0d | 1 | 1.24mi |
| 526 6th Ave N Unit 519 Lake Worth Beach, FL | 1.0 | 1.0 | 700 | $1,395 | $1.99 | 23d | 1 | 1.26mi |
| 509 6th Ave N Unit 3B Lake Worth, FL | 1.0 | 1.0 | 540 | $1,595 | $2.95 | 26d | 1 | 1.28mi |
| 626 N Federal Hwy Unit 3 Lake Worth Beach, FL | 1.0 | 1.0 | 640 | $1,600 | $2.50 | 26d | 1 | 1.29mi |
| 417 N K St Unit 1A Lake Worth Beach, FL | 1.0 | 1.0 | 620 | $1,550 | $2.50 | 7d | 1 | 1.32mi |
| 317 N H St Unit B Lake Worth Beach, FL | 1.0 | 1.0 | 420 | $1,200 | $2.86 | 26d | 1 | 1.32mi |
| 430 N L St Lake Worth Beach, FL | 1.0 | 1.0 | 523 | $2,475 | $4.73 | 26d | 1 | 1.34mi |
| 430 N L St Lake Worth Beach, FL | 1.0 | 1.0 | 523 | $2,190 | $4.19 | 20d | 1 | 1.34mi |
| 223 N E St Unit 4 Lake Worth Beach, FL | 1.0 | 1.0 | 650 | $1,695 | $2.61 | 26d | 1 | 1.34mi |
| 312 N H St Unit A Lake Worth Beach, FL | 2.0 | 2.0 | 594 | $2,200 | $3.70 | 26d | 1 | 1.35mi |
| 325 N L St Lake Worth Beach, FL | 2.0 | 1.0 | 500 | $1,600 | $3.20 | 26d | 1 | 1.41mi |
| 3260 Hi St Unit B Lake Worth Beach, FL | 1.0 | 1.0 | 400 | $1,700 | $4.25 | 26d | 1 | 1.45mi |
| 1307 Lucerne Ave Unit 1 Lake Worth Beach, FL | 1.0 | 1.0 | 528 | $1,325 | $2.51 | 7d | 1 | 1.49mi |
| 1307 Lucerne Ave Unit 1 Lake Worth Beach, FL | 1.0 | 1.0 | 528 | $1,400 | $2.65 | 26d | 1 | 1.49mi |
HOA detail condo
- Monthly dues
- $617 · $7,404/yr
- Likely covers
- pool
- Assessments
- None detected in remarks — confirm with the listing agent.
Listing history 26 events
-
2026-06-21days on market $120,000 Active 17 DOM
-
2026-06-18days on market $120,000 Active 14 DOM
-
2026-06-17days on market $120,000 Active 13 DOM
-
2026-06-16days on market $120,000 Active 12 DOM
-
2026-06-15days on market $120,000 Active 11 DOM
-
2026-06-13days on market $120,000 Active 9 DOM
-
2026-06-09days on market $120,000 Active 5 DOM
-
2026-06-08days on market $120,000 Active 4 DOM
-
2026-06-07days on market $120,000 Active 3 DOM
-
2026-06-03days on market $120,000 Active 166 DOM
-
2026-06-01days on market $120,000 Active 164 DOM
-
2026-05-31days on market $120,000 Active 163 DOM
-
2025-12-19$120,000 Active
-
2018-08-17soldstatus $70,000
-
2016-03-05historical
-
2015-07-08status Active
-
2015-06-14status Pending
-
2015-03-17price $45,900
-
2015-03-17price $35,900
-
2015-03-10price $39,000
-
2015-03-10status Active
-
2015-03-07status Pending
-
2015-03-04$31,000 Active
-
2011-09-30soldstatus $15,000 91-char remark
Show marketing remark (91 chars)
SOLD AS-IS. SMALL COMMUNITY WITH POOL. FIRST FLOOR 2/1 WITH CENTRAL AC AND ALL TILE FLOORS.
-
2011-09-01historical 91-char remark
Show marketing remark (91 chars)
SOLD AS-IS. SMALL COMMUNITY WITH POOL. FIRST FLOOR 2/1 WITH CENTRAL AC AND ALL TILE FLOORS.
-
2011-05-13$18,900 91-char remark
Show marketing remark (91 chars)
SOLD AS-IS. SMALL COMMUNITY WITH POOL. FIRST FLOOR 2/1 WITH CENTRAL AC AND ALL TILE FLOORS.
ⓘ Source: listings_history table (triggers on properties + properties_extension) + one-shot
backfill from property_details.listing_events for pre-trigger history.
Tax reassessment forecast FL · Resets to sale price
- Current annual tax
- $2,395 · $200/mo
- Projected year-2 tax
- $2,395 · $200/mo
- Expected delta
- $0/yr ($0/mo · 0.0%)
ⓘ Screening estimate from a state-policy table — verify with the county assessor before closing.
Climate risk First Street
- Flood 1/10 Low FEMA zone X (unshaded) · 0% chance over 30 yrs
- Wildfire 1/10 Low
- Heat 10/10 Extreme 7 d/yr ≥105°F today · 25 d/yr by 30 yrs out
- Wind 10/10 Extreme 99% chance of damaging wind over 30 yrs
- Air quality 2/10 Low 0 unhealthy d/yr today · 2 by 30 yrs out
Nearby sold comps map
Loading sold comps map…
Walkable amenities ~0.75 mi
Loading nearby amenities…
Taxation est. · year 1
- Rental income
- $21,577
- − Mortgage interest
- −$6,722
- − Property taxes
- −$2,395
- − Insurance
- −$600
- − Repairs & maintenance
- −$1,726
- − Management
- −$1,726
- − HOA
- −$7,404
- − Depreciation
- −$3,491
- Taxable loss
- −$2,487
- Est. tax savings @ 24.0%
- +$597
- After-tax cash flow
- $-308/yr
For passive investors: Depreciation is non-cash, so a rental often shows a tax loss while cash-flowing — sheltering income. Rental losses are passive: they offset passive income freely, and up to $25,000/yr can offset ordinary (W-2) income if you actively participate and your MAGI is under $100k (phasing out to $0 by $150k); unused losses carry forward. On sale, claimed depreciation is recaptured at up to 25%, and gains may owe capital-gains tax (a 1031 exchange can defer both). Figures are a year-1 estimate at your 24.0% rate — not tax advice; consult a CPA.
Schools (NCES district)
- District
- Palm Beach
- NCES district ID
- 1201500
- Math proficiency
- 46% ▼ -16.00%
- Reading proficiency
- 53% ▼ -4.00%
- Median HH income
- $53,943
- Composite
- 42.72/100
- National rank
- #3160
- State rank
- #34 of 73 in FL
Livability — Lake Worth Beach
No livability data for this city. (Only ~50 U.S. cities are tracked.)
Census & demographics
- Census place
- Lake Worth Beach, FL
- County
- Palm Beach County · 1,438,312 people
- City population
- 129,577
- Metro
- Miami-Fort Lauderdale-Pompano Beach, FL
- Population (ZIP)
- 37,795
- Household income
- $62,090
- Rent vs Own
- Severe rent burden
- 2429.0
Population outlook (Palm Beach County) Hauer SSP2
- Today (2025)
- 1,637,487 people
- By 2030
- 1,743,255 · +6.5%
- By 2040
- 1,948,712 · +19.0%
- By 2050
- 2,132,979 · +30.3%
- By 2075
- 2,530,027 · +54.5%
- By 2100
- 2,706,979 · +65.3%
Race, ethnicity, and origin ACS 2023
- Neighborhood character
- Diverse neighborhood (Simpson 0.64)
- Race & ethnicity
- Hispanic / Latino 49% White 30% Two or more races 21% Black 17%
- Hispanic origin (detail)
- Mexican 5% Puerto Rican 5% Cuban 5% Dominican 2%
- Common ancestry
- Hispanic 8% Lithuanian 2% Slovak 1%
- Foreign-born
- 40% · Canada, Jamaica
- Languages at home
- 44% English-only · Spanish 42% French/Haitian/Cajun 9% Other Indo-European 2%
Political lean MEDSL · Palm Beach
- 2024 margin
- Toss-up / Even · D 50.0% · R 49.2%
- 2008→2024 swing
- -22.1pp toward R · 2008: 22.9pp · 2024: 0.8pp
- All cycles
- 2024: D+0.8 2020: D+12.8 2016: D+15.3 2012: D+17.0 2008: D+22.9
Not yet ingested
- Civics
- —
Market trends
- HPI YoY
- ▼ -345.65%
- Current HPI
- 484.2793
- Rent YoY
- ▲ 3.53%
- Metro
- Miami-Fort Lauderdale-Pompano Beach, FL
- State GDP YoY
- ▲ 3.28%
- F500 in state
- 36
Industry mix (Fortune 500 HQ in FL)
| Industry | F500 HQs | Revenue |
|---|---|---|
| Industrial Technology | 2 | $29B |
|
||
| Insurance | 2 | $17B |
|
||
| Retail | 1 | $60B |
|
||
| Technology Distribution | 1 | $58B |
|
||
| Homebuilding | 1 | $35B |
|
||
| Technology Manufacturing | 1 | $35B |
|
||
Price history
+534.9% since first listed14 events — show timeline
- 2025-12-19 Listed $120,000 MARMLS
- 2018-08-17 Sold (Public Records) $70,000 Public Records
- 2016-03-05 Listing Removed — Beaches MLS
- 2015-07-08 Relisted — Beaches MLS
- 2015-06-14 Pending — Beaches MLS
- 2015-03-17 Price Changed $35,900 Beaches MLS
- 2015-03-17 Price Changed $45,900 Beaches MLS
- 2015-03-10 Relisted — Beaches MLS
- 2015-03-10 Price Changed $39,000 Beaches MLS
- 2015-03-07 Pending — Beaches MLS
- 2015-03-04 Listed $31,000 Beaches MLS
- 2011-09-30 Sold (MLS) $15,000 Beaches MLS
- 2011-09-01 Listing Removed — Beaches MLS
- 2011-05-13 Listed $18,900 Beaches MLS
Property tax history
+20.6%/yrLatest (2025): $2,395 · -0.0% YoY. Source: county tax records.
Cash-flow waterfall
monthlySold comps — $/sqft
last 12 mo · ≤1 miLoading sold comps…