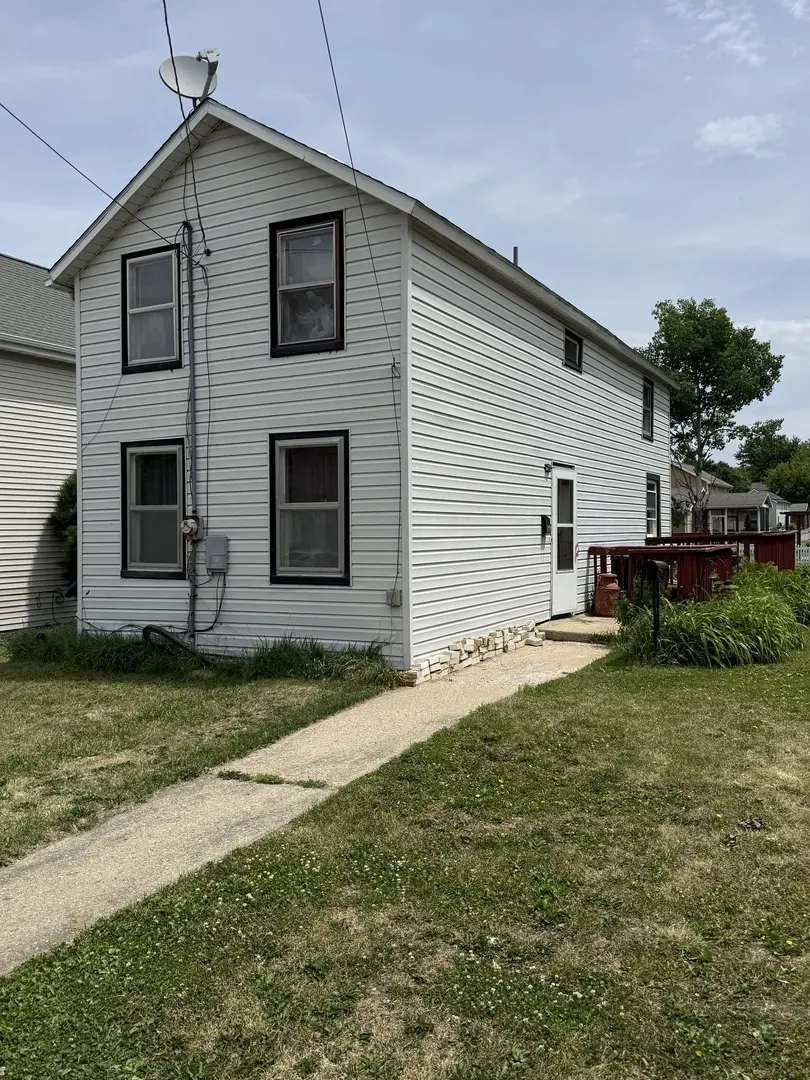
404 S Congress Ave · Polo, IL
Flood risk 1/10 · Minimal
- FEMA flood zone
- X (unshaded)
- Chance of flooding over 30 yrs
- 0.0%
- Est. flood insurance / yr
- $507 – $1,088
Fire risk 1/10 · Minimal
- Est. fire insurance / yr
- $804 – $1,492
Heat risk 2/10 · Minimal
- Hot days now (above 103°F)
- 7 days/yr
- Hot days in 30 yrs
- 15 days/yr
Wind risk 2/10 · Minimal
- Chance of severe wind over 30 yrs
- —
Air-quality risk 2/10 · Minimal
- Unhealthy air days now
- 1 days/yr
- Unhealthy air days in 30 yrs
- 2 days/yr
Risk factors via First Street. Map © Google.
Why this score? — see what drove the B- grade
The composite is a weighted blend of 9 inputs, each scored 0–100. Each bar is that input's sub-score; the figure is the points it added to the 100-point composite (weight × sub-score).
- Cash flow +30.0/30.0
- 1% rule +10.0/10.0
- DSCR +10.0/10.0
- ARV discount +7.5/15.0
- Livability +3.3/5.0
- Schools +2.9/10.0
- Rent growth +2.5/5.0
- Condition / age +2.5/5.0
- Appreciation +0.0/10.0
$20,000
🖨 Deal sheet (PDF) 📄 Offer letter ✓ Due diligence
Listing remarks
Contractor special in Polo! This 2-bedroom, 1-bath two-story home offers 950 sq ft of space, a gravel driveway, and plenty of potential for the right buyer. Appliances are included as-is. A great opportunity for someone ready to take on a project and create something new.
Key facts
- 7,500 sq ft lot
- Parking
Neighborhood map
What this means for you Summary
Snapshot
- This is a 2-bed/1.0-bath single-family listed at $20k.
Deal economics
- At list price, monthly cash flow is $260 ($3k/yr) — positive.
- The deal already cash-flows at list — no discount required.
- Meets the 1% rule at list price ($575 rent vs $20k).
Location & tenants
- Location reads 66/100 on livability (#548 in IL) — a middle-class / working-renter tenant base. Strengths: crime A+, cost of living A+, housing A+; Watch: amenities F, commute F, employment D-.
- Polo CUSD 222 (rural): math 27% / reading 40% proficiency, ranked #210 of 620 in IL (top 34%) — families likely to look elsewhere, expect single-tenant / working-renter base with shorter leases.
- Zoned schools: Centennial Elem School (math 27% / reading 37%, grade F, #586 of 2,056 statewide, top 31%, 279 students, 0% FRL); Aplington Middle School (math 27% / reading 52%, grade F, #146 of 665 statewide, top 22%, 115 students, 0% FRL); Polo Comm High School (math 15% / reading 15%, grade F, #462 of 693 statewide, top 68%, 195 students, 0% FRL) — zoned schools average 0% FRL vs 36% district-wide (36 pts lower); this property's tenant base skews higher-income than the district average.
- Market conditions: 19 active listings in the ZIP; 1 comparable units currently listed for rent nearby; 113 units permitted in Ogle County in 2024 (67 in 5+ unit buildings).
Forward outlook
- Local home prices are declining (-3.0%/yr); year-one equity from $138 of loan paydown is wiped out by about $600 of value loss. Plan a longer hold.
- Ogle County population projected at -24% by 2050 — secular population decline; favor cash flow + early exit over multi-decade hold.
- At projected returns (-3.0% appreciation + 3.0% rent growth), your $6k cash investment doubles in ~3 years — after that, you're playing with house money.
Negotiation context
- Only 0 days on market — expect competitive offers; lowballing is unlikely to land.
Risks & watch-outs
- Watch-outs: property tax is 4.9% of price.
Questions for the listing agent
- Property tax is high relative to price — has the assessment been appealed recently, and will the sale trigger a re-assessment?
- Is there a deadline driving the sale (1031 exchange, divorce, estate, relocation)? That informs how much negotiation room exists.
- Schools are D-rated, which usually means shorter tenancies and higher turnover. Who's the typical renter profile here, and what's been the actual vacancy rate?
- What's the average days-on-market for RENTAL listings here right now (not sales)? A rising rental-DOM trend means longer vacancies and softer asking-rent achievability than the comps imply.
- What's the recent tenant-quality profile in this submarket — average credit score on applications, eviction rate, late-payment / NSF rate, and stable-employment percentage? A property-management company in the area should have these aggregated.
- How much new for-sale + rental construction is in the pipeline within 1–3 miles? Heavy new supply typically softens prices + rents 12–24 months out; constrained supply supports both.
Investment metrics
- 1% rule
- 2.88% ✓
- Cap rate
- 21.88%
- Cash-on-cash
- 55.68%
- DSCR
- 3.48
- GRM
- 2.9
CMA / ARV
- ARV (on-the-fly)
- $69,350
- Comps found
- 9
Show comp detail 9 sales within ~0.75 mi
| Address | Dist | Beds/Ba | Sqft | Sold | Price | $/sf | Match |
|---|---|---|---|---|---|---|---|
| 404 S Congress Ave | 0.00mi | 2/1.0 | 950 (0%) | 0mo | $14,000 | $15 | 100 |
| 705 S Division Ave | 0.21mi | 2/1.0 | 1,000 (+5%) | 6mo | $72,500 | $73 | 76 |
| 409 S Franklin Ave | 0.11mi | 2/1.0 | 1,041 (+10%) | 15mo | $97,500 | $94 | 66 |
| 205 S Congress Ave | 0.14mi | 2/1.0 | 820 (-14%) | 9mo | $64,000 | $78 | 63 |
| 511 W North St | 0.48mi | 3/1.0 (+1) | 1,000 (+5%) | 4mo | $26,000 | $26 | 60 |
| 204 N Cherry Ave | 0.40mi | 2/1.0 | 980 (+3%) | 21mo | $68,500 | $70 | 59 |
| 612 W Mason St | 0.36mi | 2/1.5 | 1,037 (+9%) | 10mo | $127,000 | $122 | 58 |
| 608 W Mason St | 0.35mi | 2/1.0 | 896 (-6%) | 24mo | $90,000 | $100 | 54 |
| 609 W Fulton St | 0.56mi | 2/1.0 | 919 (-3%) | 20mo | $56,000 | $61 | 52 |
Match score weights: distance 35% · size 25% · config 20% · recency 20%. Top-matched comps best support the ARV.
Projected returns pro-forma
-3.0% appreciation · 3.0% rent growth · sell at horizon
- IRR
- 54.1%
- Equity multiple
- 3.38×
- Total profit
- $13,351
- Equity at exit
- $2,982
- IRR
- 59.3%
- Equity multiple
- 6.91×
- Total profit
- $33,110
- Equity at exit
- $1,729
Cash invested: $5,600 (down + closing). Projections, not guarantees.
Landlord ↔ Tenant lean methodology
- Overall (STATE)
- 43 Moderately Tenant-Leaning
- State Illinois
- 43 Moderately Tenant-Leaning · D+7
- County
- — inherits STATE
- City
- — inherits STATE
ZIP-level market 61064
- Home prices YoY
- -29.6%
- Active inventory
- 19
- Price-to-rent
- 2.9×
Monthly cashflow live
- Estimated rent
- $575 medium interval (Pro) →
- Mortgage (P&I)
- −$105
- Tax from tax record
- −$81 /mo · $974/yr
- Insurance
- −$8
- HOA
- −$0
- Vacancy / Maint / Mgmt
- −$121
- Net cashflow
- $260
Break-even live
Sensitivity live
| Price | -10% $330 | -5% $323 | +0% $260 | +5% $254 | +10% $249 |
|---|---|---|---|---|---|
| Rent | -10% $214 | -5% $237 | +0% $260 | +5% $283 | +10% $305 |
| Rate | -1.0pp $270 | -0.5pp $265 | base $260 | +0.5pp $255 | +1.0pp $249 |
UW: 25.0% down · 7.5% · 30yr · 1.5% tax · 5.0% vac · 8.0% maint · 8.0% mgmt
Financing live
Cash to close
- Down payment
- $5,000
- Closing costs
- $600
- Reserves months
- —
- Total cash needed
- —
Loan-product check · same deal, 3 products live
Conventional
25% down · 7.5% · 30yr
- Down + closing
- —
- Monthly P&I
- —
- Monthly cashflow
- —
- DSCR
- —
- Eligible?
- —
Personal DTI + credit; lowest rate.
DSCR
20% down · 8.5% · 30yr
- Down + closing
- —
- Monthly P&I
- —
- Monthly cashflow
- —
- DSCR
- —
- Eligible?
- —
No personal income docs; deal must DSCR.
Hard money
10% down · 12.0% · 12mo
- Down + closing
- —
- Monthly P&I
- —
- Monthly cashflow
- —
- DSCR
- —
- Eligible?
- —
Short-term bridge; refi at stabilization.
Rent comps 1 comps
| Address | Beds | Baths | Sqft | Rent | $/sqft | DOM | Units | Dist |
|---|---|---|---|---|---|---|---|---|
| 307 S Division Ave Unit 4 Polo, IL | 1.0 | 1.0 | 600 | $575 | $0.96 | 45d | 1 | 0.06mi |
Listing history 2 events
-
2026-06-03remarks 272-char remark
-
2026-06-03$20,000 Pending
ⓘ Source: listings_history table (triggers on properties + properties_extension) + one-shot
backfill from property_details.listing_events for pre-trigger history.
Tax reassessment forecast IL · Partial reset (capped growth)
- Current annual tax
- $974 · $81/mo
- Projected year-2 tax
- $974 · $81/mo
- Expected delta
- $0/yr ($0/mo · 0.0%)
ⓘ Screening estimate from a state-policy table — verify with the county assessor before closing.
Climate risk First Street
- Flood 1/10 Low FEMA zone X (unshaded) · 0% chance over 30 yrs
- Wildfire 1/10 Low
- Heat 2/10 Low 7 d/yr ≥103°F today · 15 d/yr by 30 yrs out
- Wind 2/10 Low
- Air quality 2/10 Low 1 unhealthy d/yr today · 2 by 30 yrs out
Nearby sold comps map
Loading sold comps map…
Walkable amenities ~0.75 mi
Loading nearby amenities…
Taxation est. · year 1
- Rental income
- $6,900
- − Mortgage interest
- −$1,120
- − Property taxes
- −$974
- − Insurance
- −$100
- − Repairs & maintenance
- −$552
- − Management
- −$552
- − Depreciation
- −$582
- Taxable income
- $3,019
- Est. tax owed @ 24.0%
- −$725
- After-tax cash flow
- $2,393/yr
For passive investors: Depreciation is non-cash, so a rental often shows a tax loss while cash-flowing — sheltering income. Rental losses are passive: they offset passive income freely, and up to $25,000/yr can offset ordinary (W-2) income if you actively participate and your MAGI is under $100k (phasing out to $0 by $150k); unused losses carry forward. On sale, claimed depreciation is recaptured at up to 25%, and gains may owe capital-gains tax (a 1031 exchange can defer both). Figures are a year-1 estimate at your 24.0% rate — not tax advice; consult a CPA.
Schools (NCES district)
- District
- Polo CUSD 222
- NCES district ID
- 1732100
- Math proficiency
- 27% ▼ -6.00%
- Reading proficiency
- 40% ▼ -8.00%
- Median HH income
- $52,589
- Composite
- 29.3/100
- National rank
- #6555
- State rank
- #210 of 620 in IL
Livability — Polo
- Score
- 66/100
- State rank
- #548
- US rank
- #11547
Category grades
Schools grade is shown separately in the Schools card above.
Census & demographics
- Census place
- Polo, IL
- City population
- 3,891
- Population (ZIP)
- 3,891
Population outlook (Ogle County) Hauer SSP2
- Today (2025)
- 48,390 people
- By 2030
- 46,346 · -4.2%
- By 2040
- 41,772 · -13.7%
- By 2050
- 36,911 · -23.7%
- By 2075
- 27,130 · -43.9%
- By 2100
- 18,627 · -61.5%
Race, ethnicity, and origin ACS 2023
- Neighborhood character
- Predominantly White (97%)
- Race & ethnicity
- White 97% Two or more races 2% Hispanic / Latino 1%
- Common ancestry
- Lithuanian 2% Iranian 2% Romanian 2%
- Foreign-born
- 2% · Canada
- Languages at home
- 97% English-only · Spanish 1% Arabic 1% German/W. Germanic 1%
Political lean MEDSL · Ogle
- 2024 margin
- Strong R (+29.4) · D 34.5% · R 63.9% · Other 1.6%
- 2008→2024 swing
- -21.8pp toward R · 2008: -7.6pp · 2024: -29.4pp
- All cycles
- 2024: R+29.4 2020: R+25.9 2016: R+26.6 2012: R+16.7 2008: R+7.6
Not yet ingested
- Civics
- —
Market trends
- HPI YoY
- ▼ -63.65%
- Current HPI
- 151.3314
- Rent YoY
- —
- Metro
- —
- State GDP YoY
- ▲ 1.59%
- F500 in state
- 60
Industry mix (Fortune 500 HQ in IL)
| Industry | F500 HQs | Revenue |
|---|---|---|
| Insurance | 4 | $201B |
|
||
| Consumer Goods | 4 | $87B |
|
||
| Industrial Machinery | 3 | $64B |
|
||
| Healthcare | 2 | $55B |
|
||
| Retail / Pharmacy | 1 | $148B |
|
||
| Agriculture / Food | 1 | $86B |
|
||
Price history
2 events — show timeline
- 2026-06-02 Listing Removed — MRED as Distributed by MLS Grid
- 2026-06-02 Listed $20,000 MRED as Distributed by MLS Grid
Property tax history
+5.3%/yrLatest (2024): $974 · +9.2% YoY. Source: county tax records.
Cash-flow waterfall
monthlySold comps — $/sqft
last 12 mo · ≤1 miLoading sold comps…