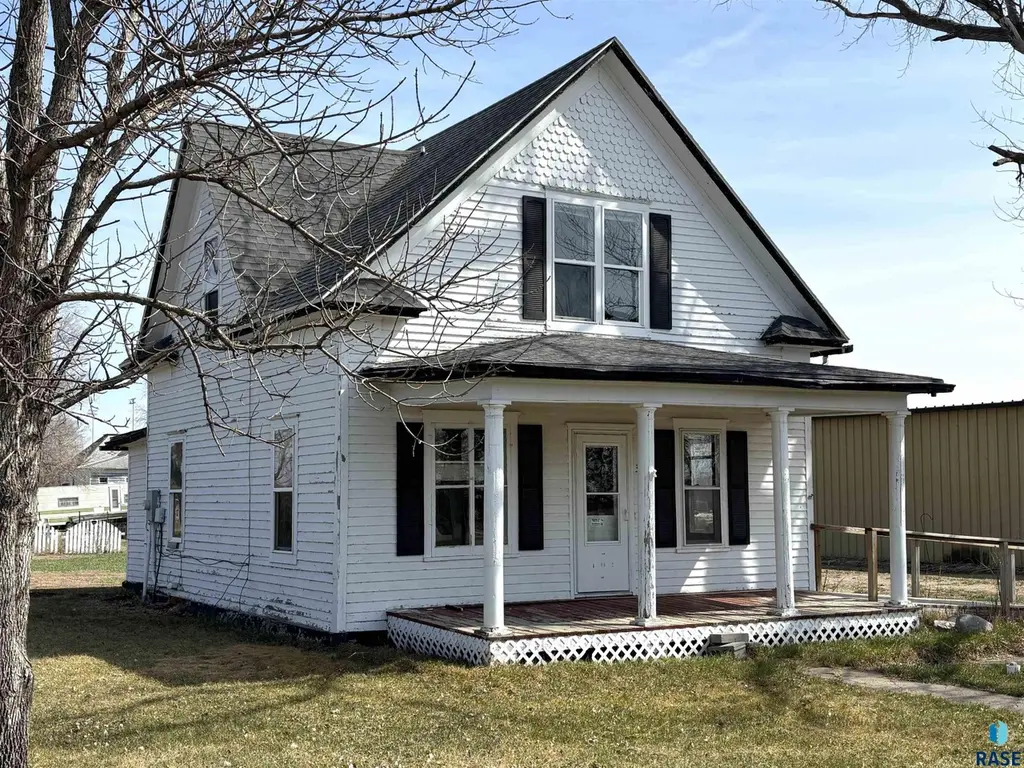
316 S Broadway Ave Ave · Miller, SD
Flood risk No data
- FEMA flood zone
- —
- Chance of flooding over 30 yrs
- —
- Est. flood insurance / yr
- —
Fire risk No data
- Est. fire insurance / yr
- —
Heat risk No data
- Hot days now (above threshold)
- —
- Hot days in 30 yrs
- —
Wind risk No data
- Chance of severe wind over 30 yrs
- —
Air-quality risk No data
- Unhealthy air days now
- —
- Unhealthy air days in 30 yrs
- —
Risk factors via First Street. Map © Google.
Why this score? — see what drove the B+ grade
The composite is a weighted blend of 9 inputs, each scored 0–100. Each bar is that input's sub-score; the figure is the points it added to the 100-point composite (weight × sub-score).
- Cash flow +30.0/30.0
- 1% rule +10.0/10.0
- DSCR +10.0/10.0
- ARV discount +7.5/15.0
- Appreciation +6.9/10.0
- Schools +4.4/10.0
- Livability +3.6/5.0
- Rent growth +2.5/5.0
- Condition / age +2.5/5.0
$64,900
🖨 Deal sheet 📄 Offer letter ✓ Due diligence
Key facts
- Stained-glass window
- Decorative doorknobs
- Newer windows
Tags
Property features AI
Finance
- Financial info: Annual tax amount listed
Exterior
- Utilities: Public water; Public sewer
- Home design: Single-family residence; 1.5-story design; Above-grade finished area approx. 1,174 sq ft; Land is owned
- Construction: Wood siding construction
- Exterior features: Composition roof; Lot dimensions approximately 87.5' x 140'
Interior
- Kitchen: Main-level kitchen (approx. 9' x 9')
- Bedrooms: Main-level master bedroom (approx. 9' x 9') off the living room; Upper-level bedroom (approx. 7' x 9') at top of stairs on the right; Upper-level bedroom (approx. 9' x 11') at top of stairs on the left
- Flooring: Vinyl flooring; Wood flooring
- Bathrooms: Main-level full bathroom; Upper-level bathroom with clawfoot tub, sink and toilet (3/4)
- Interior features: Stained glass window in the living room; Pantry with cellar access
- Laundry & utility: Main-level laundry/mudroom
Neighborhood map
What this means for you Summary
Snapshot
- This is a 3-bed/2.0-bath single-family listed at $65k.
Deal economics
- At list price, monthly cash flow is $411 ($5k/yr) — positive.
- The deal already cash-flows at list — no discount required.
- Meets the 1% rule at list price ($1k rent vs $65k).
- Recommended offer: $63k (3.0% below list) — sets the bar for market timing.
Location & tenants
- Location reads 72/100 on livability (#43 in SD) — a middle-class / working-renter tenant base. Strengths: crime A+, cost of living A+, housing A+; Watch: employment C-, health & safety C-, amenities F.
- Miller 29-4 (rural): math 46% / reading 57% proficiency, ranked #25 of 59 in SD (top 42%) — acceptable for families but not a draw, mixed tenant base, ~2y average lease.
- Market conditions: 15 active listings in the ZIP; 9 units permitted in Hand County in 2024 (0 in 5+ unit buildings).
Forward outlook
- In year one you build about $3k of equity ($449 loan paydown + $3k appreciation (3.9% local appreciation)).
- Hand County population projected at -13% by 2050 — secular population decline; favor cash flow + early exit over multi-decade hold.
- At projected returns (3.9% appreciation + 3.0% rent growth), your $18k cash investment doubles in ~3 years — after that, you're playing with house money.
Negotiation context
- It's been on market 36 days — a 3% lower offer ($63k) is reasonable based on typical stale-listing flexibility.
Risks & watch-outs
- Watch-outs: built in 1900 — expect roof / HVAC / electrical / plumbing capex.
Questions for the listing agent
- It's been on market 36 days. Have you received any prior offers? Is the seller open to a 3% concession, seller financing, or rate buy-down credit?
- Built in 1900 — when were the roof, HVAC, electrical panel, plumbing, and water heater last replaced?
- Is there a deadline driving the sale (1031 exchange, divorce, estate, relocation)? That informs how much negotiation room exists.
- What's the average days-on-market for RENTAL listings here right now (not sales)? A rising rental-DOM trend means longer vacancies and softer asking-rent achievability than the comps imply.
- What's the recent tenant-quality profile in this submarket — average credit score on applications, eviction rate, late-payment / NSF rate, and stable-employment percentage? A property-management company in the area should have these aggregated.
- How much new for-sale + rental construction is in the pipeline within 1–3 miles? Heavy new supply typically softens prices + rents 12–24 months out; constrained supply supports both.
Investment metrics
- 1% rule
- 1.68% ✓
- Cap rate
- 13.89%
- Cash-on-cash
- 27.13%
- DSCR
- 2.21
- GRM
- 5.0
CMA / ARV
- ARV (on-the-fly)
- $15,262
- Comps found
- 1
Show comp detail 1 sale within ~0.75 mi
| Address | Dist | Beds/Ba | Sqft | Sold | Price | $/sf | Match |
|---|---|---|---|---|---|---|---|
| 228 W 2nd St | 0.40mi | 3/1.0 | 1,072 (-9%) | 19mo | $13,750 | $13 | 48 |
Match score weights: distance 35% · size 25% · config 20% · recency 20%. Top-matched comps best support the ARV.
Projected returns pro-forma
3.88% appreciation · 3.0% rent growth · sell at horizon
- IRR
- 34.7%
- Equity multiple
- 3.04×
- Total profit
- $37,060
- Equity at exit
- $32,440
- IRR
- 34.0%
- Equity multiple
- 6.04×
- Total profit
- $91,648
- Equity at exit
- $52,689
Cash invested: $18,172 (down + closing). Projections, not guarantees.
Landlord ↔ Tenant lean methodology
- Overall (STATE)
- 83 Strongly Landlord-Friendly
- State South Dakota
- 83 Strongly Landlord-Friendly · R+16
- County
- — inherits STATE
- City
- — inherits STATE
ZIP-level market 57362
- Home prices YoY
- 2.7%
- Active inventory
- 15
- Price-to-rent
- 5.0×
Monthly cashflow live
- Estimated rent
- $1,088 medium interval (Pro) →
- Mortgage (P&I)
- −$340
- Tax est. 1.5%
- −$81 /mo · $974/yr
- Insurance
- −$27
- HOA
- −$0
- Vacancy / Maint / Mgmt
- −$228
- Net cashflow
- $411
Break-even live
UW: 25.0% down · 7.5% · 30yr · 1.5% tax · 5.0% vac · 8.0% maint · 8.0% mgmt
Financing live
Cash to close
- Down payment
- $16,225
- Closing costs
- $1,947
- Reserves months
- —
- Total cash needed
- —
Loan-product check · same deal, 3 products live
Conventional
25% down · 7.5% · 30yr
- Down + closing
- —
- Monthly P&I
- —
- Monthly cashflow
- —
- DSCR
- —
- Eligible?
- —
Personal DTI + credit; lowest rate.
DSCR
20% down · 8.5% · 30yr
- Down + closing
- —
- Monthly P&I
- —
- Monthly cashflow
- —
- DSCR
- —
- Eligible?
- —
No personal income docs; deal must DSCR.
Hard money
10% down · 12.0% · 12mo
- Down + closing
- —
- Monthly P&I
- —
- Monthly cashflow
- —
- DSCR
- —
- Eligible?
- —
Short-term bridge; refi at stabilization.
Listing history 2 events
-
2026-05-17status Pending
-
2026-04-10$64,900 Active
ⓘ Source: listings_history table (triggers on properties + properties_extension) + one-shot
backfill from property_details.listing_events for pre-trigger history.
Nearby sold comps map
Loading sold comps map…
Walkable amenities ~0.75 mi
Loading nearby amenities…
Taxation est. · year 1
- Rental income
- $13,053
- − Mortgage interest
- −$3,635
- − Property taxes
- −$974
- − Insurance
- −$324
- − Repairs & maintenance
- −$1,044
- − Management
- −$1,044
- − Depreciation
- −$1,888
- Taxable income
- $4,143
- Est. tax owed @ 24.0%
- −$994
- After-tax cash flow
- $3,935/yr
For passive investors: Depreciation is non-cash, so a rental often shows a tax loss while cash-flowing — sheltering income. Rental losses are passive: they offset passive income freely, and up to $25,000/yr can offset ordinary (W-2) income if you actively participate and your MAGI is under $100k (phasing out to $0 by $150k); unused losses carry forward. On sale, claimed depreciation is recaptured at up to 25%, and gains may owe capital-gains tax (a 1031 exchange can defer both). Figures are a year-1 estimate at your 24.0% rate — not tax advice; consult a CPA.
Schools (NCES district)
- District
- Miller 29-4
- NCES district ID
- 4647942
- Math proficiency
- 46% ▲ 3.00%
- Reading proficiency
- 57% ▬ 0.00%
- Median HH income
- $45,771
- Composite
- 43.58/100
- National rank
- #2978
- State rank
- #25 of 59 in SD
Livability — Miller
- Score
- 72/100
- State rank
- #43
- US rank
- #6023
Category grades
Schools grade is shown separately in the Schools card above.
Census & demographics
- Census place
- Miller, SD
- Population (ZIP)
- 1,940
Population outlook (Hand County) Hauer SSP2
- Today (2025)
- 3,149 people
- By 2030
- 3,052 · -3.1%
- By 2040
- 2,871 · -8.8%
- By 2050
- 2,744 · -12.9%
- By 2075
- 2,823 · -10.4%
- By 2100
- 3,275 · +4.0%
Race, ethnicity, and origin ACS 2023
- Neighborhood character
- Predominantly White (97%)
- Race & ethnicity
- White 97% Two or more races 1%
- Common ancestry
- Iranian 7% Portuguese 6% Polish 4%
- Foreign-born
- 1% · China, Canada
- Languages at home
- 95% English-only · German/W. Germanic 3% Chinese 1% Spanish 1%
Political lean MEDSL · Hand
- 2024 margin
- Solid R (+57.3) · D 20.7% · R 78.0% · Other 1.3%
- 2008→2024 swing
- -31.0pp toward R · 2008: -26.3pp · 2024: -57.3pp
- All cycles
- 2024: R+57.3 2020: R+57.7 2016: R+58.1 2012: R+36.1 2008: R+26.3
Not yet ingested
- Civics
- —
Market trends
- HPI YoY
- ▲ 3.88%
- Current HPI
- 148.2615
- Rent YoY
- —
- Metro
- —
- State GDP YoY
- ▲ 0.70%
- F500 in state
- 2
Industry mix (Fortune 500 HQ in SD)
| Industry | F500 HQs | Revenue |
|---|---|---|
| Utilities | 1 | $1B |
|
||
Price history
2 events — show timeline
- 2026-05-17 Pending — REALTOR® Association of the Sioux Empire
- 2026-04-10 Listed $64,900 REALTOR® Association of the Sioux Empire
Cash-flow waterfall
monthlySold comps — $/sqft
last 12 mo · ≤1 miLoading sold comps…