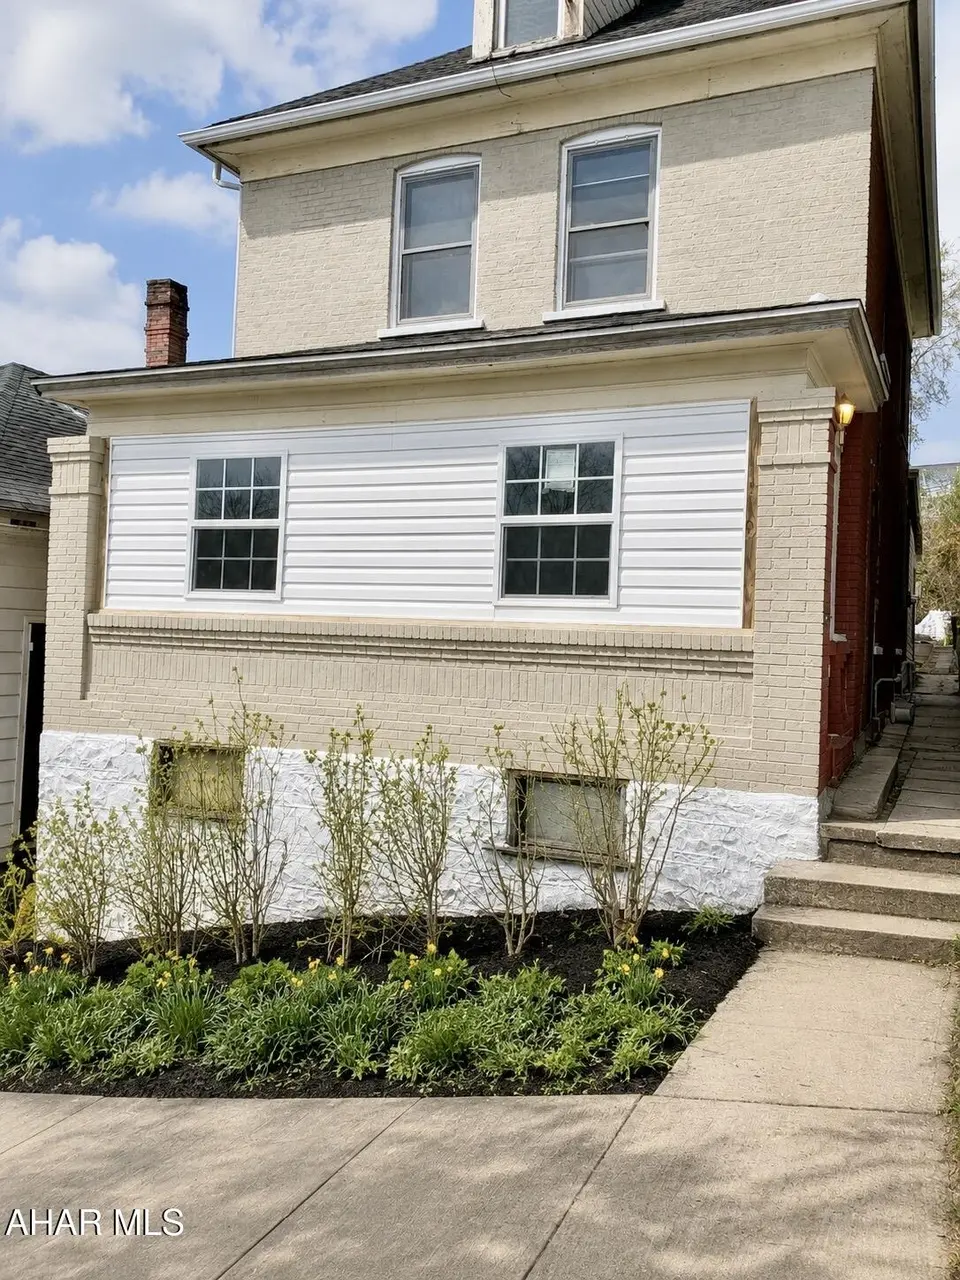
1927 15th Ave · Altoona, PA
Flood risk 1/10 · Minimal
- FEMA flood zone
- X (unshaded)
- Chance of flooding over 30 yrs
- 0.0%
- Est. flood insurance / yr
- $507 – $1,088
Fire risk 1/10 · Minimal
- Est. fire insurance / yr
- $511 – $949
Heat risk 3/10 · Minor
- Hot days now (above 95°F)
- 7 days/yr
- Hot days in 30 yrs
- 18 days/yr
Wind risk 2/10 · Minimal
- Chance of severe wind over 30 yrs
- —
Air-quality risk 2/10 · Minimal
- Unhealthy air days now
- 1 days/yr
- Unhealthy air days in 30 yrs
- 3 days/yr
Risk factors via First Street. Map © Google.
Why this score? — see what drove the B- grade
The composite is a weighted blend of 9 inputs, each scored 0–100. Each bar is that input's sub-score; the figure is the points it added to the 100-point composite (weight × sub-score).
- Cash flow +26.7/30.0
- ARV discount +15.0/15.0
- DSCR +9.2/10.0
- 1% rule +6.8/10.0
- Livability +4.0/5.0
- Schools +3.1/10.0
- Rent growth +2.5/5.0
- Condition / age +2.5/5.0
- Appreciation +0.0/10.0
$92,500
🖨 Deal sheet 📄 Offer letter ✓ Due diligence
Listing remarks
Clean, move-in ready, and full of charm! This 3 bedroom, 1 bath home features fresh paint, beautiful hardwood floors throughout, and a spacious family room perfect for relaxing or entertaining. The kitchen offers a convenient pantry for extra storage, while the enclosed front porch provides additional flexible living space. The finished attic with skylights showcases beautiful views and makes an ideal bedroom, office, or bonus room filled with natural light. Additional updates include PEX plumbing and newer roofs on the front porch and rear addition. Off-street parking in the back adds extra convenience. Whether you're looking for a place to call home or a solid investment opportunity, this
Key facts
- Fresh paint
- Finished attic
- Convenient pantry
Tags
Property features AI
Exterior
- Utilities: Public water
- Home design: Single family residence; Two levels
- Construction: Brick and vinyl siding construction
- Exterior features: Shingle roof
Interior
- Kitchen: Eat-in kitchen; Pantry
- Flooring: Hardwood; Wood; Carpet
- Bathrooms: 1 full bathroom
- Heating & cooling: Forced air heating (natural gas); Ceiling fan(s)
- Interior features: Eat-in kitchen; Pantry; Skylight(s)
Neighborhood map
What this means for you Summary
Snapshot
- This is a 3-bed/1.0-bath single-family listed at $92k.
Deal economics
- At list price, monthly cash flow is $252 ($3k/yr) — positive.
- The deal already cash-flows at list — no discount required.
- Meets the 1% rule at list price ($1k rent vs $92k).
- Cap rate 9.6% vs local median 5.8% in Altoona — top-decile yield for the area; either an underpriced asset or a hidden risk that comps aren't pricing in. Stress-test before assuming the spread holds.
Location & tenants
- Location reads 79/100 on livability (#237 in PA, #2,060 nationally) — a middle-class / working-renter tenant base. Strengths: commute A+, cost of living A+, housing A+; Watch: crime C-, employment D, amenities F.
- Altoona Area SD (urban): math 30% / reading 44% proficiency, ranked #406 of 539 in PA (top 75%) — families likely to look elsewhere, expect single-tenant / working-renter base with shorter leases.
- Market conditions: 186 active listings in the ZIP; 4 comparable units currently listed for rent nearby; rentals lingering (median 44d on market — plan ~5-8 weeks vacancy on turnover, expect pricing pressure); 100% of comp listings sitting > 30 days — soft ceiling on asking rent; 99 units permitted in Blair County in 2024 (0 in 5+ unit buildings).
Forward outlook
- Local home prices are declining (-3.0%/yr); year-one equity from $640 of loan paydown is wiped out by about $3k of value loss. Plan a longer hold.
- Blair County population projected at -18% by 2050 — secular population decline; favor cash flow + early exit over multi-decade hold.
- At projected returns (-3.0% appreciation + 3.0% rent growth), your $26k cash investment doubles in ~10 years — after that, you're playing with house money.
Negotiation context
- Only 4 days on market — expect competitive offers; lowballing is unlikely to land.
- 5 sale attempts since 22y ago with the ask held roughly flat each time — persistent listings suggest the price (not the market) is what's stuck; bring a comps-based counter.
- Current owner paid $25k; list at $92k implies a 270% gain — meaningful room to come down on a strong offer.
Risks & watch-outs
- Watch-outs: built in 1915 — expect roof / HVAC / electrical / plumbing capex.
Questions for the listing agent
- Built in 1915 — when were the roof, HVAC, electrical panel, plumbing, and water heater last replaced?
- Is there a deadline driving the sale (1031 exchange, divorce, estate, relocation)? That informs how much negotiation room exists.
- Schools are B-rated — typically a magnet for longer-tenancy family renters. What's the average tenant stay here, and is there a school-zone premium baked into asking?
- What's the average days-on-market for RENTAL listings here right now (not sales)? A rising rental-DOM trend means longer vacancies and softer asking-rent achievability than the comps imply.
- What's the recent tenant-quality profile in this submarket — average credit score on applications, eviction rate, late-payment / NSF rate, and stable-employment percentage? A property-management company in the area should have these aggregated.
- How much new for-sale + rental construction is in the pipeline within 1–3 miles? Heavy new supply typically softens prices + rents 12–24 months out; constrained supply supports both.
Investment metrics
- 1% rule
- 1.18% ✓
- Cap rate
- 9.56%
- Cash-on-cash
- 11.66%
- DSCR
- 1.52
- GRM
- 7.1
CMA / ARV
- ARV (on-the-fly)
- $141,183
- Comps found
- 12
Show comp detail 12 sales within ~0.75 mi
| Address | Dist | Beds/Ba | Sqft | Sold | Price | $/sf | Match |
|---|---|---|---|---|---|---|---|
| 2018 15th Ave | 0.07mi | 4/1.5 (+1) | 1,674 (-4%) | 6mo | $135,000 | $81 | 78 |
| 2022 Pine Ave | 0.34mi | 2/1.0 (-1) | 1,740 (-0%) | 1mo | $48,000 | $28 | 78 |
| 1605 22nd Ave | 0.37mi | 3/1.0 | 1,621 (-7%) | 1mo | $139,900 | $86 | 70 |
| 1329-31 21st Ave | 0.48mi | 3/1.5 | 1,786 (+2%) | 3mo | $195,000 | $109 | 69 |
| 1419 21st Ave | 0.43mi | 3/1.5 | 1,862 (+7%) | 3mo | $116,250 | $62 | 64 |
| 1100 17th Ave | 0.68mi | 3/1.0 | 1,748 (+0%) | 6mo | $65,000 | $37 | 63 |
| 1611 21st Ave | 0.32mi | 3/2.0 | 1,944 (+12%) | 3mo | $83,000 | $43 | 59 |
| 2408 12th St | 0.75mi | 3/1.5 | 1,707 (-2%) | 1mo | $230,000 | $135 | 58 |
| 1225 19th Ave | 0.55mi | 3/2.0 | 1,600 (-8%) | 2mo | $138,500 | $87 | 55 |
| 1406 20th Ave | 0.44mi | 4/1.0 (+1) | 1,558 (-11%) | 4mo | $27,000 | $17 | 53 |
| 1308 17th Ave | 0.48mi | 3/2.0 | 1,483 (-15%) | 5mo | $54,800 | $37 | 44 |
| 1315 21st Ave | 0.52mi | 4/2.0 (+1) | 1,968 (+13%) | 2mo | $160,000 | $81 | 44 |
Match score weights: distance 35% · size 25% · config 20% · recency 20%. Top-matched comps best support the ARV.
Projected returns pro-forma
-3.0% appreciation · 3.0% rent growth · sell at horizon
- IRR
- 1.0%
- Equity multiple
- 1.04×
- Total profit
- $1,032
- Equity at exit
- $13,792
- IRR
- 10.7%
- Equity multiple
- 1.83×
- Total profit
- $21,519
- Equity at exit
- $7,998
Cash invested: $25,900 (down + closing). Projections, not guarantees.
Landlord ↔ Tenant lean methodology
- Overall (STATE)
- 62 Landlord-Friendly
- State Pennsylvania
- 62 Landlord-Friendly · EVEN
- County
- — inherits STATE
- City
- — inherits STATE
ZIP-level market 16601
- Home prices YoY
- -24.9%
- Active inventory
- 186
- Price-to-rent
- 7.1×
Monthly cashflow live
- Estimated rent
- $1,088 medium interval (Pro) →
- Mortgage (P&I)
- −$485
- Tax from tax record
- −$84 /mo · $1,012/yr
- Insurance
- −$39
- HOA
- −$0
- Vacancy / Maint / Mgmt
- −$228
- Net cashflow
- $252
Break-even live
UW: 25.0% down · 7.5% · 30yr · 1.5% tax · 5.0% vac · 8.0% maint · 8.0% mgmt
Financing live
Cash to close
- Down payment
- $23,125
- Closing costs
- $2,775
- Reserves months
- —
- Total cash needed
- —
Loan-product check · same deal, 3 products live
Conventional
25% down · 7.5% · 30yr
- Down + closing
- —
- Monthly P&I
- —
- Monthly cashflow
- —
- DSCR
- —
- Eligible?
- —
Personal DTI + credit; lowest rate.
DSCR
20% down · 8.5% · 30yr
- Down + closing
- —
- Monthly P&I
- —
- Monthly cashflow
- —
- DSCR
- —
- Eligible?
- —
No personal income docs; deal must DSCR.
Hard money
10% down · 12.0% · 12mo
- Down + closing
- —
- Monthly P&I
- —
- Monthly cashflow
- —
- DSCR
- —
- Eligible?
- —
Short-term bridge; refi at stabilization.
Rent comps 4 comps
| Address | Beds | Baths | Sqft | Rent | $/sqft | DOM | Units | Dist |
|---|---|---|---|---|---|---|---|---|
| 2015 12th Ave Altoona, PA | 3.0 | 1.0 | 1600 | $1,200 | $0.75 | 43d | 1 | 0.18mi |
| 1489 Washington Ave Altoona, PA | 3.0 | 1.5 | 1050 | $850 | $0.81 | 43d | 1 | 0.18mi |
| 1326 14th Ave Altoona, PA | 3.0 | 1.0 | 1600 | $1,150 | $0.72 | 43d | 1 | 0.48mi |
| 1102 17th Ave Altoona, PA | 3.0 | 1.0 | 1430 | $899 | $0.63 | 43d | 1 | 0.69mi |
Listing history 9 events
-
2026-05-15status Pending
-
2026-05-11$92,500 Active
-
2018-10-01soldstatus $25,000
-
2018-07-26$19,900
-
2017-02-16$34,900
-
2015-12-08$64,000
-
2004-11-17soldstatus $21,000
-
2004-11-16soldstatus $21,000
-
2004-01-19$24,900
ⓘ Source: listings_history table (triggers on properties + properties_extension) + one-shot
backfill from property_details.listing_events for pre-trigger history.
Tax reassessment forecast PA · Partial reset (capped growth)
- Current annual tax
- $1,012 · $84/mo
- Projected year-2 tax
- $1,237 · $103/mo
- Expected delta
- +$225/yr (+$19/mo · 22.2%)
ⓘ Screening estimate from a state-policy table — verify with the county assessor before closing.
Climate risk First Street
- Flood 1/10 Low FEMA zone X (unshaded) · 0% chance over 30 yrs
- Wildfire 1/10 Low
- Heat 3/10 Moderate 7 d/yr ≥95°F today · 18 d/yr by 30 yrs out
- Wind 2/10 Low
- Air quality 2/10 Low 1 unhealthy d/yr today · 3 by 30 yrs out
Nearby sold comps map
Loading sold comps map…
Walkable amenities ~0.75 mi
Loading nearby amenities…
Taxation est. · year 1
- Rental income
- $13,057
- − Mortgage interest
- −$5,181
- − Property taxes
- −$1,012
- − Insurance
- −$462
- − Repairs & maintenance
- −$1,045
- − Management
- −$1,045
- − Depreciation
- −$2,691
- Taxable income
- $1,620
- Est. tax owed @ 24.0%
- −$389
- After-tax cash flow
- $2,630/yr
For passive investors: Depreciation is non-cash, so a rental often shows a tax loss while cash-flowing — sheltering income. Rental losses are passive: they offset passive income freely, and up to $25,000/yr can offset ordinary (W-2) income if you actively participate and your MAGI is under $100k (phasing out to $0 by $150k); unused losses carry forward. On sale, claimed depreciation is recaptured at up to 25%, and gains may owe capital-gains tax (a 1031 exchange can defer both). Figures are a year-1 estimate at your 24.0% rate — not tax advice; consult a CPA.
Schools (NCES district)
- District
- Altoona Area SD
- NCES district ID
- 4202340
- Math proficiency
- 30% ▼ -15.00%
- Reading proficiency
- 44% ▼ -15.00%
- Median HH income
- $38,465
- Composite
- 30.85/100
- National rank
- #6130
- State rank
- #406 of 539 in PA
Livability — Altoona
- Score
- 79/100
- State rank
- #237
- US rank
- #2060
Category grades
Schools grade is shown separately in the Schools card above.
Census & demographics
- Census place
- Altoona, PA
- County
- Blair County · 59,867 people
- City population
- 59,867
- Metro
- Altoona, PA
- Population (ZIP)
- 33,515
- Household income
- $58,070
- Rent vs Own
- Severe rent burden
- 715.0
Population outlook (Blair County) Hauer SSP2
- Today (2025)
- 121,571 people
- By 2030
- 117,966 · -3.0%
- By 2040
- 109,174 · -10.2%
- By 2050
- 99,542 · -18.1%
- By 2075
- 76,775 · -36.8%
- By 2100
- 54,326 · -55.3%
Race, ethnicity, and origin ACS 2023
- Neighborhood character
- Predominantly White (90%)
- Race & ethnicity
- White 90% Two or more races 5% Black 3% Hispanic / Latino 1%
- Common ancestry
- Romanian 5% Slovak 2% Lithuanian 2%
- Foreign-born
- 1% · Vietnam
- Languages at home
- 97% English-only · German/W. Germanic 1% Spanish 1%
Political lean MEDSL · Blair
- 2024 margin
- Solid R (+43.5) · D 27.9% · R 71.4%
- 2008→2024 swing
- -19.2pp toward R · 2008: -24.3pp · 2024: -43.5pp
- All cycles
- 2024: R+43.5 2020: R+43.5 2016: R+46.4 2012: R+33.5 2008: R+24.3
Not yet ingested
- Civics
- —
Market trends
- HPI YoY
- ▼ -60.97%
- Current HPI
- 183.9907
- Rent YoY
- —
- Metro
- Altoona, PA
- State GDP YoY
- ▲ 1.68%
- F500 in state
- 34
Industry mix (Fortune 500 HQ in PA)
| Industry | F500 HQs | Revenue |
|---|---|---|
| Healthcare | 2 | $309B |
|
||
| Insurance | 2 | $27B |
|
||
| Telecommunications / Media | 1 | $124B |
|
||
| Industrial Distribution | 1 | $22B |
|
||
| Financial Services | 1 | $20B |
|
||
| Chemicals / Materials | 1 | $18B |
|
||
Price history
+271.5% since first listed9 events — show timeline
- 2026-05-15 Pending — AHARMLS
- 2026-05-11 Listed $92,500 AHARMLS
- 2018-10-01 Sold (MLS) $25,000 AHARMLS
- 2018-07-26 Listed $19,900 AHARMLS
- 2017-02-16 Listed $34,900 AHARMLS
- 2015-12-08 Listed $64,000 AHARMLS
- 2004-11-17 Sold (MLS) $21,000 AHARMLS
- 2004-11-16 Sold (Public Records) $21,000 Public Records
- 2004-01-19 Listed $24,900 AHARMLS
Property tax history
-6.7%/yrLatest (2025): $1,012 · +13.0% YoY. Source: county tax records.
Cash-flow waterfall
monthlySold comps — $/sqft
last 12 mo · ≤1 miLoading sold comps…